Actividade física habitual em crianças e adolescentes : estudo por acelerometria dos contextos de realização da prática
205
0
0
Texto
(2) Silva, Pedro (2009). Actividade Física Habitual em Crianças e Adolescentes Estudo por acelerometria dos contextos de realização da prática.. Porto: P. Silva. Dissertação de Doutoramento em Actividade Física e Saúde. Centro de Investigação em Actividade Física, Saúde e Lazer. Faculdade de Desporto. Universidade do Porto.. Palavras-chave: PADRÕES DE ACTIVIDADE FÍSICA, ACELEROMETROS, CONTEXTOS DA ACTIVIDADE, JOVENS..
(3) Try not to become a man of success but rather try to become a man of value.. Albert Einstein. III.
(4)
(5) Agradecimentos / Acknowledgements. Agradeço a Deus pelo que É e pelo que sou.. À Daniela por sermos um. A...-te À Gabriela por se ter juntado a nós no meio deste caminho para dar um novo sentido a tudo. À Isabela que veio dar forças para a meta final.. À nossa família por estarem sempre connosco mesmo nós mais ausentes.. Aos professores Jorge Mota e Gregory Welk que foram os meus mentores, que reconheço não ser tarefa fácil.... Aos colegas de doutoramento pela partilha do pioneirismo e das aventuras neste processo.. Ao Dale Esliger por partilhar comigo um pedaço do seu caminho.. A todos do CIAFEL pelas lições partilhadas, desafios propostos e barreiras transpostas.. Às instituições que permitiram e apoiaram a execução deste projecto, nomeadamente: a Fundação para a Ciência e Tecnologia pela concessão da bolsa de investigação e o Centro de Investigação em Actividade Física, Saúde e Lazer da Faculdade de Desporto da Universidade do Porto; ao Ministério da Educação pela concessão de equiparação a bolseiro.. V.
(6)
(7) Table of Contents Acknowledgements/ Agradecimentos ……………………………………….… V Table of Contents ………..……………………………………………………..… VII List of Figures ………..………………………………………………………...…... X List of Tables ………..…………………………………………………………….. XII List of abbreviations ………..……………………………………………………... XIV Resumo ………..…………………………………………………………………... XV Abstract ………..…………………………………………………………………. XVII Resumé ………..………………………………………………………………….. XIX Chapter 1: 1.1 Introduction ………………………………………………….... 23 1.2 Aims ………..…………………………………………………… 25 Chapter 2: 2.1 Physical Activity Contexts Manuscript: Psychosocial correlates of Physical Activity in two cultural contexts: Different pathways? 2.1.1 Abstract …………………………………………….... 30 2.1.2 Introduction ………..………………………………… 31 2.1.3 Methods …………………………………………….... 33 2.1.4 Results ………..……………………………………… 39 2.1.5 Discussion ………..…………………………………. 47 2.1.6 References ………..…………………………………. 51 Chapter 3: 3.1 Individual contexts Manuscript: Lifespan snapshot of Physical activity assessed by accelerometry in Porto 3.1.1 Abstract ………..…………………………………….. 56 3.1.2 Introduction ………..………………………………… 57 3.1.3 Methods ………..…………………………………….. 58 3.1.4 Results ………..……………………………………… 60 3.1.5 Discussion ………..…………………………………. 67 3.1.6 References ………..…………………………………. 73 Chapter 4: 4.1 Time contexts – the accelerometer Manuscript: Technical Reliability Assessment of the. VII.
(8) Actigraph GT1M Accelerometer 4.1.1 Abstract ………..…………………………………….. 80 4.1.2 Introduction ………..………………………………… 81 4.1.3 Methods ………..…………………………………….. 82 4.1.4 Results ………..……………………………………… 86 4.1.5 Discussion ………..…………………………………. 91 4.1.6 References …......................................................... 96 4.2 Season Manuscript: Seasonal Differences In Physical Activity And Sedentary Patterns: The Relevance Of The PA Context. 4.2.1 Abstract ………..…………………………………… 101 4.2.2 Introduction ………..………………………………. 102 4.2.3 Methods ………..…………………………………… 103 4.2.4 Results ………..…………………………………….. 106 4.2.5 Discussion …..……………………………………... 112 4.2.6 References …..……………………………………... 116 Chapter 5: 5.1 Space contexts – Country, Community Manuscript: Differences in the Physical Activity pattern between Portuguese and Spanish adolescents 5.1.1 Abstract ………..…………………………………… 121 5.1.2 Introduction …..……………………………………. 122 5.1.3 Methods ………..…………………………………… 123 5.1.4 Results …..………………………………………….. 125 5.1.5 Discussion …..……………………………………... 130 5.1.6 References …..……………………………………... 134 5.2 School free-time Manuscript: Physical Activity in High School during the “freechoice” periods 5.2.1 Abstract ………..…………………………………… 137 5.2.2 Introduction ………..………………………………. 138 5.2.3 Methods ………..…………………………………… 139 5.2.4 Results ………..…………………………………….. 141. VIII.
(9) 5.2.5 Discussion …..……………………………………... 145 5.2.6 References …..……………………………………... 150 5.3 School sports Manuscript: Physical activity patterns in Portuguese adolescents the contribution of extra-curricular sports 5.3.1 Abstract ………..…………………………………… 155 5.3.2 Introduction ………..………………………………. 156 5.3.3 Methods ………..…………………………………… 157 5.3.4 Results ………..…………………………………….. 159 5.3.5 Discussion …..……………………………………... 164 5.3.6 References …..……………………………………... 168 Chapter 6: 6.1 Individual in Spacetime - Key Findings ………..……….. 174 6.2 Strengths and Limitations ………..……………….. 179 6.3 Future Directions ………..………………………….. 182 References ………..……………………………………………………………… 184 List of Publications ………..………………………………………….………… 205. IX.
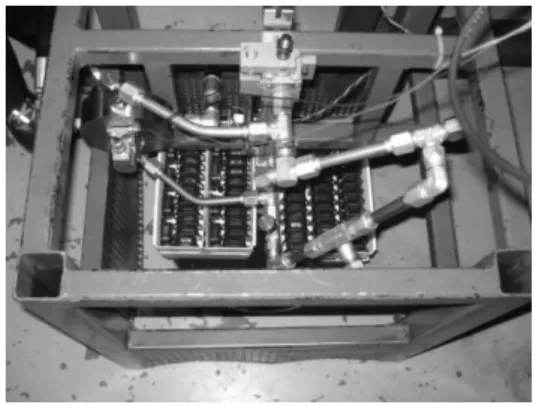
(10) List of Figures Chapter 2 Figure 1 – Conceptual diagram of the YPAPM core. ……………………...…... 35 Figure 2 – Conceptual diagram of the YPAPM core applied in the USA sample (standardize regression weights; * p<.001, a p= .029, b p= .008; CFI= .986; RMSEA= .031). The standardized coefficients for the overall test of the model when statistically significant are accompanied by an asterisk or letter. ……… 43 Figure 3 – Conceptual diagram of the YPAPM core applied in the PT sample (standardize regression weights; * p<.001, a p=.018; CFI= .92; RMSEA= .06). The standardized coefficients for the overall test of the model when statistically significant are accompanied by an asterisk or letter. …………………………... 46. Chapter 3 Figure 1 – Differences between genders in the physical activity intensities (Mean), according to age groups. ………………………………………………… 64 Figure 2 – Differences in sustained physical activity, for periods of at least 10 minutes in MVPA. ………………………………………………………………….. 66. Chapter 4 Figure 4. Mechanical shaker table complete with Actigraph GT1M accelerometers positioned for calibration testing. ………………………………. 83 Figure 2. Average counts per 15sec epoch for 50 Actigraph GT1M accelerometers across 6 test conditions (error bars represent 1SD). ………... 88 Figure 3. Mean different percent error among a batch of 50 Actigraph GT1M accelerometers across the six test conditions. ………………………………….. 89. Chapter 4.2 Figure 1 – Seasonal differences in MVPA (min) according to in-school and after-school periods (repeated measures analyses of variance). …………… 108 Figure 2 – Mean differences in MVPA between seasons according to gender. ………………………………………………………………………………………. 109. X.
(11) Figure 3 – Mean differences in sedentary activity between seasons according to gender. …………………………………………………………………………. 110. Chapter 5 Figure 1 –Differences between the two cities in mean MVPA (min) by day of the week. ……….………………………………………………………………………. 128. Chapter 5.2 Figure 1 – Mean counts.min-1 during the different school free-choice periods by gender and school type. …………………………………………………………. 144. Chapter 5.3 Figure 1 – Minutes of MVPA by gender, in each day of the week, for the four different groups: 1) No EC Sports; 2) School Sports; 3) Club Sports; 4) With both Sports (shaded box represents PA guidelines Zone). ………………….. 161. XI.
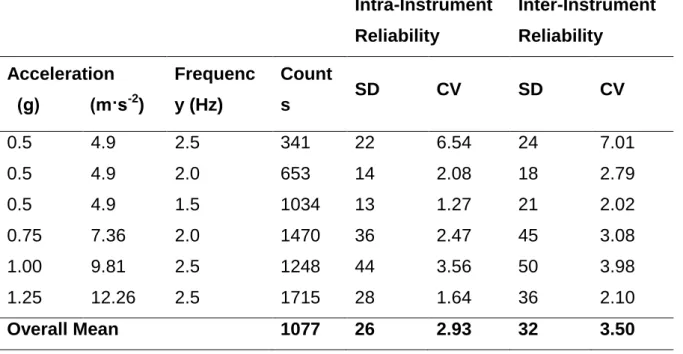
(12) List of Tables Chapter 2 Table 1 – Descriptive characteristics for adolescents participating in the study. ………………………………………………………………………………………… 40 Table 2 - Bivariate Pearson Product-Moment Correlations (below the diagonal), Means and Standard Deviations of Physical Activity and Psychosocial Correlates in the USA. …………………………………………………..………… 42 Table 3 - Bivariate Pearson Product-Moment Correlations (below the diagonal), Means and Standard Deviations of Physical Activity and Psychosocial Correlates in the Portugal. ……………………………………………..………..… 45. Chapter 3 Table 1 – Characteristics of the sample (Mean and SEM). ..………………..… 61 Table 2 – Physical activity intensities (Mean and SEM), according to age groups. ..…………………………………………………………………………...… 63 Table 3 – Number of days with compliance of the physical activity guidelines, adjusted to the number of accelerometer valid days (Mean Percentage). …... 65. Chapter 4 Table 1. Comparison of mean counts per 15sec epoch and reliability statistics across the six test conditions in Experiment 1. …………………………........… 86 Table 2. Comparison of mean steps per 15sec epoch and reliability statistics across the six test conditions in Experiment 1. …………………………........… 87 Table 3. Intra-class Correlation of the twenty replicate, 15 second epochs across each of the six test conditions in Experiment 1. ……………………...… 90 Table 4. Comparison of mean counts per 15 seconds and reliability statistics across the eighteen test conditions in Experiment 2. . ……………………....… 91. Chapter 4.2 Table 1 – Descriptive characteristics for participants in the study, mean (SD). ….…………………………………………………………………………………… 107. XII.
(13) Table 2 – Mean MVPA minutes (SD) on after-school period, and the context of those activities (reported by diary), according to gender and season. ……… 111. Chapter 5 Table 1 – Descriptive characteristics for participants in the study, mean (SD). ….…………………………………………………………………………………… 126 Table 2 – Linear regression model for the PA response variables, using City, Gender, Age and BMI as explanatory variables. ……………………………… 129. Chapter 5.2 Table 1 – Descriptive characteristics for adolescents participating in the study. ………………………………………………………………….…………………… 142 Table 2 – Linear regression predicting PA (cpm) in the different free-choice periods. ….…………………………………………………….…………………… 143. Chapter 5.3 Table 1 – Descriptive characteristics (Mean Standard deviation) for adolescents participating in the study. ………………………………….…………………...… 160 Table 2 – Logistic regression model for the recommended amount of PA given the participation on EC-sports for the entire sample. …..............................… 162 Table 3 – Logistic regression model for the recommended amount of PA given the participation on EC-sports by gender. …………….…………………......… 163. Chapter 6 Table A - Most common criteria‟s to process the accelerometer data. ......… 181. XIII.
(14) List of abbreviations BMI - Body Mass Index CHD – Cardiovascular Disease PA – Physical Activity LPA – Light Physical Activity MPA – Moderate Physical Activity VPA – Vigorous Physical Activity VVPA – Very Vigorous Physical Activity MVPA – Moderate To Vigorous Physical Activity CSA – Computer Science Application Accelerometer MTI – Manufacturing Technology Inc. SPSS - Statistical Package for the Social Sciences AMOS – Analysis of MOment Structures YPAP – Youth Physical Activity Promotion Model YMCLS – Youth Media Campaign Longitudinal Survey CDC – Centers for Disease Control and Prevention VERB – Youth Media Campaign PACES – Physical Activity Enjoyment Scale LEAP - Lifestyle Education For Activity Project NHANES - National Health and Nutrition Examination Survey EYHS – European Youth Heart Study MET - Metabolic Equivalent. XIV.
(15) Resumo Desenvolvimentos. recentes. nos. monitores. de. actividade. baseados. na. acelerometria tornam possível a avaliação objectiva da actividade física (AF) de uma forma sistemática. O objectivo deste trabalho pretende descrever os padrões da AF e o seu contexto. A série de estudos foi elaborada de forma a ampliar (zoom) a análise da AF, isto é, progride dos principais factores de influência até intervalos de espaço-tempo onde esta ocorre. No estudo 1, o modelo da promoção da AF em jovens (Welk, 1999), que analisa mediadores da AF, foi aplicado pela primeira vez em jovens Portugueses e comparado com os EUA. Avançamos no detalhe da análise da AF (estudo 2) ao avaliar as diferenças na quantidade de AF, de acordo com a idade e género, numa abrangente população residente na área do Porto. O acelerómetro foi central no nosso trabalho para fornecer o constructo do tempo, por isso a sua fiabilidade foi estudada (estudo 3). O estudo 4 caracterizou a variação sazonal da AF e do comportamento sedentário, tentando compreender as implicação dos contextos das actividades. O constructo do espaço foi considerado no estudo 5 ao comparar a AF de jovens de diferentes países. A escola é considerada como o espaço mais relevante para os jovens. Por isso, a quantidade de AF em diferentes períodos de “tempo livre” na escola e o impacto das actividades desportivas extra-curriculares foram também analisados (estudo 6 e 7 respectivamente). Os resultados apontam para o facto de que os jovens mais novos poderão receber o apoio dos pares para a AF através do gosto pela prática, enquanto que os mais velhos através do sentido de competência. Colectivamente, este trabalho apresenta informação relevante acerca dos padrões de AF e suas tendências na população da área do Porto. Os jovens foram mais activos no verão e apresentaram valores superiores de AF fora da escola. O inverno poderá ser uma barreira para o contexto preferido da AF nos rapazes. O local de residência teve impacto no cumprimento da recomendações de AF e os padrões de AF foram mais diferenciados ao fim-de-semana. O recreio como espaço activo diminuiu com a idade. Assim, podemos concluir que os baixos níveis de AF dos jovens da área do Porto deverá ser um motivo de preocupação e intervenção. Grande ênfase deverá ser dada á escola para a disponibilização de contextos que promovam AF. Palavras-chave: ACTIVIDADE FÍSICA, ACELERÓMETRO, ESCOLA, ESPAÇOTEMPO.. XV.
(16)
(17) Abstract Recent developments of portable accelerometry-based activity monitors make it possible to objectively monitor physical activity behavior in a more systematic way. The aim of this research was to better decipher the patterns and context of physical activity behavior. The series of studies uses a “zooming” perspective that progresses from research on behavioral correlates to time settings and contexts (space-time) for physical activity and ultimately to public health surveillance. In study 1, the Youth Physical Activity Promotion Model (Welk, 1999), that addresses correlates of physical activity (PA), was applied in the Portuguese youth and compared to the US. In study 2, we “zoom in” by evaluating age and gender differences in levels of PA in a large and diverse sample of Porto area residents. The accelerometer was central in our research to provide the time construct; therefore in study 3 we studied the reliability of the Actigraph GT1M model. The next study (study 4), also used a time perspective by characterizing seasonal variation in PA and sedentary behavior, and understand the implication of activity choices and settings. The space construct was considered next by comparing adolescents‟ PA patterns living in two different countries (study 5). School is considered the most relevant space for youth. Therefore, the amount of PA on different “free-time” periods in school, and the impact of extra-curricular sports (ECSports) in youth‟s PA were also analyzed (study 6 and study 7). Our results point to the fact that younger youth might receive peer support through enjoyment, and older youth received the influence of peer support through skill and self-worth processes. Collectively, the study provides valuable information about physical activity patterns and trends in the Porto population. Youth were more active in the summer and activity levels were higher after school than in school. Winter season may be a barrier to boy‟s preferred PA context. Location of residence was found to have impact on the achievement of PA guidelines, and PA patterns differences were more marked on weekends. The relevance of recess as an active opportunity is reduced with the age increase. The low level of PA in Porto adolescents is a matter of concern and suggests that interventions are needed. These results emphasize the role of schools to provide contexts where youth can increase PA. Key-words: PHYSICAL ACTIVITY, ACCELEROMETER, SCHOOL, SPACE-TIME CONTEXTS.. XVII.
(18)
(19) Resumé Des développements récents, dans le cadre des engins moniteurs de l‟activité et doués d‟accéléromètres, ont rendu possible l‟observation de l‟activité physique (AP) de façon plus systématisée. L‟objectif de cette recherche est d‟améliorer l‟interprétation des tendances qui sont propres au comportement de l‟AP et d‟encadrer ces tendances dans leur contexte spatio-temporel. Cette étude aborde plusieurs plans à diverses échelles qui vont depuis la corrélation du comportement de l‟AP dans son contexte spatial et temporel, jusqu‟à la surveillance de la santé publique. Le modèle dit de «Promotion de l‟AP Chez les Jeunes» (Welk, 1999), qui modélise ces corrélations, a été appliqué à un ensemble de jeunes Portugais dont les résultats ont été comparés avec ceux des jeunes des Etats-Unis (étude 1). Un des plans abordés par cette étude consiste à évaluer des différences d‟âge et de sexe entre les niveaux d‟AP d‟un échantillon représentatif des résidents de la zone de la ville de Porto (étude 2). L‟accéléromètre a été central dans notre recherche pour fournir des données en continu dans le cadre du contexte temporel. Du coup, il aura fallu procéder à la validation de l‟accéléromètre en tant qu‟instrument de mesure pour cet effet; et une étude (étude 3) sur la fiabilité du modèle GT1M d‟Actigraph fut réalisée. Par la suite, avec ces données, il fut possible de caractériser la variation saisonnière de l‟AP, ainsi que le comportement sédentaire (étude 4). Ceci a permit de comprendre les implications du choix du type d‟activité et du choix du contexte spatio-temporel. D‟autre part, une comparaison fût faite entre les AP des adolescents vivants dans deux pays différents (étude 5). L‟école est considéré le lieu le plus important pour les jeunes. Du coup, la quantité d‟AP selon les divers temps-libres procurés dans l‟enceinte de l‟école, ainsi que l‟impact des sports extracurriculaires (Sports-EC), furent soumit à l‟analyse (étude 6 et 7). Les résultats montrent que les plus jeunes sont stimulés à l‟AP par leurs pairs à travers l‟amusement, alors que les adolescents le sont plutôt à travers la mise en valeur de leurs capacités physiques. Les résultats de cette étude montrent que dans la ville de Porto, dans les quartiers résidentiels, les taux de conformité de l‟AP étaient bas par rapport aux directives d‟AP actuels. Ce résultat se classifie comme étant fiable par le fait qu‟il est basé sur une. XIX.
(20) étude d‟accélérométrie, doublée du fait que l‟accéléromètre fut considéré comme étant un instrument fiable. Les résultats montrent aussi que les jeunes sont plus actifs pendant l‟été que pendant l‟hiver, et que les niveaux d‟activités sont plus élevés après l‟école que pendant l‟école. La saison d‟hiver peut être une barrière aux lieux favoris d‟AP pour les garçons. Le lieu de résidence fut trouvé comme ayant un impact significatif sur l‟accomplissement des directives d‟AP ; et les différences entre les tendances d‟AP sont plus marquées pendant les week-ends. La récréation en tant qu‟opportunité active d‟engager de l‟AP perd ce statut avec l‟âge. Les bas niveaux d‟AP des adolescents de la ville de Porto sont matière de préoccupation et suggèrent qu‟une intervention serait salutaire. Ces résultats mettent en valeur le rôle de l‟école comme contexte privilégié où les jeunes peuvent augmenter leur AP.. Mots-clef: ÉCOLE, ACTIVITE PHYSIQUE, ACCELEROMETRES, CONTEXTE D‟ESPACE-TEMPS.. XX.
(21) Chapter 1.
(22)
(23) Chapter 1 1.1. Introduction. Studying the health behaviors in the population is justified by the fact that a significantly proportion of mortality and mobility in developed societies is a result of negative behavior patterns to health, and because these behavior patterns can be changed. The combined effects of the transition to a sedentary lifestyle and attendant dietary changes have resulted in high rates of coronary heart disease and an epidemic of overweight/obesity in postindustrial societies. Although mortality associated with coronary heart disease has declined, due largely to biomedical advances, overweight and obesity have increased at a consistent pace. The primary contributors to this trend are population reductions in physical. activity. (energy. expenditure). and. increased. calorie. (energy). consumption (Malina & Little, 2008). Portugal is among the European countries with higher prevalence in Obesity. A survey in adults (aged 18-64) collected objective body mass index (BMI) values of 8116 participants, and the main findings were as follows: 2.4% of the sample had low weight (BMI < 18.5); 39.4% were overweight (BMI between 25.0 and 29.9); and 14.2% obese (BMI > or = 30). Moreover, the study stated that the overall overweight/obesity prevalence increased from 49.6% (in 1995-1998) to 53.6% (in 2003-2005) (do Carmo, et al., 2008). Other studies also have shown a high prevalence of overweight and obesity (31%) in Portuguese children aged 7-9 years (Padez, Fernandes, Mourao, Moreira, & Rosado, 2004), and in adolescents (Ribeiro, et al., 2003). Those obesity rates are comparable with childhood obesity prevalence rates found in other Southern European countries, and higher than those found in North European countries (Lobstein & Frelut, 2003). Consistent with the higher overweight prevalence, research has demonstrated that physical activity levels, assessed through questionnaires, in this population are also lower compared to other countries (Vaz de Almeida, et al., 1999). The potential burden on public health has led to worldwide interest in. 23.
(24) understanding physical activity behavior. Most research and reports have relied on self-reported measures, and participants are generally categorized into activity levels on the basis of overall descriptions of activity. frequency. and intensity, without attempting to categorize the potential differences in. the. pattern. of accumulated physical activity over time (Metzger, et al.,. 2008). Recent developments of portable accelerometry-based activity monitors make it possible to objectively monitor physical activity behavior in a more systematic way. They are particularly useful because they eliminate the potential for recall bias and social desirability bias, and they do not depend on literacy. Accelerometers provide more powerful information that may help define the dose necessary to provide health outcomes. They can also enhance our understanding of physical activity (PA) behavior, provide better ways to assess interventions and improve population surveillance. Some studies have been carried out using accelerometry in or with Portuguese youth. (Sardinha, et al., 2008) demonstrated that PA is associated with insulin resistance independent of total and central fat mass in children. These results emphasize the importance of decreasing sedentary behavior and increasing time spent in moderate- and vigorous-intensity activity in children, which may have beneficial effects on metabolic risk factors regardless of the degree of adiposity. In a study by (Lopes, Vasques, Maia, & Ferreira, 2007) boys had more minutes a day of vigorous PA (VPA) and very vigorous PA (VVPA) than girls. PA decreased with age. The subjects of this study, aged 6 to 15, fulfilled the recommendations of 60 min per day of moderate to vigorous PA (MVPA). Another Portuguese study (Santos, Guerra, Ribeiro, Duarte, & Mota, 2003) with 157 children (boys n=64 and girls n=93), aged 8 to 15 years-old. The CSA activity monitor (now called the MTI or Actigraph) was used as an objective measure of daily physical activity. Each student in the study wore the CSA 3 times during the week of monitoring. Boys were involved in more MVPA than girls, however only in the 11-13 year old group were found significant differences (p<0.05). Within gender, significant differences were found out among 11-13 years old (48.7 min) and 14-16 years (72.2 min).. 24.
(25) One of the first studies in Portugal analyzing the context of PA behavior (Mota, et al., 2005) showed that participation in MVPA during recess contributes significantly more to the total amount of physical activity (P < 0.05) for girls (19%) than boys (15%) While the percentage of time engaged in MVPA during recess time at school accounts for a small amount of the daily MVPA (6% for boys and 8% for girls), the results suggest that school recess time is an important setting to promote MVPA and contributes to daily physical activity in young children, especially in girls. Numerous studies have been conducted on correlates of physical activity in youth and the literature indicates that children‟s and adolescents‟ PA are influenced by a large group of factors, including, environmental, social, psychological and cultural ones (Dishman, et al., 2004; Sallis & Owen, 1999b; Sallis, Kraft, & Linton, 2002b; Van Der Horst, Paw, Twisk, & Van Mechelen, 2007). Hence, adolescent´s PA is best described as a profile rather than a single entity, and such profiles are characterized as a complex matrix of behaviors that take place in a range of social contexts, each with its own set of physiological, psychological and sociological determinants and outcomes. Research on the tracking of physical activity over the lifespan has been somewhat equivocal, so one approach to clarifying this issue is to determine the types and elements of PA that cause some youth to be more active than others. This may help identify patterns that facilitate long term involvement or, alternately, identify groups that may be at risk of dropping out from a more active lifestyle (Tammelin, 2005).. 1.2. Aims. The main theme of this research was to better decipher the context of physical activity behavior across the lifespan. The series of studies uses a “zooming” perspective that progresses from research on behavioral correlates to settings and contexts for physical activity and ultimately to public health surveillance. The overall goal was to generate evidence that could be used to better inform youth public health guidelines for physical activity. The thesis is. 25.
(26) presented in manuscript format, and each of the seven manuscripts addresses a specific component of the physical activity assessment and contexts. Manuscript 1- focuses on the youth physical activity promotion model proposed by Welk (1999). Establish a comparison of the model correlates between two different cultural contexts, such as the United States of America and Portugal. If the YPAP model adequately explains youth physical activity behavior, in two different cultures and with two different sets of instruments, it would suggest that the model has broad utility for youth activity promotion. Submitted to Journal of Physical Activity and Health. Manuscript 2 – examines the variation of physical activity amount in different age groups and genders (individual correlates). The specific aims of this study were (1) to report data regarding the different physical activity intensities and sedentary behavior from a lifespan perspective and (2) to analyze the compliance of the physical activity guidelines. Submitted (revised version) to Journal of Physical Activity and Health. Manuscript 3 – because the cornerstone instrument to measure PA in this research is the accelerometer, and there have been no studies reporting on the reliability of the GT1M accelerometer for assessing activity counts and steps. Likewise, little information is available that describes the threshold detection levels of the Actigraph. Therefore, the purpose of this study was 1) to determine the intra-instrument and inter-instrument reliability of the GT1M, and 2) to determine its acceleration threshold detection levels using a controlled mechanical setup. Submitted to Measurement in Physical Education & Exercise Science (in press). Manuscript 4 - explores whether physical activity patterns changes in two different seasons. Therefore, the aims of this pilot study were (1) to determine the regular physical activity and sedentary patterns in children aged 10-13 years old across two seasons and (2) to analyze the potential seasonal differences by identifying the contexts where those differences occur. Submitted to Journal of Sports Science Medicine. Manuscript 5 - Research is needed to examine the physical activity consistency across different populations and cultures. Therefore, the aims of. 26.
(27) this study were: 1) to describe the physical pattern of high school adolescents attending public schools in Portugal and in Spain; 2) to compare the differences between the two countries in the PA pattern. Submitted (revised version) to Archives of Exercise in Health and Disease. Manuscript 6 - If students chose to be active during 5 “free-choice” periods in the school schedule, such as commute to school, morning recess, lunch, afternoon recess, and after-school, they would get 25 more opportunities be active per week. To better utilize these opportunities, it is important to better understand the contribution of different school settings to activity levels in youth. The aim of this study is to determine how gender, age, body mass index, and school influence the amount of PA during different “free-choice” periods during the school schedule of Portuguese students attending two high schools. Submitted to European Physical Education Review. Manuscript 7 – School sports are present in the majority of high schools, although the club sports have a stronger tradition for after school programming. This study aims to address the contributions of extracurricular sports (ECsports), performed in both contexts to activity profiles of Portuguese adolescents. A secondary goal is to examine possible variability in these effects by age and gender. Submitted to European Physical Education Review.. 27.
(28) Chapter 2.
(29)
(30) Chapter 2 2.1 Physical Activity Contexts Manuscript: Psychosocial correlates of Physical Activity in two cultural contexts: Different pathways?. 2.1.1 Abstract Background: If the Youth Physical Activity Promotion (YPAP) model adequately explains youth PA behavior, in two different cultures and with two different sets of instruments, it would suggest that the model has broad utility for youth activity promotion. Methods: Two samples from different countries were used (study 1 – US and study 2 – PT). Study 1 had a sample of 159 students (83 girls) with a mean age of 11.52 ± 1.40 years, and study 2 comprised 203 students (125 girls), with a mean age of aged 14.99 ± 1.55 years. PA was assessed by accelerometry. The YPAP model provided the theoretical framework for the correlates and the causal pathways. The model was analyzed through structural equation modeling using AMOS (version 17.0). Results: In study 1, social-support had a direct association with the MVPA amount (β=-.20, p<.05) and enjoyment (β=-.51, p<.05). Self-efficacy had a direct association with enjoyment (β=-.43, p<.05). In study 2, Social-support had a direct association with the MVPA amount (β=.41, p<.05), and with selfefficacy (β=.69, p<.05). Conclusions: Constructs relationships were relevant in both countries, with different pathways. Younger youth might receive peer support through enjoyment, and older youth received influence of peer support through skill and self-worth processes.. 30.
(31) 2.1.1 Introduction Influences on young peoples' physical activity are multi-factorial. A variety of psychological, social and physical environmental correlates of physical activity for young people have been identified. Social-cognitive models that emphasize intrapersonal and micro-environmental influences hold great promise for better understanding and promoting physical activity participation (Ommundsen, Klasson-Heggebo, & Anderssen, 2006). Youth physical activity (from here on abbreviated as PA) is best described as a profile rather than a single entity, and such profiles are characterized as a complex matrix of behaviors that take place in a range of social contexts, each with its own set of physiological, psychological and sociological determinants and outcomes. To develop a better understanding of “what works”, researchers have focused on building an evidence base for potential mediators of behavior change. The wide range of correlates supports the application of ecological models of behavior to improve understanding of the influences on youth physical activity (Sallis, Taylor, Dowda, Freedson, & Pate, 2002). Social ecologic models highlight the importance of targeting different settings and environments that influence individual behavior, but a testable mediating variable framework is needed to facilitate the development and evaluation of effective interventions. A model that may prove useful in this regard is the Youth Physical Activity Promotion (YPAP) Model (Welk, 1999). This model integrates a diverse array of individual and environmental variables into a testable mediating framework. Typical psychosocial correlates (e.g. attitudes, beliefs, self-perceptions) are viewed as “predisposing” factors , social and interpersonal variables (e.g. support or non-support of family, teachers, and friends) are viewed as “reinforcing” factors and individual variables (e.g. skill, fitness) and environmental variables (e.g. access and opportunity) are viewed as “enabling” factors. Longitudinal studies suggest that declines in physical activity during the period from late middle school through late high school are inversely associated with self-efficacy for overcoming barriers to physical activity and also with perceived support from family (Dowda, Dishman, Pfeiffer, & Pate, 2007) and friends (Duncan, Duncan, Strycker, & Chaumeton, 2007). It is widely accepted 31.
(32) that perceived competence and enjoyment influence young peoples' physical activity, and social support from family and peers have also been identified as positive correlates (Sallis, Prochaska, & Taylor, 2000b). However, we know far less about the extent to which age and gender interact with psychological, social and physical environmental factors in their influence on physical activity. Elements of the model and associated measures have been tested in studies of youth physical activity behavior with significant effects shown on physical activity (Welk, Wood, & Morss, 2003), but the overall fit of the model has not been extensively evaluated. Preliminary research with structural equation modeling was conducted on a sample of 673, 3rd -6th grade youth (340 boys and 333 girls), to examine the utility of the model. The results supported the structural links proposed, the model provided a good fit to the data [CFI=.97; NFI =.94, NNFI =.96 and chisquare= 143 (df=80)]. Overall, the model predicted 43% of the variance in PA (Welk, Babke, & Brustad, 1998). To more fully evaluate the utility of the model it is important to determine if elements of the model hold for different cultural contexts. Welk (Welk, 1999) contend that while elements of these models may apply in youth and adults, it‟s premature to assume that they are influenced in the same way. Dishman and colleagues (Dishman, Saunders, Motl, Dowda, & Pate, 2008) also recommended that research on social cognitive influences of physical activity include efficacy beliefs specific to overcoming social barriers to physical activity and compare the influence of the cultural environment with influences of the physical and social environments in racially or ethnically diverse samples of adolescents. The present study advances research in this area by evaluating the utility of YPAP constructs for explaining physical activity behavior in two different samples – one from the United States and one from Portugal. This research does not aim to accept or reject the YPAP model; rather, it is an extension of the preliminary development of the model. If the YPAP model adequately explains youth physical activity behavior, in two different cultures and with two different sets of instruments, it would suggest that the model has broad utility for youth activity promotion. The model may prove useful as an evaluation framework in future studies and possibly to examine causal pathways within a multi-faceted social ecological intervention. We tested our theoretical model 32.
(33) using maximum likelihood to test the model hypotheses.. 2.1.3 Methods Theoretical Model and Selection of Psychosocial Correlates The YPAP model (Welk, 1999) provided the theoretical framework for the selection of correlates and the proposed causal pathways. Consistent with social ecological theory, the YPAP is population and behavior specific and incorporates a broad perspective on the factors that influence physical activity behavior in youth. The original model includes Reinforcing, Predisposing, and Enabling Factors. The Reinforcing factors are theorized to influence activity directly and indirectly through the Predisposing Factors (Welk, 1999). The Enabling factors capture environmental variables (e.g. access) as well as physical characteristics (e.g. skill, fitness) that may enable youth to act on their predispositions – and be physically active. For the present study, we focused only on the Reinforcing and Predisposing Factors since these domains capture the primary psychosocial areas of interest in the study. Reinforcing factors in the YPAP model include variables that reinforce (either directly or indirectly) youth PA behavior. Reinforcement can come from parents, peers, coaches or other significant individuals; however, for the present study only peer influences was examined. The extant literature on child development suggests that peer influence becomes increasingly important as children move through the development transition from childhood into adolescence (Weiss, Smith, & Theeboom, 1996). Because the samples included pre- or early adolescents we focused the model on peer influences. The decision to focus on peer influences is supported by the detailed literature review conducted by Sallis et al. (Sallis, Taylor, et al., 2002). Peer support was one of the two significant correlates of objectively monitored activity in multiple subgroups. A similar and more recent review by Van Der Horst et al. (Van Der Horst, et al., 2007) found positive associations between physical activity and friend support. Moreover, friendships may increase youth's motivation to engage in physical activity and promote greater physical activity in nonoverweight and overweight youth (Salvy, et al., 2009). Predisposing factors in the YPAP model include variables that collectively increase the likelihood that a person will be physical active on a 33.
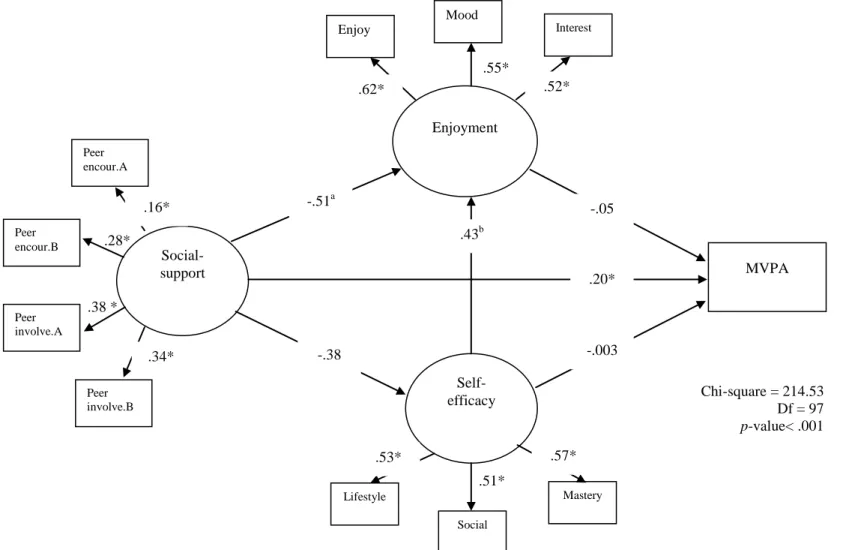
(34) regular basis (Welk, 1999). This component has been viewed from a socialcognitive theory perspective (Bandura, 2004) and includes components that reflect both efficacy expectations (Am I Able?) and outcome expectations (Is it Worth it?). Youth need to be able to answer both questions affirmatively to be predisposed to be active. Measures of self-efficacy were used to capture the Am I Able component since there is broad consensus regarding the importance of this self-evaluative construct on youth behavior (Welk, 1999). The other component (Is it worth it?) include both cognitive (attitudes, perceived benefits, and beliefs about PA) and affective (enjoyment and interest of PA) variables. In the present study, we utilized measures of enjoyment to capture overall interest in PA. As described above, the YPAP model provides a flexible, socialecological framework for evaluating physical activity correlates. A simplified version of YPAP Model core illustrating the association and direction of reinforcing and predisposing factors on physical activity is provided in Figure 1. The focus of the present study is on the relative utility of this model for explaining physical activity behavior in adolescents from two different cultures.. 34.
(35) Is it worth it?. Enjoyment Predisposing Reinforcing. Socialsupport. MVPA. Am I able?. Selfefficacy. Figure 5 – Conceptual diagram of the YPAPM core.. 35.
(36) Data Sets and Descriptions of Measures Study 1 (USA): Data for Study 1 were obtained from a previous study examining the validity of the Youth Media Campaign Longitudinal Survey (Welk, et al., 2007). The youth media campaign longitudinal survey (YMCLS) was used by the CDC to evaluate the VERB social marketing campaign and includes a detailed battery of physical activity questions and psychosocial correlates that have been used in previous research. The independent evaluation of the YMCLS survey (Welk, et al., 2007) involved a sample of 190 students that wore an accelerometer (MTI Actigraph monitor) for the week prior to completing the YMCLS survey. For the present study, we used a subsample of 159 students (83 girls and 76 boys) that had complete data on the survey and the accelerometer (mean age of sample was 11.52 ± 1.40 years). Stature was measured in the study using a wall stadiometer. Body mass was measured on a balance beam scale with the participant attired in gym shorts and T-shirt without shoes. BMI was calculated from stature and body mass (kg.m2). The YMCLS survey questions were designed to evaluate the effectiveness of the VERB national media campaign to promote PA among children.44 The battery included established psychosocial correlate measures (based on social cognitive theory constructs) but modifications were used to fit the specific purpose of the campaign. Social Support – Social influences were assessed using 6 items that collectively captured child perceptions of peer support and social norms for being active. The items were scored on a four-point scale (really agree to really disagree). The reported internal consistency of the items was 0.70. Am I Able? The Am I Able construct was assessed with four items that captured youth‟s perceptions about confidence in overcoming barriers to being physically active (aka self-efficacy). The barriers included being busy, being tired and challenges due to bad weather. An additional item assessed overall confidence in being physically active. The reported internal consistency was 0.66 (alpha reliability). Is it Worth it? – The Is it Worth it construct was assessed with five items that captured children‟s perceptions outcome expectations for PA. The items assessed whether children felt that PA would be boring, fun, help them make 36.
(37) new friends, help them play with friends or help them feel good about themselves. The items were scored using a 4 point likert scale (really agree, sort-of agree, sort-of disagree, and really disagree) and negatively worded items were recoded.. Study 2 (PT): Data for Study 2 were obtained from an ongoing evaluation of physical activity in school aged youth population in the Porto metropolitan area (Aires, et al., 2008). For the present study, the sample comprised 203 students (125 girls, 78 boys), with a mean age of aged 14.99 ± 1.55 years. Standard anthropometric techniques were used to collect data on height, weight and BMI. Height was measured to the nearest mm in bare or stocking feet with the youth standing upright against a Holtain portable stadiometer. Weight was measured to the nearest Kg, lightly dressed (underwear and tee-shirt) using a portable digital beam scale (Tanita Inner Scan BC532). The BMI was estimated from the ratio weight/height2 (Kg/m2). Details of the psychosocial correlates used in the evaluation of the YPAP model are summarized below: Social Support - The social-support scale was adapted from Ward et al. (Ward, Saunders, & Pate, 2007) and originally developed by Sallis et al. (Sallis, Taylor, et al., 2002), this study included assessments of modeling, verbal encouragement, and participation with the subject from family members and peers. This is a more complete examination of potential social influences than has been reported previously, although in this study we only considered the peer influence. The psychometric properties of survey variables, as indicated by internal consistency reliabilities and test-retest were strong: peer influences (Cronbach alpha= .74; ICC= .70). Am I Able?: The Am I Able construct was assessed using an adapted Self-efficacy scale that was originally developed by Motl et al. (Motl, et al., 2000) and later modified by Ward et al. (Ward, et al., 2007). The scale has eight items rated on a 5-point Likert-type scale ranging from 1 (Disagree a lot) to 5 (Agree a lot), this scale was invariant across one year (Motl, et al., 2000). Is it Worth ir? – The Is it Worth it construct was assessed using a modified version of the enjoyment scale adapted by Ward et al. (Ward, et al., 37.
(38) 2007). The original scale called Physical Activity Enjoyment Scale (PACES) was developed to measure physical activity enjoyment using college-aged students (Kendzierski & DeCarlo, 1991). Motl et al. (Motl, et al., 2001), tested the construct validity of the original PACES scale scores by using structural equation modeling of hypothesized relationships between enjoyment and factors influencing enjoyment of physical education, physical activity, and sport involvement. This study conclude that evidence of factorial validity and convergent evidence for construct validity indicate that the PACES is a valid measure of physical activity enjoyment among adolescent girls, suitable for use as a mediator variable in interventions designed to increase physical activity.. Assessment of physical activity The MTI Actigraph activity monitor was used to obtain objective data on youth‟s physical activity behavior on both countries. The MTI is the most widely used accelerometry-based activity monitor. It was selected for use in the present study based on its established reliability and validity and because past work has established acceptable calibration equations to facilitate usage with youth. The accelerometer was worn over 7 consecutive days in order to obtain a reliable picture of the habitual PA (Trost, McIver, & Pate, 2005), the adolescents wore the accelerometer in an elastic waistband on the right hip during waking time, except while bathing and during other aquatic activities. A data sheet was given to students who were instructed to record the time when the monitor was attached in the morning and detached in the evening. The accelerometer was setup to use an epoch of 1 minute, similar to other studies (Andersen & van Mechelen, 2005; Welk, Schaben, & Morrow, 2004). A specialized software (Kinesoft) was used for data reduction and further analyses, and the daily time spent in moderate and vigorous physical activity (>3MET) was calculated by summing the minutes of moderate, vigorous, and very vigorous PA for each day. For the MVPA (moderate to vigorous physical activity) determination, the age-specific count ranges corresponding to the intensity levels developed by Freedson (Freedson, Pober, & Janz, 2005) were adopted.. 38.
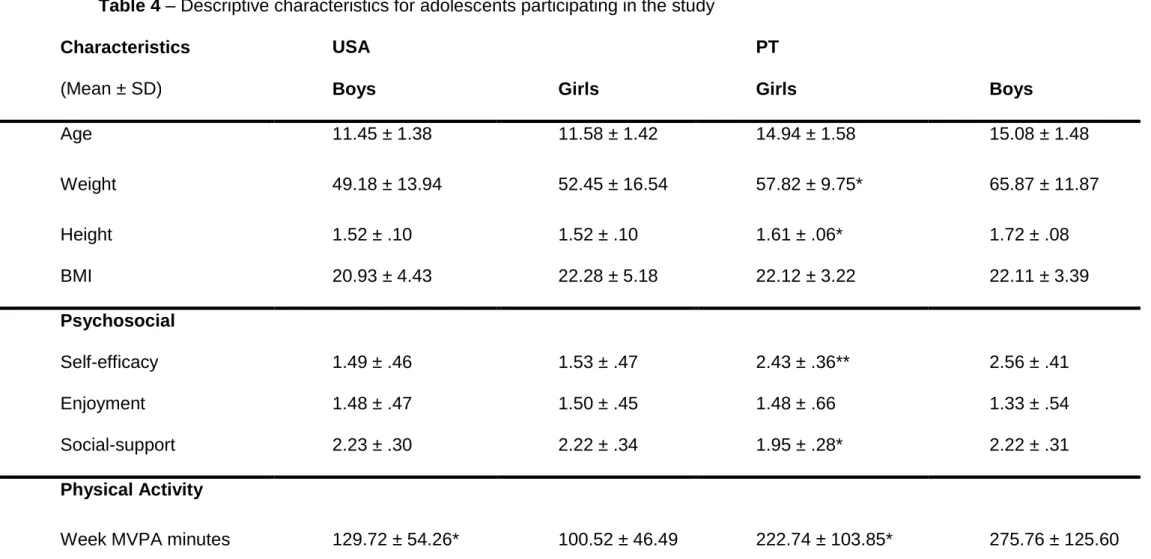
(39) Statistical analyses Descriptive statistics were used to describe participant‟s characteristics and the PA data. Independent samples t-test assessed the gender differences within each country. The Psychosocial scales reliability was given by Crombach‟s alpha. The fit indices of the YPAP model were analyzed through structural equation modeling (SEM) using AMOS (version 17.0). The measurement model specified the relationships between the observed indicators and the latent variables and the structural equation model specified the relationships amongst the latent variables. Maximum likelihood estimation procedures were used for calculating item loadings on the specified latent variables. Psychometric properties of the variables were evaluated by examining the internal reliability of the component scales and by subscale intercorrelations. Items were constrained a priori to load on their previously established constructs. Given that the traditional chi-square test is sensitive to sample size (Marsh, Balla, & McDonald, 1988), results were further evaluated with goodness of fit indices (CFI). and the. root mean square error of. approximation (RMSEA).. 2.1.4 Results Sample characteristics from both countries are presented in Table 1. In the US sample, no gender differences were found in the anthropometric variables or in the psychosocial correlates. In the PT sample, significant gender differences (p<.001) were found in the weight and height measures.. 39.
(40) Table 4 – Descriptive characteristics for adolescents participating in the study Characteristics. USA. PT. (Mean ± SD). Boys. Girls. Girls. Boys. Age. 11.45 ± 1.38. 11.58 ± 1.42. 14.94 ± 1.58. 15.08 ± 1.48. Weight. 49.18 ± 13.94. 52.45 ± 16.54. 57.82 ± 9.75*. 65.87 ± 11.87. Height. 1.52 ± .10. 1.52 ± .10. 1.61 ± .06*. 1.72 ± .08. BMI. 20.93 ± 4.43. 22.28 ± 5.18. 22.12 ± 3.22. 22.11 ± 3.39. Self-efficacy. 1.49 ± .46. 1.53 ± .47. 2.43 ± .36**. 2.56 ± .41. Enjoyment. 1.48 ± .47. 1.50 ± .45. 1.48 ± .66. 1.33 ± .54. Social-support. 2.23 ± .30. 2.22 ± .34. 1.95 ± .28*. 2.22 ± .31. 129.72 ± 54.26*. 100.52 ± 46.49. 222.74 ± 103.85*. 275.76 ± 125.60. Psychosocial. Physical Activity Week MVPA minutes. * Significant difference between genders: p<.001; ** p=.039. 40.
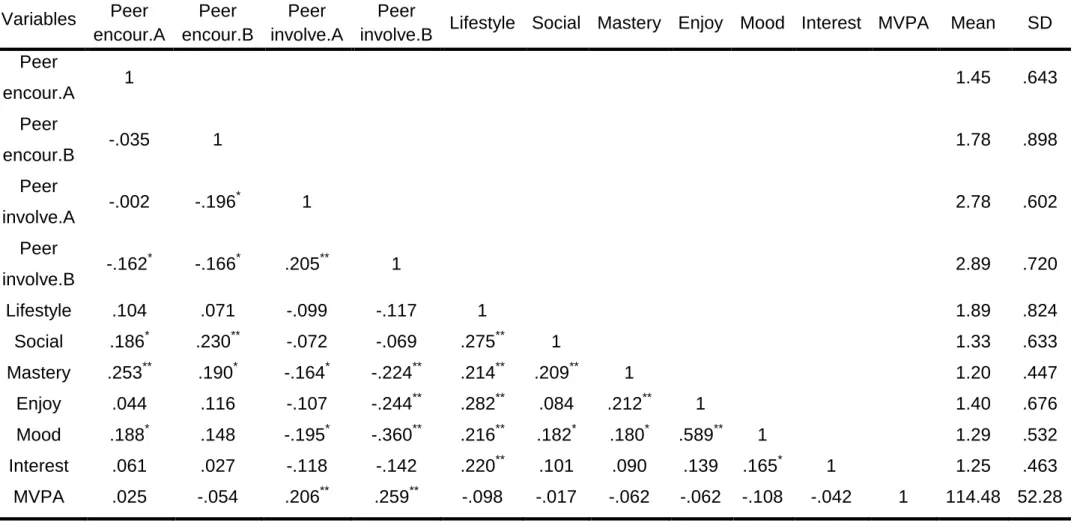
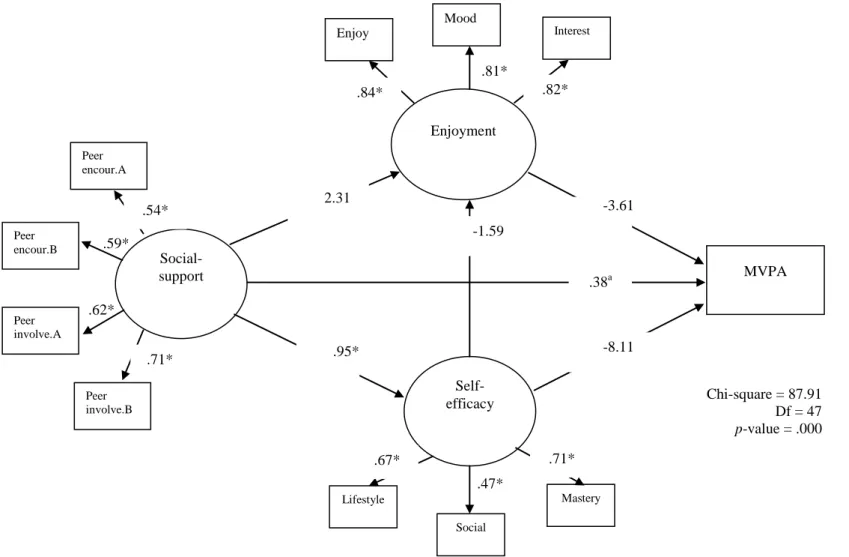
(41) Gender differences were also found in two psychosocial variables, selfefficacy (p<.05) and social-support (p<.001). In both countries, significant gender differences (p<.001) were found in the recorded amount of moderate to vigorous physical activity. Study 1 (USA): the correlation matrix means and standard deviations for the US study variables are presented in Table 2. Social-support indicators, such as peer encouragement, were significantly correlated with self-efficacy indicators, such as social, mastery, and with one enjoyment indicator (mood). Peer involvement was also significantly correlated with the mastery indicator in the self-efficacy construct, and with the enjoy and mood items in the enjoyment construct. Of all the indicators, only peer involvement was significantly correlated with the MVPA amount. Figure 2 shows the latent-variable structural equations model used to examine the proposed theoretical model (Figure 1) in the USA. Four different significant paths were observed. Social-support had a direct association with the MVPA amount (β=-.20, p<.05). Social support also directly influenced enjoyment (β=-.51, p<.05). A significant association was observed where social support directly predicts self-efficacy (β=-.36, p<.05).. Finally, self-efficacy had. a direct association with enjoyment (β=-.43, p<.05). The overall fit of the model was good, as indicated by chi-square statistics of 214.53 with 97 degrees of freedom. The CFI was .99, which exceeds the recommended .95 for good fit, and although the chi-square was significant, the RMSEA was .03, well within the recommended range.. 41.
(42) Table 5 - Bivariate Pearson Product-Moment Correlations (below the diagonal), Means and Standard Deviations of Physical Activity and Psychosocial Correlates in the USA. Variables Peer encour.A Peer. Peer Peer Peer Peer Lifestyle Social Mastery Enjoy Mood Interest MVPA encour.A encour.B involve.A involve.B 1. -.035. 1. -.002. -.196*. 1. -.162*. -.166*. .205**. 1. Lifestyle. .104. .071. -.099. -.117. 1. Social. .186*. .230**. -.072. -.069. .275**. 1. Mastery. .253**. .190*. -.164*. -.224**. .214**. .209**. 1. Enjoy. .044. .116. -.107. -.244**. .282**. .084. .212**. 1. Mood. .188*. .148. -.195*. -.360**. .216**. .182*. .180*. .589**. encour.B Peer involve.A Peer involve.B. Interest MVPA. .061 .025. .027. -.118. -.142. -.054. **. **. .206. .259. 1. **. .101. .090. .139. .165. -.098. -.017. -.062. -.062. -.108. .220. * Significant at the 0.05 level; ** Significant at the 0.01 level. 42. *. 1 -.042. 1. Mean. SD. 1.45. .643. 1.78. .898. 2.78. .602. 2.89. .720. 1.89. .824. 1.33. .633. 1.20. .447. 1.40. .676. 1.29. .532. 1.25. .463. 114.48 52.28.
(43) Mood Interest. Enjoy. .55* .52*. .62* Enjoyment Peer encour.A. .16* Peer encour.B. Peer involve.A. -.51a. -.05 .43. .28*. b. Socialsupport. .20*. MVPA. .38 * .34*. -.003. -.38 Selfefficacy. Peer involve.B. Chi-square = 214.53 Df = 97 p-value< .001 .57*. .53* .51*. Mastery. Lifestyle Social. Figure 6 – Conceptual diagram of the YPAPM core applied in the USA sample (standardize regression weights; * p<.001, p= .029,. b. a. p= .008; CFI= .986; RMSEA= .031). The standardized coefficients for the overall test of the model when statistically. significant are accompanied by an asterisk or letter.. 43.
(44) Study 2 (PT): the correlation matrix means and standard deviations for the PT study variables are presented in Table 3. All the social-support indicators were significantly correlated with all the self-efficacy indicators. Peer encouragement was also significantly correlated with enjoy and interest items, in the enjoyment construct. Peer involvement indicators were significantly correlated with all the enjoyment indicators. Of the all the indicators, only peer involvement was significantly correlated with the MVPA amount. Figure 3 shows the latent-variable structural equations model used to examine the proposed theoretical model in PT. The standardized coefficients for the overall test of the model when statistically significant are accompanied by an asterisk or letter. In the PT sample a different pattern of significant paths emerged. Socialsupport had a direct association with the MVPA amount (β=.41, p<.05) but the path from social-support to enjoyment was not significant as in the US sample (β=-.23, p>.05). Instead, the path from social-support to self-efficacy was highly significant (β=.69, p<.05) and in the reverse direction. The overall fit of the model was very good, as indicated by the chi-square statistic of 70.67 with 47 degrees of freedom. The CFI was .95, which match the recommended .95 for good fit, and although the qui-square was significant (p= .014), the RMSEA was .05.. 44.
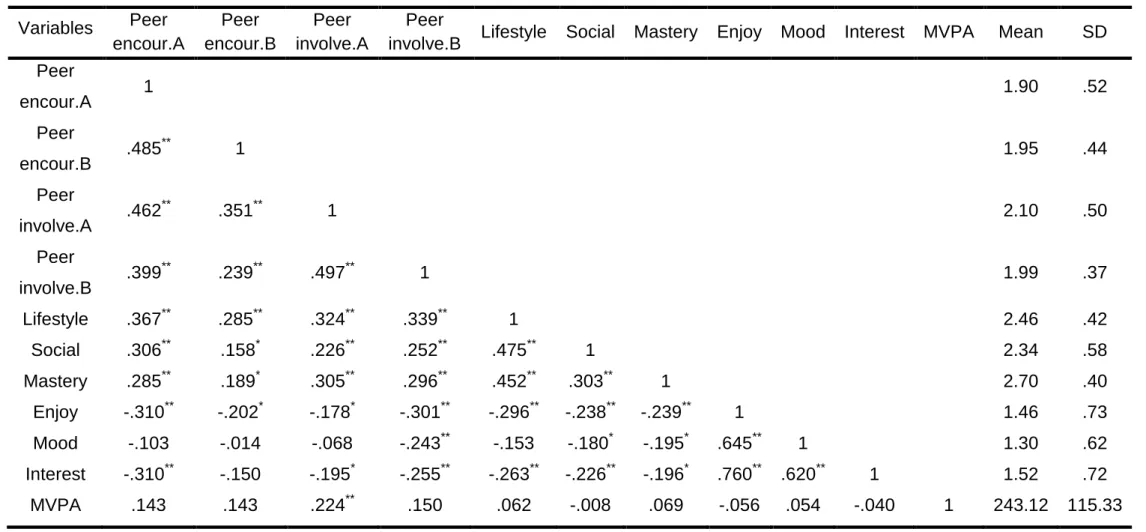
(45) Table 6 - Bivariate Pearson Product-Moment Correlations (below the diagonal), Means and Standard Deviations of Physical Activity and Psychosocial Correlates in the Portugal. Variables Peer encour.A Peer. Peer encour.A. Peer encour.B. Peer involve.A. Peer involve.B. Lifestyle. Social. Mastery. Enjoy. 1. .462**. .351**. 1. .399**. .239**. .497**. 1. Lifestyle. .367**. .285**. .324**. .339**. 1. Social. .306**. .158*. .226**. .252**. .475**. 1. Mastery. .285**. .189*. .305**. .296**. .452**. .303**. 1. Enjoy. -.310**. -.202*. -.178*. -.301**. -.296**. -.238**. -.239**. 1. Mood. -.103. -.014. -.068. -.243**. -.153. -.180*. -.195*. .645**. -.150. *. -.255. **. **. *. **. **. .150. Peer involve.A Peer involve.B. Interest MVPA. Interest. MVPA. 1 .485**. encour.B. Mood. -.310. **. .143. .143. -.195 .224. -.263. **. -.226. .062. -.008. * Significant at the 0.05 level; ** Significant at the 0.01 level. 45. -.196 .069. .760. -.056. 1 .620. **. .054. 1 -.040. 1. Mean. SD. 1.90. .52. 1.95. .44. 2.10. .50. 1.99. .37. 2.46. .42. 2.34. .58. 2.70. .40. 1.46. .73. 1.30. .62. 1.52. .72. 243.12. 115.33.
(46) Mood Interest. Enjoy. .81* .82*. .84* Enjoyment Peer encour.A. .54* Peer encour.B. Peer involve.A. .192.31. -3.61 -.01 .29-1.59. .59* Socialsupport. .38a. MVPA. .62* .71*. -8.11 -.06. .95* .68* Selfefficacy. Peer involve.B. Chi-square = 87.91 Df = 47 p-value = .000 .71*. .67* .47*. Mastery. Lifestyle Social. Figure 7 – Conceptual diagram of the YPAPM core applied in the PT sample (standardize regression weights; * p<.001, a p=.018; CFI= .92; RMSEA= .06). The standardized coefficients for the overall test of the model when statistically significant are accompanied by an asterisk or letter.. 46.
(47) 2.1.5 Discussion This study provides an evaluation of the mediating variable framework proposed in the YPAP model to account for differences in physical activity in two different cultural contexts. The study provides new information about the utility of the YPAP Model (Welk, 1999) and extends preliminary validation work on different countries. Previous research has provided evidence supporting the utility of the YPAP model but this is the first study to investigate model fit using two different measurement batteries and in two different cultures. Some modifications to the original model were necessary, but this is justifiable since the YPAP model was designed specifically for this purpose. Rather than specifying measures or constructs, the YPAP uses broad domains of influence to facilitate evaluation of youth activity behaviors (predisposing, reinforcing and enabling) (Welk, 1999). Although the two studies used different measurement instruments, the psychosocial correlates selected for inclusion captured the same underlying domains and constructs within the YPAP model. This study supports the important contributions peer influences on children‟s predisposition to physical activity. The predisposing factors are viewed as the central component in the model since they reflect the child‟s drive or interest (predisposition) to be physically activity. The predisposing factors are the youth‟s perception of “Am I able?” and “Is it worth it?” to physical activity. Social cognitive variables (i.e., beliefs that are formed by social learning and reinforcement history) are recognized influences on self-initiated change in health behaviors such as physical activity (Bandura, 2004). They may be especially important during early adolescence,. when physical activity. increasingly becomes a leisure choice (Dishman, et al., 2008). In concordance with our results, previous work also showed peer influence (a Reinforcing variable) to be an important factor in youth physical activity. Efficacy to overcome barriers, physically active friends, and. social. support from friends all played roles in reducing the decline in physical activity (Duncan, et al., 2007). Sallis et al. (Sallis, Taylor, et al., 2002) in a study in young people from grade 1 through 12, also with accelerometers, found that the most consistent correlates of physical activity was peer support. Salvy et al. (Salvy, et al., 2009) found that friendships may increase youth‟s motivation to engage in physical activity and promote greater physical activity in non47.
(48) overweight and overweight youth. Moreover, youth who report greater presence of peers in their lives also report engaging in greater physical activity (Beets, Vogel, Forlaw, Pitetti, & Cardinal, 2006; De Bourdeaudhuij, et al., 2005; Duncan, Duncan, & Strycker, 2005; Salvy, et al., 2008). Self-efficacy is one of the most studied correlates of physical activity (Sallis, et al., 2000b). Dishman et al. (Dishman, et al., 2008) in a study in high school girls stated that their self-efficacy about overcoming barriers to physical activity is formed by the eighth grade. Therefore, physical activity interventions designed to enhance self-efficacy might be especially needed during preadolescence. Since, low self-efficacy for overcoming barriers to physical activity appears to limit girl‟s attempts to be more active or their persistence regardless of changing perceptions of social support. Another study by Dishman et al. (Dishman, et al., 2004) demonstrated that the intervention had a direct effect on self-efficacy which had a subsequent direct effect on physical activity. This was first and only experimental evidence showing that increased selfefficacy directly results in increased physical activity among adolescent girls. The observed correlations among enjoyment, physical activity, and sport involvement lend support to the importance of the enjoyment (i.e., intrinsic motivation) component of expectancy-value theories as a possible target for interventions (Motl, et al., 2001). Similar to the self-efficacy study, the LEAP intervention study, Dishman et al. (Dishman, et al., 2005) showed that increases in enjoyment partially mediated the positive effect of the intervention. Another study (Barr-Anderson, et al., 2007), with six grade girls, concluded that Interventions that increase self-efficacy and enjoyment of PE could result in greater participation in structured PA and higher overall PA levels among adolescent girls. Paxton et al. (Paxton, Estabrooks, & Dzewaltowski, 2004) had shown a similar mediating effect of attraction (Is it worth it?) in the relationship between perceived competence (Am I able?) and physical activity, but that model did not include the link of peer influence. The different observed paths within the both countries are an interesting finding. This difference might be attributed to the difference in the age of the two samples, with the US sample being younger than the PT sample. This might point to the fact that younger youth might receive peer support through enjoyment, and older youth received the influence of peer support through skill 48.
Imagem
+7
Documentos relacionados
Consideramos que os atores da sociedade civil, como possíveis arquitetos de seus futuros na cidade, desenvolvem e podem compartilhar diferentes repertórios, sejam eles relacionados
Alguns ensaios desse tipo de modelos têm sido tentados, tendo conduzido lentamente à compreensão das alterações mentais (ou psicológicas) experienciadas pelos doentes
Para tanto foi realizada uma pesquisa descritiva, utilizando-se da pesquisa documental, na Secretaria Nacional de Esporte de Alto Rendimento do Ministério do Esporte
Os controlos à importação de géneros alimentícios de origem não animal abrangem vários aspetos da legislação em matéria de géneros alimentícios, nomeadamente
Ao Dr Oliver Duenisch pelos contatos feitos e orientação de língua estrangeira Ao Dr Agenor Maccari pela ajuda na viabilização da área do experimento de campo Ao Dr Rudi Arno
Neste trabalho o objetivo central foi a ampliação e adequação do procedimento e programa computacional baseado no programa comercial MSC.PATRAN, para a geração automática de modelos
Ousasse apontar algumas hipóteses para a solução desse problema público a partir do exposto dos autores usados como base para fundamentação teórica, da análise dos dados
O presente artigo apresenta como o jogo de mobilização social e transformação comunitária criado pelo Instituto Elos, jogo oasis, contribuiu para as condições de
