Integrated Master’s in Environmental Engineering
2016/2017
AIR POLLUTION: THE PORTUGUESE SCENARIO AND ITS PUBLIC HEALTH
IMPACTS
Pedro Nuno Leal Ribeiro Torres
Dissertation for the Degree of:
MASTER IN ENVIRONMENTAL ENGINEERING
___________________________________________________________
Supervisor FEUP: Maria do Carmo da Silva Pereira, PhD
Supervisor ISPUP: Ana Sofia Estevão Mendes, PhD
The work presented in this thesis was performed at the Institute of Public Health of the University of Porto (ISPUP), Portugal, and the Environmental Health Department of the National Institute of Health, Porto, Portugal.
This work was supported by FEDER through the NO2 Operational Program Competitiveness and Internationalization and national funding from the Foundation for Science and Technology – FCT (Portuguese Ministry of Science, Technology and Higher Education) (POCI-01-0145-FEDER-016752), under the project “FUTURAR - Air quality in Portugal in 2030: a policy support” (PTDC/AAG-MAA/2569/2014).
“Science seeks the truth. And it does not discriminate. For better or worse it finds things out. Science is humble. It knows what it knows and it knows what it doesn’t know. It bases its conclusions and beliefs on hard evidence -- evidence that is constantly updated and upgraded. It doesn’t get offended when new facts come along. It embraces the body of knowledge. It doesn’t hold on to medieval practices because they are tradition.” - Ricky Gervais
i
A
CKNOWLEDGEMENTS
I would like to express my sincere gratitude for the motivation and guidance of the supervisor of the Institute of Public Health of the University of Porto (ISPUP) and the Department of Environmental Health of the National Institute of Health (INSA), Ana Sofia Mendes, for all comments, observations and guidance during the whole process of this dissertation, as well as for the patience and availability, which not only enabled the execution of my work, but also helped my development as an engineer and even as a person.
I would also like to thank my supervisor at the Faculty of Engeny of the University of Porto, Professor Maria do Carmo Pereira (LEPABE), for providing the opportunity to work on this dissertation.
To all the staff of INSA and ISPUP, a huge word of gratitude, for welcoming me in their midst and for receiving me so well, for providing all the necessary conditions for this work. The presence of all these people not only helped me to feel at home, but also helped to improve my work and my professional performance throughout the process.
To the entities involved in this work, (FEUP, LEPABE, INSA and ISPUP), for having ensured all the necessary conditions for the elaboration of this work.
For Dr. Joana Ferreira, from the Center for Environmental and Marine Studies of the University of Aveiro, for advice and help in the development of the theme.
For my family and friends, thank you very much for the help given in every possible way, during all this work. Only with the support, dedication and patience received by them, was it possible to deal with all the problems faced with the work and to finish the dissertation.
A special thanks to Laura Correia for her unconditional and constant support during these months, which undoubtedly was an immense help, dedicating much of her time, patience and vacations, to support me and help me through the most difficult moments in this work .
ii
A
BSTRACT
To mitigate the effects of air pollution and reduce emissions and consequent concentrations of atmospheric pollutants, several tools have been developed to monitor the atmospheric pollution emissions and concentrations. Several monitoring stations are distributed around the world to provide a global, national and regional analysis of the existing air quality status. The Portuguese air quality index specifies the state of pollution in each territorial area and future projections of pollution.
This work comprises a literature review, critical analysis and Case Study of air quality indicators and its impacts in the field of public health. The main outcome of this study was to analyze the health impacts regarding the air quality indicators and pollutant emission scenario for Portugal, between the chosen years of 2009 and 2015.
This study was conducted between February and September 2017, focusing on the literature from 1995 to 2017, using the Web of Science, PubMed and ScienceDirect databases. The principal method of the Case Study was an emissions analysis, air quality pollutant concentrations analysis and health effects expressed by indicators and to discuss their possible relationships. Nevertheless, a direct analysis of the relations between these three inputs (emissions, air quality pollutant concentrations and health effects) was not a direct one, since many chemical and physical processes are involved, which play a central role in the development of pollutants and their geographical distribution.
The emissions analysis pointed out the following: (i) regions of Alentejo and Algarve had reduced values in different pollutants in comparison with the other regions, with some decreases of emissions in those regions; (ii) the metropolitan area of Lisbon presented the most problematic region in relation to the emissions of all the pollutants under study, with few improvements and high emissions in relation to all the other regions; and (iii) only in the country central region, there was an increase in carbon dioxide emissions.
The analysis of air quality showed that: (iv) regarding to ozone, concentration decreased throughout the country; (v) in the case of nitrogen dioxide and particulate matter, most of the northern half of the country shows an increase in concentrations, contrary to the situation observed in the southern half that presents improvements; (vi) the analysis of sulfur dioxide and fine particulate matter presented concentration increases in the regions of Alentejo and the metropolitan area of Lisbon, while other regions show improvements with the reduction of pollutants concentrations in the atmosphere.
In terms of public health, the studied health indicators presented different trends, depending on the cause of mortality and the region in question. Alentejo and Algarve regions showed decreasing trends, with those registering fewer causes of mortality in other regions. The regions of the North, Center and metropolitan area of Lisbon had high mortality values, compared to the other regions.
Possible actions to mitigate emissions of air pollutants should focus on the metropolitan area of Lisbon, North and Central parts of the country, particularly the districts of Lisbon, Setúbal and Porto.
iv
R
ESUMO
A necessidade de mitigação dos efeitos da poluição e redução das emissões e das consequentes concentrações de poluentes atmosféricos despoletou o desenvolvimento de várias ferramentas de monitorização dos valores de poluição atmosférica registrados, como o índice de qualidade do ar. O índice de qualidade do ar específica o estado da poluição em cada área territorial e futuras projeções de poluição. Várias estações de monitorização estão distribuídas em todo o mundo e fornecem uma análise global, nacional e regional do status da qualidade do ar.
Este estudo compreende uma revisão da literatura, análise crítica e caso de estudo de indicadores de qualidade do ar e seus impactos na saúde pública. O principal objetivo deste estudo foi analisar os impactos na saúde em relação aos indicadores de qualidade do ar e cenário de emissão de poluentes para Portugal. Este trabalho foi realizado entre fevereiro e setembro de 2017, com foco na literatura de 1995 a 2017, usando as bases de pesquisa da Web of Science, PubMed e ScienceDirect. A metodologia principal aplicada ao caso de estudo foi a análise de emissões, concentrações de poluentes, da qualidade do ar, efeitos sobre a saúde, no seu desenvolvimento e tendências entre os anos 2009 e 2015, bem como, a discussão das suas potenciais relações. Atendendo ao objetivo principal deste estudo, foi necessário considerar que uma análise direta entre emissões, concentrações poluentes da qualidade do ar e efeitos sobre a saúde, não era aplicável considerando os diversos processos químicos e físicos que estão envolvidos, e que desempenham um papel central no desenvolvimento de poluentes e na sua distribuição geográfica.
A análise das emissões destacou vários pontos: (i) Alentejo e o Algarve com valores de emissões reduzidos para quase todos os poluentes em estudo comparativamente às outras regiões; (ii) a área metropolitana de Lisboa é a região mais problemática quanto às emissões, com poucas melhorias e elevadas emissões comparativamente às outras regiões; (iii) a região central do país apresentou um incremento das emissões de dióxido de carbono.
A análise da qualidade do ar apresentou: (iv) a concentração de Ozono troposférico diminuiu em todo o país; (v) no caso dos poluentes, dióxido de nitrogénio e matéria particulada de diâmetro igual ou inferior a 10 micrómetros (PM10), grande parte do norte do país apresenta um aumento nas respetivas concentrações; situação contrária observada na metade sul do país que apresentou melhorias; (vi) na análise de dióxido de enxofre e matéria particulada de diâmetro igual ou inferior a 2.5 micrómetros (PM2.5), as regiões do Alentejo e a área metropolitana de Lisboa mostraram um aumento, enquanto outras regiões apresentaram melhorias com a redução das concentrações de poluentes na atmosfera.
Em termos de saúde pública, os indicadores de saúde estudados mostraram diferentes tendências, dependendo da causa da mortalidade e da região em questão, destacando-se as melhorias, principalmente nas regiões alentejana e algarvia. As regiões do Norte, Centro e área metropolitana de Lisboa são regiões que apresentam elevados índices de mortalidade, em comparação com as outras regiões. As possíveis ações para mitigar as emissões de poluentes atmosféricos devem ser concentradas na área metropolitana de Lisboa, nas regiões Norte e Centro, em particular nos distritos de Lisboa, Setúbal e Porto.
vi
L
IST OF
P
UBLICATIONS
POSTER PRESENTATION
Air Pollution and its Adverse Impacts on Human Health: FUTURAR project review
Ana Mendes, Solange Costa, Joana Ferreira, Joana Leitão, Pedro Torres, Carlos Silveira, Hélder Relvas, Myriam Lopes, Alexandra Monteiro, Peter Roebeling, Ana Isabel Miranda, João Paulo Teixeira
Young Researchers Day 2017 organized by National Health Institute Dr. Ricardo Jorge, 8th May, Lisbon, Portugal.
ARTICLES IN NATIONAL JOURNALS WITH SCIENTIFIC PEER-REVIEW
Impactes da poluição atmosférica na Saúde: Perspetivas do Projeto FUTURAR
Ana Mendes, Solange Costa, Joana Ferreira, Joana Leitão, Pedro Torres, Carlos Silveira, Hélder Relvas, Myriam Lopes, Alexandra Monteiro, Peter Roebeling, Ana Isabel Miranda, João Paulo Teixeira
Boletim Epidemiológico Observações do Instituto Nacional de Saúde Doutor Ricardo Jorge, Volume 6 – Número Especial 9, Doenças Não Transmissíveis, 2017 ISSN: 0874-2928 | ESSN: 2182-8873 – Disponível em: http://www.insa.min-saude.pt/category/informacao-e-cultura-cientifica/publicacoes/boletim-epidemiologico-observacoes/#sthash.qfmiidyr.dpuf
ARTICLES IN INTERNATIONAL JOURNALS WITH SCIENTIFIC PEER-REVIEW
To be submitted to Atmospheric Environment (IF: 3.629; Q1) Air Pollution: a scenario approach and its Public Health Impacts
Pedro Torres, Joana Ferreira, Carlos Silveira, Solange Costa, Maria do Carmo Pereira, Hélder Relvas, Myriam Lopes, Alexandra Monteiro, Peter Roebeling, Ana Isabel Miranda, João Paulo Teixeira, Ana Mendes
viii
L
IST OF
T
ABLES
Table 1 - Air pollution incidents throughout history ... 5
Table 2 - Health effects due to exposure to pollutant... 7
Table 3 - Air quality limit values for PM10 and PM2.5 as given in the EU Ambient Air Quality Directive and WHO AQGs ... 19
Table 4 - Air-quality standards for NO2 (and NOX) as set out in the EU Ambient Air Quality Directive ... 22
Table 5 - Air-quality standards for O3 as defined in the EU Ambient Air Quality Directive and WHO ... 24
Table 6 - Guideline values for SO2 emissions. ... 26
Table 7 - Core Health Indicators - Risk Factors List ... 35
Table 8 - 100 Core Health Indicators - Health Status ... 37
Table 9 - Symptoms from Heavy Metals Poisoning ... 39
Table 10 - Summary table of the variations between emissions of atmospheric pollutants (NOx, SOx, PM10, CH4) for the years 2009 and 2015 ... 60
Table 11 - Summary table of the variations between emissions of atmospheric pollutants (CO2, NH3, PM2.5) for the years 2009 and 2015 ... 60
Table 12 - Identifying information of the background monitoring stations in urban environment, used in this analysis (original denomination) ... 62
Table 13 - Concentrations of pollutants (O3; NO2), in the years 2009 and 2015, for the different monitoring stations selected ... 62
Table 14 - Concentrations of pollutants (SO2; PM10), in the years 2009 and 2015, for the different monitoring stations selected ... 64
Table 15 - Concentrations of pollutants (PM2.5), in the years 2009 and 2015, for the different monitoring stations selected ... 64
Table 16 - Summary table of the variations in the number of deaths associated with respiratory diseases between 2009 and 2015 for the regions of mainland Portugal ... 72
Table 17 - Summary table of the variations in the number of deaths associated with circulatory diseases between 2009 and 2015 for the regions of mainland Portugal ... 72
x
L
IST OF
F
IGURES
Figure 1 - Map of the air quality index in Portugal (information for August 12, 2017) ... 2
Figure 2 - World Population Distribution: Urban & Rural... 2
Figure 3 - Air pollution sources and effects ... 4
Figure 4 - Search material selection process flowchart ... 11
Figure 5 - Examples of maps of spatial distribution of SOx in continental Portugal for the years 2005 (a) and 2008 (b) ... 14
Figure 6 - Lungs penetration of difference sizes of PM: Represents the areas where PM from incomplete combustion processes is deposited in the body ... 17
Figure 7 - Penetration of different-sized particles into the human body... 18
Figure 8 - PM size distribution ... 20
Figure 9 - Processes involved in the nitrogen cycle ... 22
Figure 10 - Diagram of O3 formation: (a) O3 equilibrium without the presence of VOCs; (b) O3 generation in the troposphere ... 23
Figure 11 - Graphical representation of the conditions for the use of SO2 as an indicator of air quality ... 25
Figure 12 - Processes involved in acid deposition ... 26
Figure 13 - Diagram of the sequence of events triggered by smoke inhalation ... 28
Figure 14 - Natural and Anthropogenic Sources of CH4 ... 30
Figure 15 - Stages of methane fermentation ... 30
Figure 16 - Graphic representation of Nitrogen Cycle... 34
Figure 17 - Health impacts of air pollution. Source: European Environment Agency, 2017 ... 38
Figure 18 - Framework for the development and identification of environmental health indicators ... 40
Figure 19 - Co-benefits of mitigating air pollutants emissions for future air quality and human health. ... 41
Figure 20 - Example of a global emissions reduction scenarios ... 41
Figure 22 - Number of days on which air quality is low or bad (2001-2008) ... 47
Figure 23 - Schematization of the evolutionary trend of gaseous emissions in Portugal ... 48
Figure 24 - Evolutionary progression of acidification potential in Portugal ... 48
Figure 24 - Air quality index for Portugal for 2015 ... 49
Figure 25 - Maps of spatial distribution of CH4 emissions in continental Portugal for the years 2009 (a) and 2015 (b) ... 52
Figure 26 - Maps of spatial distribution of Ammonia emissions (NH3) in continental Portugal for the years 2009 (a) and 2015 (b) ... 53
Figure 27 - Maps of spatial distribution of NO2 emissions in continental Portugal for the years 2009 (a) and 2015 (b) ... 54
Figure 28 - Maps of spatial distribution of Sulfur Oxides emissions (SO2) in continental Portugal for the years 2009 (a) and 2015 (b)... 55
xi
Figure 29 - Maps of spatial distribution of Carbon Dioxide emissions (CO2) in continental Portugal for the years 2009 (a) and 2015 (b)... 56 Figure 30 - Maps of spatial distribution of Particulate Matter emissions (PM10) in continental Portugal for the years 2009 (a) and 2015 (b) ... 57 Figure 31 - Map of spatial distribution of Particulate Matter emissions (PM2.5) in continental Portugal for the year 2015 ... 58 Figure 32 - Spatial distribution of background monitoring stations in urban environment, used in this analysis ... 61 Figure 33 - Graphical representation of the evolution of the number of deaths from circulatory system diseases from the year 2003 to 2009, in Portugal ... 66 Figure 34 - Graphical representation of the evolution of the number of deaths from respiratory system diseases from the year 2003 to 2009, in Portugal ... 66 Figure 35 - Graphical representation of the evolution of the number of deaths due to malignant neoplasm of the trachea and bronchi and lungs from the year 2009 to 2015, in the different regions of continental Portugal ... 67 Figure 36 - Graphical representation of the evolution of the number of deaths from diseases of the circulatory system from the year 2009 to 2015, in the different regions of continental Portugal ... 67 Figure 37 - Graphical representation of the evolution of the number of deaths from ischemic heart disease from the year 2009 to 2015, in the different regions of continental Portugal ... 70 Figure 38 - Graphical representation of the evolution of the number of deaths from respiratory diseases from the year 2009 to 2015, in the different regions of continental Portugal ... 70 Figure 39 - Graphical representation of the evolution of the number of deaths from chronic lower airway diseases from the year 2009 to 2015, in the different regions of continental Portugal ... 70 Figure 40 - Graphical representation of the evolution of the number of deaths due to asthma and malaise from the year 2009 to 2015, in the different regions of continental Portugal ... 71xii
L
IST OF EQUATIONS
(1) Formation of Nitrogen Oxide and Nitrogen Radical ... 21
(2) Formation of Nitrogen Oxide and Oxigen Radical ... 21
(3) Formation of Nitrous Oxide ... 21
(4) Formation of Nitrous Oxide and Hidrogen Radical ... 21
(5) Formation of Nitrous Oxide and Carbon Dioxide ... 21
(6) Formation of Carbon Dioxide and Oxigen ... 23
(7) Dissociation of Methane ... 23
(8) Formation of Aldehyde ... 24
(9) Formation of Sulfur Dioxide ... 26
(10) Formation of Sulfuric Acid ... 26
(11) Formation of Ammonium Nitrate ... 33
(12) Formation ofAmmonium Sulfate ... 33
xiv
A
BBREVIATIONS
(NH4)2SO4 --- Ammonium sulphate µg/m3 --- Microgram per cubic meter
µm --- Micrometre
AIDS --- Acquired Immune Deficiency Syndrome APA --- Associação Portuguesa do Ambiente AQG --- Advanced Quality Group
AQI --- Air quality index AQS --- Air Quality Standard ARF --- Acute Respiratory Failure
atm --- Atmosphere (unit of pressure) BaP --- Benzo(a)pyrene
BOD --- Biological Oxygen Demand C3a --- Anaphylatoxin fragment C6H6 --- Benzene
CAFE --- Clean Air for Europe Programme CH4 --- Methane
CO --- Carbon monoxide CO2 --- Carbon dioxide
COD --- Chemical Oxygen Demand COHb --- Carboxyl HemogloBin
COPD --- Chronic Obstructive Pulmonary Disease DNA --- Deoxyribonucleic acid
Dp --- Diameter of particle
DPSEEA --- Driving Force-Pressure-State-Exposure-Effect-Action EC --- European Commision
EEA --- European Environment Agency
EFFIS --- European Forest Fire Information System EU --- European Union
FCT --- Foundation for Science and Technology FEDER --- European Regional Development Fund
FEUP --- Faculty of Engineering of the University of Porto GHG --- Green House Gases
H· --- Hydrogen free radical H2 --- Hydrogen
H2O --- Chemical formula of water H2SO4 --- Sulfuric acid
HA --- Hyaluronic acid HbA --- Adult hemoglobin HbF --- Fetal hemoglobin
xv
HCl --- Hydrogen chlorideHg --- Mercury
HIV --- Human Immunodeficiency Virus HNO3 --- Nitric acid
hv --- High Voltage
IHR --- Internet Health Resources INE --- National statistical institute
INERPA --- National Inventory of Atmospheric Emissions IPCC --- Intergovernmental Panel on Climate Change
IQAr --- Air Quality Index
ISPUP --- Institute of Public Health, University of Porto IUPAC --- International Union of Pure and Applied Chemistry
Kg/m3 --- Kilogram per cubic metre
LEPABE --- Laboratory for Process Engineering, Environment, Biotechnology and Energy
MF --- Masculine/Feminine Mt --- Megatonne
N --- Element Nitrogen N2 --- Atmospheric Nitrogen N2O --- Nitrous oxide
NCO· --- Isocyanato radical
NEC --- National Emission Ceilings NH· --- Aminylene NH3 --- Ammonia NH4+ --- Ammonium NH4NO3 --- Ammonium nitrate NO --- Nitrogen oxide NO2 --- Nitrogen dioxide NO2- --- Nitrite ion NO3- --- Nitrate ion
NOx --- Generic term for the nitrogen oxides O --- Element Oxygen
O(1D) --- Oxygen atom in an excited singlet state O(3P) --- Atomic Oxygen
O2 --- Atmospheric oxygen O3 --- Ozone
OH· --- Hydroxyl radical PGIg --- Prostacyclin
pH --- potential of Hydrogen PM --- Particulate Matter
xvi
PM10 --- Particulate Matter of 10 µm in DiameterPM2,5 --- Particulate Matter of 2,5 µm in Diameter PmV --- Pulmonary Microvascular Pressure
ppb --- Parts per Billion ppm --- Parts per million
PRIME --- Plume RIse Model Enhancements
RAINS --- Regional Air Pollution INformation and Simulation R'CHO --- Aldehyde
RH --- Generic volatile organic compound RO --- Alkoxyl radical
RO2 --- Peroxy radical
SICO --- Information System for Death Certificates SIRIC --- System of Civil Registry and Identification
SO2 --- Sulfur dioxide SO3 --- Sulfur trioxide SOx --- Sulfur Oxides
t.Km-2 --- Ton per square kilometer TB --- Tuberculosis
TxAg --- Triacylglycerol UFP --- Ultra-Fine Particle
VOC --- Volatile Organic Compound WHO --- World Health Organization
xviii
T
ABLE OF
C
ONTENTS
Part I - Introduction ... 1 1. Overview ... 1 2. Aims ... 9 3. Methodology ... 11 3.1. Literature Review Analysis ... 11 3.2. Case Study Data Analysis ... 13 Part II - Present Study ... 17 4. Literature Review ... 17 4.1. Particulate Matter ... 17 4.2. Nitrogen Oxides ... 21 4.3. Ozone ... 23 4.4. Sulfur Dioxide ... 25 4.5. Carbon Monoxide ... 27 4.6. Methane ... 29 4.7. Ammonia ... 33 4.8. Air Pollution and Health Effects Assessment ... 35 4.9. Emissions Reduction Scenarios ... 41 4.10. Legislation ... 43 4.10.1. European Overview ... 43 4.10.2. Portuguese Overview ... 44 4.11. Situation in Portugal ... 47 5. Case Study: Results and Discussion ... 51 5.1. Emission Outlook ... 51 5.1.1. Methane ... 52 5.1.2. Ammonia ... 53 5.1.3. Nitrogen Dioxide ... 54 5.1.4. Sulfur Dioxide ... 55 5.1.5. Carbon Dioxide ... 56 5.1.6. Particulate Matter (PM10) ... 57xix
5.1.7. Particulate Matter (PM2.5) ... 58 5.1.8. Emissions overview ... 60 5.2. Air Quality Concentrations Overview ... 61 5.3. Public Health Indicators ... 65 5.3.1. Public Health Overview ... 72 5.4. Environment and Health Considerations ... 73 6. Final Remarks ... 74 7. Further Developments ... 76 8. References ... 78 Appendix: Publications1
P
ART
I
-
I
NTRODUCTION
1. O
VERVIEW
Air pollution has wide-ranging and harmful effects on human health and is a major issue for the global community and urban sustainability [1, 2]. Outdoor air quality plays an important role in public health and has long been a concern for citizens [3].
In order to mitigate the effects and reduce emissions and consequent concentrations of atmospheric pollutants, several tools have been developed to monitor the development of recorded atmospheric pollution values, serving as indicators of the environmental status of the areas concerned. One such indicator often used is the air quality index.
The Portuguese air quality index is an indicator that quantitatively evaluates several environmental parameters, resulting in a global classification, providing a generalized view of the situation in question.The reason air quality index differ from country to country is that the choice of parameters for this indicator varies according to the entity responsible for determining the indicator, and because of that, it is always required the list of parameters used when the air quality index is presented.
This air quality indicator specifies the state of pollution in each territorial area and future projections of pollution. Moreover, this indicator has a ratio proportional to the percentage of population in question to sense the harmful health effects that derives from the aggravation of the pollution [4]. Several monitoring stations are distributed around the world to provide a global, national and regional analysis of the existing air quality status. The air quality index is the result of a specific method of calculation, using reference values for various substances (all calculated and calibrated for measurements). This information is later treated and, using color coding, presented in multichromatic maps, also considering the health effects associated with the substances.
The resulting values are then compared with the ranges of concentration values associated with a color scale in which areas not covered by the index calculation method are shown in gray as shown in Figure 1.
2
Figure 1 - Map of the air quality index in Portugal (information for August 12, 2017) Adapted [5]
In 2010, urban areas contained more than half of the world's population, and in Europe, three-quarters of the population lived in cities, as presented in Figure 2. Studies point out to a tendency to increase these values: by the year 2030 it is speculated that six decimals of the world population will live in urban environment and by the year 2050, it is estimated to a value of seven tenths [6].
3
With the industrial advances and technological developments observed in the last decades, a crucial factor for the evaluation of society development will be the environmental evaluation of the industrial sectors and the daily life of the population. In developed countries, outdoor air pollution comes mainly from industry, automotive combustion vehicles, power generation and domestic activities [8]. From an environmental perspective, the assessment of emissions of air pollutants is crucial because of the increase in emission levels for anthropogenic air pollutants, which far exceed the values recorded in recent decades [9].Studies have been carried out to identify pollutant sources and the physicochemical characterization of atmospheric pollutants and their harmful contributions to the population, thus allowing the identification of sources of pollutant emissions such as the burning of fossil fuels [8].
Since the beginning of the 20th century, public health problems have attracted attention, especially in urban centers, due to its greater concentration of pollutants [9]. In urban centers, industrial and vehicular emissions are of major importance but in rural areas and smaller cities, biomass burning and forest fires have a major share in the contribution to air pollution in rural centers [8].
The International Union of Pure and Applied Chemistry (IUPAC) defines air pollution as “the presence of substances in the atmosphere, resulting either from human activity or natural processes, present in sufficient concentration, for a sufficient time and under circumstances such as to interfere with comfort, health or welfare of persons or the environment”. As such, a quantitative analysis of air pollutants and their respective effects on health is vital, providing all the necessary conditions for the design of strategies to reduce emissions of air pollutants.
Air pollution is a mixture of compounds that vary depending on the emitting sources, and the processes involving the emitted pollutants. There are four main types of air pollution sources: mobile sources – such as cars, buses, planes, trucks, and trains; stationary sources – such as power plants, oil refineries, industrial facilities, and factories; area sources – such as agricultural areas, cities, and wood burning fireplaces; and natural sources – such as wind-blown dust, wildfires, and volcanoes [10] (Figure 3). Generally, pollutants monitored by air quality monitoring networks are: Ozone (O3), Lead (Pb), Carbon monoxide (CO), Sulfur oxides (SOx), Nitrogen oxides (NOx), Particulate matter (PM), Ammonia (NH3) and Methane (CH4) [8].
It is understood as primary air pollutant, all the pollutant emitted directly to the air, coming from the emitting sources [11]. Dusts, fumes and a wide range of toxic chemicals can be included in the classification of primary pollutants, being exhaust fumes from road traffic and industrial chimneys, presented as some of the sources of primary pollution [12]. This type of pollutant can directly affect the population through inhalation or skin contact, but can also serve as a precursor to secondary air pollutants [11].
4
For secondary pollutants, this classification is subsequently to the fact that these pollutants are not emitted from conventional sources, but instead are generated or modified from the primary pollutants. The generation of the secondary pollutants occurs by reactions of chemical compounds present in the atmosphere or by reactions with sunlight, taking photochemical reactions [12].Pollution from human-generated and natural sources are created in one place, transported through the air, and sometimes changed by chemical reactions before being deposited (Figure 3) [13]. The effects of this pollution can be local, as well as, global since air pollution is a transboundary issue.
Figure 3 - Air pollution sources and effects [13]
The association between air pollution and the impact on health of people with respiratory and cardiovascular diseases has been demonstrated by epidemiological studies [14-22]. It was also proven a relationship with the increase in mortality and morbidity due to cardiovascular and respiratory disease in susceptible population [23-27]. Moreover, it have been shown that atmospheric pollutants such as O3 and PM cause health risks in many developed countries and have had harmful effects on the population at increasingly lower concentrations [28].
5
Annually, reports have been published regarding emissions of air pollutants [29], covering the European panorama with national geographic scale, that is, these report cover all the member countries of the EU, individually. Different situation in this work, which addresses only Portugal but on a regional scale.Air pollution is not limited to the political and geographical borders of countries, therefore international action is required to reduce levels of pollutant emissions worldwide. A report released by the World Health Organization (WHO) has recognized air pollution as the greatest health risk [30]. In 2005, the WHO published an update to the Air Quality Guidelines, which set the limit values for exposure to air pollutants and public health consequences. Since then several reports released by WHO, have been focusing the health and economic impacts and costs of air pollution [31-35], as well as, reviews for several outdoor and indoor air pollutants [36-39].
The need to devise emission reduction strategies at a global level is closely linked to past events that have brought large numbers of casualties and have had serious adverse effects on the population. The table 1 lists some of the major events related to outdoor air pollution throughout history.
Table 1 - Air pollution incidents throughout history [40]
Location Air Pollution Incident Date
Meuse Valley, Belgium [41] Fog 1930
Los Angeles, America Photochemical Smog 1940
Donora, America [42] Haze 1948
London, England [43] Smog 1952
Several cities, China [44] Haze Current
Air pollutants present changes in their mobility and durability when climate change is imposed in their environment. Conditioning factors such as temperature, wind speed and direction, and precipitation are some of the meteorological factors that cause changes in the implications associated with the exposure of the pollutants to the population. Weather conditions are some of the factors that divide the exposure of pollutants into two types according to their duration, short-term and long-short-term exposure [45].
Although there has been a decline in atmospheric pollutant concentrations in some parts of the world, recent studies [46-48] corroborate the long-term exposure of pollutants with mortality from cardiopulmonary and lung cancer [49].
6
Regarding short-term exposure, there is a greater severity with the direct and immediate contact of the pollutant, affecting profoundly the first immunologic barriers of the organism. Table 2 presents some of the effects associated to atmospheric pollutants considering different time intervals of exposure of the population.7
Table 2 - Health effects due to exposure to pollutant [15]
Pollutant Health effects related
Short-term exposure Long-term exposure
Nitrogen Dioxides (NO2)
Effects on lung function, especially asthmatics; Increased inflammatory
reactions in the airways; Increase in hospital admissions; Increased mortality
Reduction of lung function; Increased likelihood of respiratory symptoms
Tropospheric ozone (O3)
Adverse effects on lung function and symptoms; Inflammatory reactions of the lung; Increased use of medication; Increase in hospital admissions; Increased mortality
Reduction of lung function development
Particulate Matter (PM)
Inflammatory reactions of the lung;
Respiratory symptoms; Adverse effects on the cardiovascular system; Increased use of medication; Increase in hospital admissions; Increased mortality
Increased respiratory symptoms of the "lower" airways;
Reduction of lung function in children and adults; Increased COPD (Chronic Obstructive Pulmonary Disease); Reduction in life expectancy
Sulfur
Dioxide (SO2)
Increase in hospital admissions for
cardiovascular diseases; Increased mortality in children due to respiratory diseases
Reduction of lung function; Increased resistance of specific airways and respiratory
symptoms (Effects resulting from exposure to particulates) Carbon
Monoxide (CO)
Effects related to interference in the transport of O2 (hypoxia, neurological alterations - behavioral, among others); Increased daily mortality and hospital admissions for cardiovascular diseases
- Volatile Organic Compounds (VOCs) -
Reduction of lung function; Increased likelihood of respiratory symptoms
8
These harmful effects on the population health may be accompanied by negative impacts on biodiversity both in areas close to emission sources and in remote areas due to transport phenomena of long-range pollutants [50].In addition to economic impacts, represented by increased medical costs, number of obits and decreases in productivity indexes for days lost, air pollution is also responsible for damage to buildings, roads, bridges and other public constructions [51].
Featuring such a wide range of adverse effects, a spreading rate of harmful effects and a widespread cause-and-effect relationship to such a diverse geographic dimension, from local to global levels, air pollution is a global challenge, requiring in the initial phase, corrective and preventive measures at the local level [52].
This work also deals with issues related to the relationship between the evolutionary trends of atmospheric pollutants and the evolution of selected health indicators to qualify public health, particularly in mainland Portugal.
In the course of this work, brief descriptions of atmospheric pollutants considered to be of greater influence in public health will be presented, some of which will be the subject of further study in this work, from emission sources to associated effects in public health.
In addition to having a special focus on these pollutants as they have the greatest environmental impact, these pollutants are also identified as some pollutants with harmful effects and more severe associated medical complications.
The cause - effect relationship found between pollutants and health indicators is best documented and quantified for PM [53, 54], as the strongest cause-and-effect relationship between pollutants [55-57].
Associated with air pollution, harmful effects on health encompass a range of steps, from harmless irritations to death. For each individual, the sensed symptoms may present diverse levels of spread and seriousness, depending on a set of endogenous and exogenous factors, from immunology and biochemical factors to climatic conditions and viral infections [58-60].
This work comprises a literature review, critical analysis and Case Study of air quality indicators and its impacts in the field of public health. The studied pollutants were chosen among those responsible for acidification, eutrophication and ground-level O3 pollution.
9
2. A
IMS
The main outcome of this study was to analyze the health impacts regarding the air quality indicators and pollutant emission scenario for Portugal.
A set of conclusions was produced focusing the evolution of air pollutants concentrations and emissions between 2009 and 2015 and its public health impacts. This review and Case Study sets important information for environmental and public health decision-making processes of the Portuguese representatives.
To accomplish the proposed main goal, the following specific objectives were set along the work.
i. Review and critical analysis of air quality indicators and its impacts in the field of public health;
ii. Review of national pollutant emissions survey; iii. Review of the Portuguese air quality index;
iv. Study of the framework of emissions of atmospheric pollutants in a national perspective; v. Review and study of the public health impacts due to air pollution considering the
11
3. M
ETHODOLOGY
3.1.
L
ITERATURER
EVIEWA
NALYSISThis review was conducted between February and September 2017, focusing on the literature from 1995 to 2017, using the Web of Science, PubMed and ScienceDirect databases. The keywords and phrases used for the search were the combinations of terms "pollution", "air", "health effects", "environmental guidelines", "heavy metals", "air quality index", "Particles", "nitrogen emissions", "ozone", "tropospheric ozone", "acid deposition”, "inhalation of smoke", "methane ", "emission reduction scenarios", "emission trends", "Ammonia", "carbon monoxide", "carbon dioxide", "European Environment Agency", "sulfuric acid", "volatile organic compounds", "environmental legislation", "particulate matter AND air quality AND health effects" , "NO2 AND air quality AND health effects", "ozone AND air quality AND health effects", "ammonia AND air quality AND health effects" and "methane AND air quality AND health effects".
The survey included articles in English and Portuguese, review articles, case studies, and international and national reports. Articles older than 1995 were excluded, given that the older articles used, focus more on specific case studies of past events involving the topic in question. Other exclusion criteria focused on repeated articles and articles that did not cover the specific subject matter required.
Figure 4 presents the flowchart of the research material selection process.
13
3.2.
C
ASES
TUDYD
ATAA
NALYSISIn this paper, several criteria for selecting information were taken into consideration, with the purpose of creating a concise research and conclusions relevant to the focus of this study.
All the decision-making processes during this study were always in compliance with the selected criteria, which were divided into four stages: (i) selection of three study fronts (emissions, concentrations, and health indicators); (ii) selection of years used for the study (2009 and 2015); (iii) selection of information on emissions of air pollutants at national level; (iv) selection of information for concentrations; and selection of health indicator information.
The principal method of the Case Study was the emissions analysis, air quality pollutant concentrations and health effects expressed by indicators and their possible relationships. All the criteria related to the choice of geographic scales and time intervals took into consideration the most recent information available, as well as, selecting information in order to facilitate the qualitative analysis of the data collected, thus helping to understand the conclusions obtained in this work.
Considering the main objective of this study, it was necessary to consider that a direct analysis of the relations between these three inputs (emissions, air quality pollutant concentrations and health effects) was not a direct one, since many chemical and physical processes are involved, which play a central role in the development of pollutants and their geographical distribution. These processes are based on: transport of air pollutants, conditioned by weather conditions; chemical transformation processes, such as the generation of secondary pollutants and associated factors; and deposition, which is also associated with climatic factors.
For this study, the years 2009 and 2015 were used, not because there were significant meteorological or environmental anomalies recorded in those years, but as were the two most recent years with reports presented by the main source of information selected for this study (INERPA - National Inventory Of Emissions [61]) for the emissions part. Additionally, the years 2009 and 2015 were selected, since they are the most recent years where an aggregation of information is presented [62], of all the pollutants.
Regarding the other parts of the study, the years used were the same as those of the emissions, even though there are data referring to more recent years, since data coherence is a curricular factor for studies of this type.
For the collection of information on air pollutant emissions, the focus was on collecting information from government sources only to guarantee impartiality in data acquisition.
14
The National Pollutant Emission Inventory (INERPA) was the source of information for the emission of pollutants, being an instrument of analysis of air quality, whose entity responsible for its performance is the Portuguese Environmental Agency (APA).For the analysis of the spatial distribution of pollutant emissions for the years under study, the decision was taken to aggregate the values in regions, resulting in maps of the regions emissions in mainland Portugal, similar to the maps shown in Figure 5, differentiated only on the geographic scale used In the analysis of the data. The process of choosing the geographic scale in the issue of emissions took into consideration the presentation of the data referring to the public health indicators, which are also found in areas of the country: North, Center; Alentejo; Algarve and Lisbon.
Figure 5 - Examples of maps of spatial distribution of SOx in continental Portugal for the years 2005 (a) and 2008 (b) [63, 64]
This aggregation was necessary because, for the emissions data, all values were grouped into municipalities and divided into emission sector, and for the latter, it was also necessary to aggregate the data to obtain a general perception of all the resulting emissions in each district in the two years in question.
The analysis of emissions was based on the study of emission maps, which followed certain specifications, such as the presentation of the same APA color scheme in previous year's emission reports, as well as the use of the same ranges of emission values presented in map captions.
This part of the information was obtained through the APA's Online Air Quality Database, which is a multifaceted tool that publishes information from air quality indexes to pollutant concentrations statistics at each monitoring station.
Regarding the spatial distribution, air monitoring stations do not cover the entire national territory and are not uniformly dispersed, with a greater concentration of stations in the coastal zone of
15
the country. The spatial divisions used in the presentation of the concentration values in the database used are referred to as Air Quality Index zones (IQAr zones), and only one monitoring station was chosen for each zone for each type station (background, traffic and industrial).In the existence of more than one air monitoring station, in a given zone, the selection criterion fell on the population density of the area covered by the stations in question, giving priority to the station with the highest population density.
After the selection of the monitoring stations, the validation criteria of concentration values presented in the database were delineated. Values presented with null efficiencies were discarded and presented as nonexistent, as when they were presented as "???".
This third part of the information collection focuses on the main public health indicators related to medical complications in the field of respiratory and cardiac systems.
As in the previous stages, it was important to gather information from public governmental sources and, unlike information on emissions and concentrations, information was collected from 2009 to 2015, in order to more rigorously assess evolutionary trends of public health in Portugal.
The main indicators related to the respiratory system and some indicators related to cardiac complications with possible causes associated to air pollution were selected, resulting in a set of eight health indicators, for the years 2009 to 2015.
As the required information was available at various geographic levels, it was decided to select information by zones of Portugal (North, Center, Metropolitan Area of Lisbon, Alentejo and Algarve), since the remaining options were too comprehensive (national geographic level) or with own type of aggregation without any coincidence with the municipal, district or IQAr zones.
The option to graph the information in question was chosen with the purpose of facilitating the temporal analysis of the evolutionary trends of the parameters indicative of the Portuguese public health situation, until the year 2015 (the most recent year available).
17
P
ART
II
-
P
RESENT
S
TUDY
4. L
ITERATURE
R
EVIEW
4.1.
P
ARTICULATEM
ATTERAs the pollutant that most affects the population, PM consists of sulfate, nitrates, sodium chloride, coal, mineral dust, water, ammonia, biological compounds, organic compounds and various metals, being a complex mixture of material in the solid state, liquid and gaseous, suspended in the air [34].
Of these particles, the smaller particles (≤10 micrometers in diameter) are the most harmful particles, because they penetrate and lodge in the lungs. Although an even smaller particle size (≤2.5 micrometers – PM2.5) is recognized which, because they are even smaller particles, cause more severe damages to the respiratory system [34].
Considering the varied size found in the particles, various effects can be recorded with different gravity, always starting from the principle that the smaller the particle, the more severe the effects, as represented in the Figure 6.
Figure 6 - Lungs penetration of difference sizes of PM: Represents the areas where PM from incomplete combustion processes is deposited in the body [65]
18
The organic matter that can be extracted from PM2.5as volatile and semi-volatile organic compounds includes thousands of chemicals ranging from aromatic and alkaline compounds to polar carboxylic and aromatic acids [66].The particle size varies and therefore different categories are defined: coarse particles, larger than 1 μm and ultrafine particles, smaller than 0.1 μm in the aerodynamic diameter, whereas the thin and ultrafine are capable of reaching the pulmonary alveoli in the upper respiratory tract, as represented in the Figure 7 [67].
Figure 7 - Penetration of different-sized particles into the human body [68]
The airborne particles present irregularities both in the form and in their aerodynamic behavior, using terms tailored to the diameter of an ideal spherical particle, as aerodynamic diameter. The aerodynamic diameter is commonly identified as the particle size, being the sampling basis for the particles. This term is defined as the diameter of the spherical particle of density 1000 kg/m3 and the rate of sedimentation equal to that of an irregular particle. The aerodynamic diameter alone is not sufficient to determine the shape or dimensions of a particle, as there may be particles with same aerodynamic diameter and different shapes.
Epidemiological studies have indicated that exposure to PM contributes significantly to mortality from pulmonary and cardiovascular diseases, also showing that long exposure to this pollutant results in harmful physiological effects such as altered lung function, increased blood plasma viscosity and induction of the systemic pro-inflammatory stimulus, pro-coagulant and oxidative stress.
Other consequences for human health have also been documented in several studies, reaching a wide range of effects, such as respiratory complications in children, reproductive effects, genetic damage and carcinogenic risk [66].
In accordance with the European air quality guidelines and the WHO, the values given in the Table 3 refer to the emission limit values for PM according to their aerodynamic diameter.
19
Table 3 - Air quality limit values for PM10 and PM2.5 as given in the EU Ambient Air Quality Directive and WHO AQGs [29]
Size Fraction
Averaging Period EU Air Quality Directive WHO Guidelines PM10 1 day 50 µg/m3 50 µg/m3 Calendar Year 40 µg/m3 20 µg/m3 PM2.5 1 day - 25 µg/m3 Calendar Year 25 µg/m3 20 µg/m3
The PM2.5 guideline results from the conversion of the PM10 guideline, with a ratio of 0.5 to PM2.5/PM10 in urban areas, and a ratio of 0.5 to 0.8 for rural areas [34].
Some studies indicate that PM2.5 is responsible for about 0.8 million premature deaths per year and about 6.4 million deaths globally, accounting for the annual reduction of one year of life expectancy in Europe [6].
Other studies point to the number of premature deaths to higher values such as 4 million people in the year 2012, thanks to the harmful effects of atmospheric particulate pollution, with road traffic being a major contributor to the emissions of this pollutant, particularly in urban areas [69].
Concerning the phenomenology of the PM, information was compiled in a report [29] that concludes that sulfate and organic matter are the main tributaries for the registered values of the average annual concentrations of mixed particulate material, considering that there is no mineral deposit, because if there is, this mineral dust is also a major contributor to PM10 concentrations.
Because of its complexity and variation in size, differences in exposure assessment and human dosage, several terms were used to describe PM.
Certain terms used come from the sampling methods used, resulting in "particulate matter" and "black smoke".
The site of deposition in the respiratory tract also serves to create other definitions such as "inhalable particles" relating to the respiratory tract, "thoracic particles", which are deposited in the lower respiratory tract and "respirable particles", which penetrate the region of pulmonary gas exchange, as presented in Figure 8. Other terms like PM10 come from the physiology of particles [70].
20
Figure 8 - PM size distribution [71]
Analyzing the trends of progression of emissions of PM in the atmosphere may be necessary to estimate the future concentrations of the particles, assuming, with some limitations, the same rate of progression recorded in the period of analysis.
With this projection of future emission concentrations, compliance with the European air quality standards established up to 2020 by the Clean Air Policy Package can be efficiently performed. When it comes to trends in the concentration of pollutants, limiting the study sample to only emissions of primary PM and precursor gases is difficult because the composition of monitored particles is not widely disseminated by the Environmental Air Quality Directive [29].
21
4.2.
N
ITROGENO
XIDESComing from the chemical combination of nitric oxide (NO) and NO2, NOx are formed from combustion at high temperatures, usually from combustion processes of vehicle engines and power plants. Given that NO2 is the main component of the oxides, this is the one with the most harmful effects on human health [72].
Nitrogen oxides can be divided into three categories depending on their formation mechanism: fuel oxides, rapid oxidation and thermal oxidation [73].
Atmospheric nitrogen fixation (NOx thermal) and oxy-oxidation of nitrogen compounds from pulverized coal (NOx fuel) are the main sources of NOx production [74].
In order to form nitric oxide, the reaction of oxygen atoms coming from the dissociation of O2 with nitrogen must occur. The necessary reactions are referred to as Zeldovich's mechanism:
𝑁2+ 𝑂 ∙ ↔ 𝑁𝑂 + 𝑁 (1)
𝑁 ∙ +𝑂2↔ 𝑁𝑂 + 𝑂 (2)
Sensitive to temperature, stoichiometry and residence time, these reactions require a high temperature for the dissociation of oxygen and to exceed the activation energy in order to break the triple bond of the nitrogen molecule [74].
Having as main source of emission the combustion of fossil fuels, NOx present in the combustion phases oxidizes quickly in NO2, which in turn plays a fundamental role in the formation of tropospheric O3, also contributing to eutrophication of water courses and acid rain [75].
During coal combustion processes, less than 5% of the total production of NOx refers to NO2 and nitrous acid (N2O). This small percentage is because there is low oxygen availability and short residence times in high temperature coal flames, leading to the formation of only a small percentage of NO2. In relation to the NOx, there may still be formation in the initial phase of the flame, by the reaction in gas phase, presented by the following reactions:
𝑂 ∙ +𝑁2↔ 𝑁2𝑂 (3)
𝑁𝐻 ∙ +𝑁𝑂 ↔ 𝑁2𝑂 + 𝐻 ∙ (4)
𝑁𝐶𝑂 ∙ +𝑁𝑂 ↔ 𝑁2𝑂 + 𝐶𝑂 (5)
Throughout the cycle of nitrogen, several different chemical forms arise, presenting their own characteristics, behavior and effects for health and the environment. Figure 9 presents the arrangements and transformations of the various compounds present in the biochemical cycle of the nitrogen [76].
22
Figure 9 - Processes involved in the nitrogen cycle[76]
The largest source of NOx emissions is combustion and coal, followed by the combustion of oil, ending with the burning of gas, which is the least emitting source of the three [74].
Guidelines from WHO and EU Air Quality Directive, dictate the concentration limits for this pollutant as shown in Table 4.
Table 4 - Air-quality standards for NO2 (and NOX) as set out in the EU Ambient Air Quality Directive. [29]
* - Human health limit value; ** - Alert threshold; *** - Vegetation critical level
Averaging
Period EU Air Quality Directive WHO AQG
1 hour
200 μg/m3 (not to be exceeded on
more than 18 hours per year)* 200 μg/m3 400 μg/m3**
Calendar Year 40 μg/m
3* 40 μg/m3
30 μg/m3*** -
According to recent studies, concentrations of NO2 emitted by road traffic do not appear to be decreasing. In some cases, there has been an increase in concentration, pointing to the use of oxidation catalysts and particulate filters used in diesel vehicles as probable cause [77].
Being involved in the formation of photochemical smog and acid rain and associated with depletion of the O3 layer, NOx can also affect human health more directly [73]. Nitrogen dioxide, being the most toxic oxidant, is a strong oxidant, reacting at the biomolecular level directly or by the formation of free radicals, also inducing pulmonary damage [78]. Nitric oxide reaches the population with greater severity, when the prevalence of smoking is lower and domestic consumption of gas is higher. A proportional relationship is also found between the harmful effect of nitric acid and the proportion of elderly in the population [79].
23
4.3.
O
ZONEOzone is an effect gas that studies with a crucial role the climatic changes. Being produced in the lower troposphere through photochemical processes, it has a considerably long residence time, lasting several days in the atmospheric boundary layer and several weeks in the troposphere. Several studies have shown that O3, even existing in large concentrations at certain sites, may have been formed in a different location and even far away, having been carried by the wind [80].
Normally, O3 is not emitted by natural processes or anthropogenic sources. Instead, O3 is formed by precursors [81]. O3 precursors are NOx, CO and VOCs.
These precursors have sources of emitters ranging from combustion of fossil fuels and motor vehicles (NOx and CO) to transportation, emission of organic solvents and natural emissions (VOCs) [82].
NOx and CO are the largest emissions of fossil fuels and motor vehicles. Ozone formation processes differ depending on the available precursors and their concentrations.
In Figure 10, the O3 formation process is shown by the combination of oxygen with atomic oxygen, previously formed by the photolysis of NO2 (a), and by the formation of O3 when VOC’s are present, since different compounds have different O3 formation rates [82].
Figure 10 - Diagram of O3 formation: (a) O3 equilibrium without the presence of VOCs; (b) O3 generation in the
troposphere
The following equations show the relationship between the O3 concentration and the concentrations of the precursors, given that RH represents a generic VOC [82].
𝐶𝑂𝑁𝑂→ 𝐶𝑂𝑥 2+ 𝑂3 (6)
𝐶𝐻4 𝑁𝑂𝑥
24
𝑅𝐻𝑁𝑂→ 𝑅′𝐶𝐻𝑂 + 𝑂𝑥 3 (8)
Ozone can cause pulmonary dysfunction, induction and exacerbation of asthma, premature mortality and factors related to diabetic death [83]. Some studies [84] also reveal O3 intervention in systemic metabolic adverse responses through the sympathetic nervous system and in systemic responses related to adverse health effects [83].
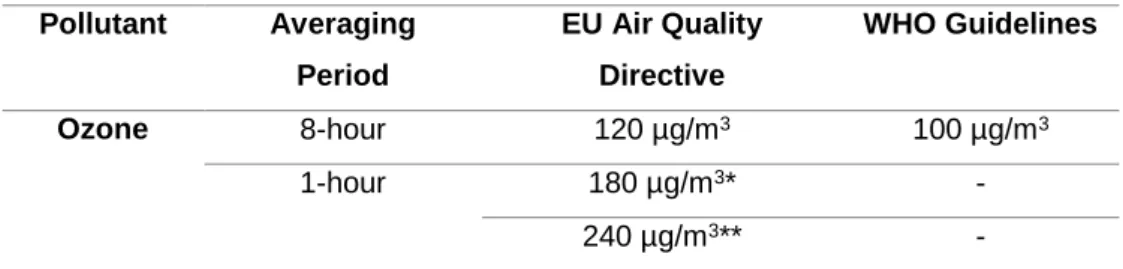
The concentrations of this gas are proportional to the concentrations of its precursors, such as NOx, methane and nonmetallic volatile organic compounds. Table 5 presents the limit values provided by EU ambient Air Quality Directive and WHO for O3.
Table 5 - Air-quality standards for O3 as defined in the EU Ambient Air Quality Directive and WHO. [20] (* -
Information threshold; ** - Alert threshold)
Pollutant Averaging Period EU Air Quality Directive WHO Guidelines Ozone 8-hour 120 µg/m3 100 µg/m3 1-hour 180 µg/m3* - 240 µg/m3** -
25
4.4.
S
ULFURD
IOXIDEWith the growing energy needs of the population, the development of power generation plants has increased, increasing with it, all harmful pollutants emitted from generation processes, such as SO2 [85]. As one of the most used air quality indicators, because it represents the effects of industrialization, SO2 stands out from other pollutants when the lower atmospheric layer is approached.
In urban zoos, SO2 comes mainly from the burning of fossil fuels (accounting for about 70% of the total emissions of this pollutant), industrial facilities (about 20%) and natural sources (about 10%) [85]. Having the worst effects on human health, SO2 reacts with atmospheric compounds, forming small particles. Subsequently, these particles penetrate the respiratory system and cause respiratory complications, even causing cancer [85].
Exposure to high concentrations of SO2 enhances health effects such as mortality from pulmonary and cardiovascular complications, non-accidental mortality, and cardiac hospitalization in the elderly [86].
Most studies related to the effects of SO2 on human health fall within the mortality parameter, with few conclusions about the years of life lost (YLLs) [87].
Figure 11 graphically shows, in a shortened way, the parameters to be taken into account for the use of pollutant concentrations to determine quality of life indicators.
Figure 11 - Graphical representation of the conditions for the use of SO2 as an indicator of air quality [87]
At the environmental level, SO2 plays an important role in the formation of acid rain, which adversely affects natural systems, agriculture and building materials, as shown in the Figure 12 [88].
26
Figure 12 - Processes involved in acid deposition (source: Wikipedia) [89]
Sulfur dioxide is the primary cause of acid precipitation, The sulfate aerosol particles formed as a consequence of these emissions impair visibility and affect human health [88]. For this, the SO2 forms a very acidic aqueous solution, explained by the equations: [85]
𝑆𝑂2+ 1
2𝑂2→ 𝑆𝑂3
(9)
𝑆𝑂3+ 𝐻2𝑂 → 𝐻2𝑆𝑂4 (10)
The sulfate aerosol particles formed as a consequence of these emissions impair visibility and affect human health [88]. Studies show [90] that a percentage of people suffer abnormalities in the respiratory system after short periods of time of exposure to, thus presenting a rather high limit value, as shown in the Table 6.[34].
Table 6 - Guideline values for SO2 emissions.
(* - Human Health Limit Value; ** - Alert threshold; *** - Vegetation Critical Level)[20]
Pollutant Averaging Period EU Air Quality Directive WHO Guidelines Sulfur
Dioxide
10 minutes - 500 µg/m3
1-hour 350 µg/m3 (not exceed 24-hour exposure per year)*
-
500** -
27
4.5.
C
ARBONM
ONOXIDECarbon monoxide is a colorless, non-irritable, odorless gas from incomplete combustion and burning of fossil fuels such as coal, oil and gas [91, 92]. CO is a useful indicator of air mass transport monitoring at various scales because it presents an average tropospheric life of about two months [93].
This gas has two types of formation origin, endo and exogenous. Being the main source of CO, the endogenous source is based on oxidative degradation of heme (prosthetic group of hemoproteins such as hemoglobin and myoglobin, and are fundamental in the processes of reversible connections of oxygen and transport) [94], catalyzed by heme oxygenase. The second type of source of monoxide, an exogenous source, includes exhaust from combustion vehicles, gas heating, wood stoves, incomplete combustion and burning of fossil fuels, power stations and mining industry.
Additionally, a source of CO created by pathological conditions such as intestinal bacteriological activity, photo oxidation of organic compounds and lipid peroxidation can be considered [95].
The most common sources of poisoning by CO include oil or gas furnaces, gas or oil heating installations, kerosene heaters, combustion equipment, automotive exhaust and household fires. After inhalation, CO diffusion occurs in the blood, binding to hemoglobin, thus creating a complex called carboxyhemoglobin (COHb). This binding occurs quickly and easily because CO has a hemoglobin affinity higher than that of oxygen by about 250 times, with values higher than fetal hemoglobin (HbF) relative to adult hemoglobin (HbA) [91]. In colder climates or seasons, cases of CO poisoning are commonly associated with exposure to emissions from fire, exhaust, heating and tobacco smoke [96].
Carbon monoxide poisoning intoxicates more particularly the brain and heart, i.e. organs with a higher oxygen demand, the latter being affected after severe poisoning, resulting in myocardial infarction, cardiac arrhythmias, hypotension, cardiac arrest and death [97].
Other occurrences of CO poisoning include the inhalation of methylene chloride vapors, volatile material present in degreasers and solvents. Even without significant systemic effects, significant burns can occur. In very specific cases, and with methylene chloride ingestion, CO poisoning may occur as the liver metabolizes part of the inhaled methylene chloride to CO, storing a small part of the tissue that results in high levels of CO in the body, much higher than those recorded by direct ingestion of CO [98].
With the inhalation of CO, various harmful effects are triggered in the body, resulting in severe organ failure. The following diagram (Figure 13) highlights the main effects triggered in the respiratory system by the inhalation of fumes.
28
Figure 13 - Diagram of the sequence of events triggered by smoke inhalation [99]
Because CO rapidly oxidizes to carbon dioxide, existing guidelines for this pollutant focus on indoor air, since for outdoor air the attention will be drawn to carbon dioxide [75, 100, 101].
![Figure 1 - Map of the air quality index in Portugal (information for August 12, 2017) Adapted [5]](https://thumb-eu.123doks.com/thumbv2/123dok_br/18921272.937480/26.892.318.578.106.488/figure-map-quality-index-portugal-information-august-adapted.webp)
![Figure 3 - Air pollution sources and effects [13]](https://thumb-eu.123doks.com/thumbv2/123dok_br/18921272.937480/28.892.147.748.425.873/figure-air-pollution-sources-effects.webp)

![Figure 5 - Examples of maps of spatial distribution of SOx in continental Portugal for the years 2005 (a) and 2008 (b) [63, 64]](https://thumb-eu.123doks.com/thumbv2/123dok_br/18921272.937480/38.892.252.640.411.701/figure-examples-maps-spatial-distribution-continental-portugal-years.webp)
![Figure 6 - Lungs penetration of difference sizes of PM: Represents the areas where PM from incomplete combustion processes is deposited in the body [65]](https://thumb-eu.123doks.com/thumbv2/123dok_br/18921272.937480/41.892.189.705.657.1044/figure-penetration-difference-represents-incomplete-combustion-processes-deposited.webp)
![Figure 7 - Penetration of different-sized particles into the human body [68]](https://thumb-eu.123doks.com/thumbv2/123dok_br/18921272.937480/42.892.191.707.338.571/figure-penetration-different-sized-particles-human-body.webp)
![Figure 8 - PM size distribution [71]](https://thumb-eu.123doks.com/thumbv2/123dok_br/18921272.937480/44.892.192.703.106.421/figure-pm-size-distribution.webp)
![Figure 12 - Processes involved in acid deposition (source: Wikipedia) [89]](https://thumb-eu.123doks.com/thumbv2/123dok_br/18921272.937480/50.892.207.686.106.424/figure-processes-involved-acid-deposition-source-wikipedia.webp)
![Figure 13 - Diagram of the sequence of events triggered by smoke inhalation [99]](https://thumb-eu.123doks.com/thumbv2/123dok_br/18921272.937480/52.892.237.659.104.677/figure-diagram-sequence-events-triggered-smoke-inhalation.webp)
