Health Index applied to the city
of Araraquara, SP: an instrument
to accompaniment the Primary
Care
Índice de Saúde Aplicado ao
Município de Araraquara,
SP: um instrumento para o
acompanhamento da Atenção
Básica
Augustus Tadeu Relo de Mattos
IMaria do Carmo G. G. Caccia-Bava
IDébora Cristina Modesto Barbosa
III Department of Social Medicine, Ribeirão Preto Medical School, University of
São Paulo – USP.
II University of Franca – UNIFRAN
Responsabilidade individual dos autores:
Augustus Tadeu Relo de Mattos foi responsável pela concepção do artigo e por seu desenvolvi-mento a partir de revisão crítica de literatura apresentada, articulação teórico-metodológica apre-sentada, revisão crítica de conteúdo e aprovação inal do artigo.
Maria do Carmo G. G. Caccia-Bava foi responsável pela ampliação da revisão bibliográica acerca da temática e pela revisão crítica do conteúdo do artigo, auxiliando na articulação teórico-meto-dológica.
Débora Cristina Modesto Barbosa foi responsável pela revisão da literatura e pela organização das referências bibliográicas.
This is an original manuscript, which did not receive any funding and resulted from a Master’s de-gree dissertation. Authors declared no conlicts of interest. It was approved by the Research Ethics Committee under oicial expert opinion 183/ CEP-CSE-FMRP-USP.
Corresponding author: Augustus Tadeu Relo de Mattos. Departamento de Medicina Social, Fa-culdade de Medicina de Ribeirão Preto – USP. Rua Paschoal Bardaro, 2115, ap. 22 - Jardim Botâni-co, Ribeirão Preto, SP, BRAZIL, 14021-655. E-mail: [email protected]
Abstract
The improvement of the process of evalu-ation and monitoring of the Primary Care Attention has been yearned by the managers of the different spheres in the context of the Unified System Health - UHS. Thus, in the order to identify the conditions of the health assistance in the city of Araraquara/SP, ba-sed on the particular features presented in the inscribe areas of each unit of health. It was adopted by means of a composed indi-cator aiming to favor a broader view which contemplates the emergency of phenomena from a more including vision. It was used the methodology developed in the Index of Health of Drumond Jr, whose final value of the Index is gotten by the average of the values of the components of each health dis-trict. To the components originally adopted - Coefficient of Infant Mortality, Coefficient of Tuberculosis Incidence, Coefficient of Mortality by External Causes and Coefficient of Precocious Mortality by Chronic Diseases - was still added in this study, the Tax of Alphabetization and the Monthly Nominal Average Income of Responsible People for the Domiciles. The 24 Units of Health had been classified according to values obtained in the relation among its components. The results point intra-urban differentials in relation to the majority of the components and lower values for the Health Units loca-ted at the periphery of the city. Knowing this fact municipal administration is of funda-mental importance to progress in improving the process of evaluation of primary care in the county.
Resumo
O aprimoramento do processo de avaliação da Atenção Básica, compreendida como organizadora de todo o sistema de saúde e não apenas como um nível assistencial, vem sendo almejado pelos gestores do Sistema Único de Saúde. O presente trabalho buscou identificar aspectos da assistência à saúde no município de Araraquara/SP, valorizan-do as características particulares presentes na área de adscrição de cada unidade de saúde. Adotando um indicador composto aplicado a cada unidade de saúde, o es-tudo visou contemplar a emergência de fenômenos favorecendo uma visão mais abrangente de cada unidade e distrito sa-nitário em relação à Mortalidade Infantil, Incidência de Tuberculose, Mortalidade por Causas Externas e Mortalidade Precoce por Doenças Crônicas. Valeu-se da meto-dologia desenvolvida no Índice de Saúde de Drumond Jr, obtido pela média dos valores dos componentes de cada Distrito de Saúde para os indicadores acima, agre-gando, ainda, a Taxa de Alfabetização e Rendimento Médio Mensal do Responsável pelo Domicílio. As áreas de abrangência das Unidades de Saúde foram classifica-das segundo os valores obtidos na relação entre estes componentes. Os resultados apontaram diferenciais intraurbanos para a maioria dos componentes e revelou a presença dos piores valores nas Unidades de Saúde da periferia. O conhecimento dessa realidade pela gestão municipal é de fundamental importância para avançar no aprimoramento do processo de avaliação da Atenção Básica no município.
Palavras-chave: Avaliação em saúde.
Atenção primária à saúde. Indicadores básicos de saúde. Desigualdades em saúde.
Introduction
The development of the process of evaluation and monitoring of primary care actions, here understood as that which organizes the entire health system rather than being a health care level exclusively, has been the goal of managers from diffe-rent Sistema Único de Saúde (SUS – Unified Health System) sectors. As a management tool, this evaluation enables the laying of the foundation for planning new actions, correcting directions and improving pro-cesses so as to achieve the expected goals1.
According to Mendes2, the traditional
evaluation model can only be overcome with the incorporation of new variables, such as quality indicators and institutional forum decisions (such as regional and mu-nicipal health councils), used as powerful integration and implementation resources for municipal health policies. As a result, needs can be met and expenses can be ra-tionalized through effective social control. Primary care adopted the Primary Care Indicators Pact, launched in 1999, as an im-portant form of assessment. Currently, this incorporates the dimensions of the Health Pact, which is one of the main evaluation and follow-up instruments with a national scope, established from the negotiation of goals that represent the intention of mana-gers to improve health care quality3.
However, inequalities present in our society create differences – avoidable, sys-tematic and unfair – in the living and health conditions of individuals from the different districts of Brazilian cities and regions, which can be observed in the distribution of health problems. In this way, it can be concluded that the populations are not randomly dis-tributed in the different sectors of a city, but rather tend to group together in clusters that share relatively similar characteristics of a so-cial and economic nature. These differences create segregated spaces that routinely chan-ge life in these locations and, consequently, transform life in the city as a whole4.
evaluation index can enable a detailed analysis of health care in the area covered by Health Units, where data disaggregation based on the local reality allows the identi-fication of needs for different interventions among distinct areas, justifying priority in-vestments in those areas with more relevant social and health problems.
Minimum geographical disaggregation must be a commitment between obtaining an area which is sufficiently small to be ho-mogeneous and sufficiently large to provide an adequate number of events for analysis4
which can distinguish different needs. In this way, it is justifiable that epidemio-logical data analysis is disaggregated among sectors of a city, so that these differences can be considered in the formulation of policies compatible with intra-urban di-versity5, considering that social exclusion
is the impossibility of sharing the benefits produced by society, causing one to expe-rience deprivation, refusal, abandonment and expulsion.
This is not an individual process, althou-gh it reaches people, but rather a logic which is present in the several forms of economic, social, cultural and political relations. This situation of collective deprivation is what can be understood as social exclusion6,
which, according to the WHO World Report, derives from a social structure that creates inequalities which also affect health system inequalities.
The majority of health services, from hospitals to primary health units, have very distinct forms of providing health care, es-pecially in terms of quality, which results in inequality, particularly for those who need it the most7.
In the search for methodological inno-vations that can include the variety of con-ditions associated with health inequalities, researchers assume they could use a com-posite index that considers this plurality, evidencing the inequalities in a given area, and that helps to plan, monitor and assess health actions, guiding interventions so as to reduce these inequalities8.
A composite index is a measure that
associates different variables into a synthe-tic reference to analyze the characterissynthe-tics of population groups in certain geographical areas. Its composite nature enables the plurality of perspectives in its development9.
According to Mendes2, composite
indi-ces are instruments that enable phenomena occurring in specific geographical areas to be revealed, categorizing them into va-riables that reflect the material or social circumstances of a certain phenomenon expected to be analyzed. The distribution of the population in the urban space follows unequal patterns: on the one hand, there is the city’s periphery without urban infras-tructure and occupied by impoverished groups with low income and worse health conditions; on the other hand, there are areas with full access to urban facilities that are occupied by high-income groups with better health conditions4. An example
of a composite index is the Índice Paulista
de Vulnerabilidade Social (IPVS – State of
São Paulo Social Vulnerability Index), whi-ch enables a more accurate view of living conditions, geographically identifying the population segments that are more exposed to poverty and other vulnerability factors. Consequently, this index uses the socioe-conomic and family life cycle dimensions as its parameters10.
A study that considers inequality, social exclusion and quality of life from epidemio-logical data is not only a diagnostic, but also an intervention instrument. Thus, the pre-sent study is justified, aiming to analyze the health conditions of the city of Araraquara, in the state of São Paulo, in 2004, with the application of the Modified Health Index11.
Methods
A descriptive study was conducted in the city of Araraquara, in Southeastern Brazil, with the application of a new methodology, based on the Drumond Jr. Health Index11,
Mortality Coefficient due to Chronic Non-Communicable Diseases (MCCD) in the population aged between 20 and 59 years. The methodology used in the construction of the Human Development Index (HDI), a general, synthetic and composite index, was followed.
The following two new components were incorporated into the Drumond Jr. Health Index: Head of Household Literacy Rate (HHLR) and Head of Household Nominal Average Income (HHAI), resul-ting in a new index described as Modified Health Index (MHI). The choice for the inclusion of these two indicators was made to further characterize knowledge about the characteristics involved in the health-disease process, present in different regions.
The traditional population base is 1,000 live births for the CMC, while a population base of 100,000 individuals was used for the TIC, ECMC and MCCD.
Distance and discrepancy were calcu-lated to obtain the MHI. Distance is the measure between the value obtained for a Health Unit and the lowest value found for the city, whereas discrepancy is the difference between the highest and lowest values obtained for the city. Conceptually speaking, this relationship indicates where the actual situation of a certain area, covered by a Health Unit under analysis, stands in relation to the expected health condition goal for the city12.
According to Samohyl13, the distance can
be understood as the general amplitude of the data series (amplitude is a dispersion measure calculated as the difference betwe-en the highest and lowest values of a set of data) and discrepancy as the measure that seeks to establish a degree of approxima-tion to the concrete living condiapproxima-tions of a population in the different sectors of a city or region, translating this into quantitati-ve terms and showing the size of existing inequalities14.
The value of each component was ob-tained from the distance/discrepancy ratio. Thus, it was possible to construct a synthetic
index whose result aims to identify inequa-lities in the area studied14.
This formulation was applied to the six components previously mentioned, listed for each of the 24 Health Units, where the index value should be between zero and one. Consequently, the Health Unit with the worst situation was given a value of zero and that with the best situation was given a value of one for each of the six MHI components. The remaining Health Units were given intermediate values. Finally, the value attributed to the MHI was calculated as the arithmetic mean of values obtained for each of the six components.
The aggregation of these six components reflects the priority aspects of health policy, including certain economic and social aspects that, as a whole, aim to synthesize a reality that includes health and living conditions. It should be emphasized that this methodology is appropriate to compare intra-urban differences in a city, but not for the comparison between cities and regions. It enables one to observe, throughout the years, the performance or the mobility of the areas studied based on the interventions or changes made11. As proposed by Drumond
Jr., this study did not attribute different weights to indicators, because all of them included relevant health aspects.
which data were extracted. The place of stu-dy, the city of Araraquara, in the state of São Paulo, is the headquarters of the regional health management office, comprised of 25 cities for which it is a benchmark. This city is structured into three District Health Units and it is located in the center of the state of São Paulo, with an estimated population of 191,896 inhabitants in 2004. Its literacy rate was 94.8% in 2000. It should be emphasized that the existing records in the literature15,16
point to flaws in all stages of the informa-tion generainforma-tion process, from the system’s input to its use. The large number of deaths from ill-defined causes can exemplify the vulnerabilities of the mortality indicator information system. Approval was obtai-ned from the Research Ethics Committee and the City of Araraquara Department of Health. Data were subsequently collected from the Public Health Branch of the City of Araraquara Department of Health, between January and December 2004. In addition, data from the 2000 Census conducted by the
Instituto Brasileiro de Geografia e Estatística
(IBGE – Brazilian Institute of Geography and Statistics) were used.
Results
The following results obtained from each component analyzed are shown here to emphasize the fact that the distance/dis-crepancy ratio seeks to indicate where the actual status of a health unit under analysis stands, in relation to the expected goal of health condition for the city of Araraquara.
The Child Mortality Coefficient (CMC) was 9.78 deaths per 1,000 live births, thus showing a reduction when compared to the values found in the study by Mattos and Caccia-Bava17, which pointed to the
occurrence of 11.46 deaths per 1,000 live births in 2002. Among the health units of this city, there was a variation between zero and 29.85 deaths per 1,000 live births. A total of 2,277 births were taken into consideration to calculate the CMC in 2004.
The Early Mortality Coefficient due to Chronic Non-Communicable Diseases
(MCCD) was 100.7 deaths per 100,000 inha-bitants. Of all 265 deaths from Systematic Arterial Hypertension (SAH) and diabetes in the population aged more than 20 ye-ars, 100 occurred in the population aged between 20 and 59 years, of which 91 are associated with SAH and nine with diabetes. Of all 100 deaths, four occurred in the rural area population. The remaining 165 deaths occurred in those aged more than 59 years. The present study excluded deaths associa-ted with hypertension and diabetes mellitus occurring in the rural population, totaling four deaths among 6,984 inhabitants. These deaths were excluded because they were not formally registered with any of the 24 Health Units of the city of Araraquara, hindering the association of the events with specific units. Thus, a total of 96 deaths were considered to calculate this indicator, which corresponds to the total number of deaths from systemic arterial hypertension and diabetes mellitus. The ECMC was 51.59 deaths per 100,000 inhabitants, varying from zero to 109.7 deaths per 100,000 inhabitants. There was a total of 99 deaths from external causes, of which two were in the rural area and seven in ignored districts, as the City of Araraquara Department of Health’s information system could not associate these events with any health units.
The TIC was 30.22 cases of tuberculosis per 100,000 inhabitants. Among Health Units, such coefficient varied between zero and 90.7 cases of tuberculosis per 100,000 inhabitants. In the state of São Paulo, in 2004, this incidence was 45.9 cases per 100,000 inhabitants, according to the Alexandre Vranjac Epidemiological Surveillance Center18.
The HHAI showed values varying betwe-en R$ 302.89 and R$ 1,781.83 in the area of coverage of the 24 Health Units, according to the 2000 Demographic Census.
The distance/discrepancy ratio was applied to each study component to cal-culate the arithmetic mean among these components, obtaining MHI values for each Health Unit varying between 0.38 (worst performance) and 0.81 (best performance).
Discussion
Areas with small populations and, con-sequently, few deaths are susceptible to a great variation in mortality rates and other indicators, resulting from random fluctua-tions. These fluctuations can interfere with the results when short periods of time are
analyzed. Thus, the ranking of a certain area can be drastically changed from year to year, the reason why the absolute values of each component and their individual ranking were sought to be obtained before the synthesis of the MHI indicators could be shown.
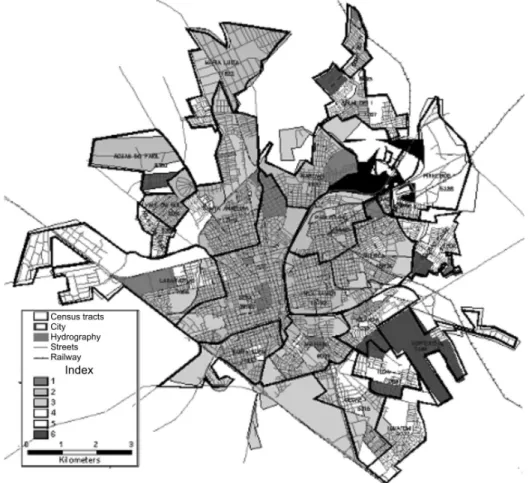
After the MHI methodology was applied, considering the six components adopted for the analysis, the final ranking of Health Units was obtained, as shown in Table 2 and its cartographic representation in Figure 1. Based on the results obtained, the following aspects can be initially used for reflection: among the 24 Health Units, 11
Chart 1 - Summary of catchment areas, their populations, the absolute values for each component and their classiication in the ISM, Araraquara, 2004.
Quadro 1 – Síntese das áreas de abrangência, as respectivas populações, os valores absolutos para cada componente e a respectiva classiicação no ISM, Araraquara, 2004.
Areas of coverage of
Health Units Population
Components and their respective absolute numbers*
MHI
DC NCTB EDCD DEC NLHH HHAI
SAH DIA
SESA 29,192 1 3 16 1 17 8,927 1781.83 1st
CMS PAULISTANO 14,645 0 2 4 0 3 3,958 1012.69 2nd
PSF B. ANDRADA 1,810 0 0 0 0 0 384 318.00 2nd
PSF BELA VISTA 834 0 0 0 0 0 170 438.00 3rd
PSF MARIVAN 6,237 0 0 2 0 4 1,798 729.39 4th
CMS S. ANGELINA 17,119 1 6 8 1 5 4,825 1127.84 5th
CMS SANTA LÚCIA 11,657 1 3 2 0 3 3,187 1037.98 5th
PSF VALE DO SOL 4,091 0 2 4 0 0 1,032 627.81 6th
CMS SELMI DEI IV 6,623 0 1 2 0 2 1,657 578.30 6th
CMS CECAP 5,315 0 0 2 0 5 1,343 626.65 7th
PSF HORTENSIAS 3,486 0 0 2 0 0 695 302.89 8th
CMS JD. AMERICA 15,624 2 4 4 0 9 3,988 734.66 9th
CMS JD. IGUATEMI 3,532 0 2 2 0 2 930 659.98 10th
CMS V. MELHADO 9,009 3 2 2 1 3 2,387 1038.16 10th
CMS LARANJEIRAS 7,068 1 4 2 1 4 1,846 875.08 11th
CMS VILA XAVIER 13,792 2 9 8 2 9 3,958 942.34 12th
PSF JD. PINHEIROS 5,228 0 1 2 0 3 792 577.54 13th
PSF MARIA LUIZA 1,822 1 0 2 0 1 434 602.14 14th
CMS Y. ÓPICE 7,030 3 2 6 1 4 1,648 596.46 15th
CMS SELMI DEI I 7,287 4 3 0 0 8 1,715 497.99 16th
PSF A. DO PAIOL 2,380 2 1 2 0 0 525 397.04 17th
PSF V. BIAGIONI 1743 1 1 1 0 1 469 503.20 18th
PSF IEDA 3,887 0 3 10 0 3 853 395.46 19th
CMS PQ.S. PAULO 5,509 1 5 6 0 4 1,240 494.35 20th
TOTAL 183,920 23 54 89 7 90 - -
-*DC – Number of deaths in children younger than one year, CNTB – Number of new cases of tuberculosis, EDCD – Number of early deaths from chronic diseases (deaths associated with Systemic Arterial Hypertension – SAH – and Diabetes – DIA – in the population aged between 20 and 59 years were taken into consideration here), DEC – Number of deaths from external causes, NLHH – Number of literate heads of household, HHAI – Heads of household average income
did not have child deaths and would, con-sequently, require a historical analysis of this indicator. In a similar study performed by Drumond Jr.19 in the city of São Paulo,
this component varied between 7.2 and 55.2 deaths per 1,000 live births. Important intra-urban differences were observed for this component, according to the areas of coverage of Health Units. Of the five Units with the poorest results, i.e. a CMC higher than 20 child deaths per 1,000 live births, four units were located in peripheral urban areas (PSF Águas do Paiol, CMS Selmi Dei I, PSF Maria Luiza, CMS Yolanda Ópice).
Additionally, 11 Health Units had child deaths, seven of which were Family Health Strategy Units. Aiming to make a more in--depth assessment of this coefficient, it should be taken into consideration that the population of the respective areas is small, justifying the importance of making comparisons throughout the years using this methodology.
By analyzing this indicator in a study that included seven cities of the state of São Paulo, Cruz20 observed that the
imple-mentation of the Family Health Program was one of the factors that contributed to
Chart 2 - Results obtained from the distance/discrepancy ratio for each component and classiication of the Health Units and their coverage areas in the Drumond Jr. Modiied Health Index, Araraquara, 2004.
Quadro 2 - Resultados obtidos a partir da relação distância/discrepância aplicada para cada componente e classiicação das Unidades de Saúde e respectivas áreas de abrangência no Índice de Saúde de Drumond Jr. Modiicado (ISM), Araraquara, 2004.
Areas of coverage of Health Units
Values obtained for the components of the modiied health
index** Modiied health
index
Final ranking
CMC TIC MCCD ECMC HHLR HHAI
SESA 0.81 0.88 0.73 0.46 1 0.98 0.81 1th
CMS PAULISTANO 1 0.85 0.75 0.81 0.48 0.93 0.80 2th
PSF B. ANDRADA 1 1 1 1 0.01 0.76 0.80 2th
PSF BELA VISTA 1 1 1 1 0.09 0.47 0.76 3th
PSF MARIVAN 1 1 0.71 0.41 0.29 0.96 0.73 4th
CMS S. ANGELINA 0.83 0.61 0.64 0.73 0.56 0.96 0.72 5th
CMS SANTA LÚCIA 0.68 0.71 0.8 0.76 0.50 0.85 0.72 5th
PSF VALE DO SOL 1 0.47 0.43 1 0.22 0.92 0.67 6th
CMS SELMI DEI IV 1 0.83 0.33 0.72 0.19 0.96 0.67 6th
CMS CECAP 1 1 0.67 0.14 0.22 0.93 0.66 7th
PSF HORTENSIAS 1 1 0.33 1 0 0.51 0.64 8th
CMS JD. AMERICA 0.68 0.71 0.73 0.47 0.29 0.83 0.62 9th
CMS JD. IGUATEMI 1 0.38 0.50 0.48 0.24 1 0.60 10th
CMS V. MELHADO 0.08 0.75 0.63 0.69 0.50 0.92 0.60 10th
CMS LARANJEIRAS 0.7 0.37 0.67 0.48 0.39 0.89 0.58 11th
CMS VILA XAVIER 0.63 0.28 0.71 0.4 0.43 0.94 0.57 12th
PSF JD. PINHEIROS 1 0.78 0.6 0.47 0.19 0 0.51 13th
PSF MARIA LUIZA 0 1 0.33 0.50 0.2 0.76 0.47 14th
CMS Y. ÓPICE 0.33 0.69 0.22 0.48 0.2 0.83 0.46 15th
CMS SELMI DEI I 0.1 0.54 1 0 0.13 0.81 0.43 16th
PSF A. DO PAIOL 0.21 0.53 0 1 0.06 0.64 0.41 17th
PSF V. BIAGIONI 0.58 0.36 0 0.47 0.14 0.87 0.40 18th
PSF IEDA 1 0.14 0.17 0.29 0.06 0.68 0.39 19th
CMS PQ.S. PAULO 0.73 0 0.4 0.33 0.13 0.68 0.38 20th
the reduction in child mortality rates in these cities. The areas with higher social vulnerability found with the IPVS for the city of Araraquara – SEADE21 coincide
with the areas of coverage with the poorest results for the child mortality component, pointing to the peripheral distribution of this event.
Although the IPVS adopts components that are different from those used by the MHI, both enable health sector dimensions to be made explicit in relation to wider social aspects. In this way, what is at issue is not proposing the adoption or exclusion of a benchmark over another, but rather their association to give a better picture of a given social reality which is complex and multi-faceted.
The TIC among Health Units varied between zero and 90.7 cases of tuberculosis
per 100,000 inhabitants. In the study con-ducted by Drumond Jr.19 in the city of São
Paulo, using the same methodology for this city’s Health Districts, such component va-ried from 32.5 to 113.5 cases of tuberculosis per 100,000 inhabitants. The following are among the Health Units with the six worst results, i.e. a TIC higher than 50 cases per 100,000 inhabitants: CMS Jardim Iguatemi, CMS Laranjeiras, PSF Biagioni, CMS Vila Xavier, PSF Ieda, and CMS Parque São Paulo. The areas covered by these four units are located in the city’s periphery and corres-pond to the IPVS map of areas with greater social vulnerability. A total of five out of the six units without tuberculosis cases were Family Health Strategy Units.
The MCCD was 100.7 deaths per 100,000 inhabitants. In the present study, it varied between zero and 100% among the areas Figure 1 -Mapping of the Synthesis of Components in order of Rating Units in Health Health Index Modiied for Drummond, Jr., second coverage area, Araraquara, 2004.
of coverage of Health Units, i.e. there were two Units where all deaths from systemic arterial hypertension and diabetes occurred in the population aged between 20 and 59 years. The study conducted by Drumond Jr.19
showed a variation for this coefficient from 7.2 to 55.2% among the health districts of the city of São Paulo. A total of 11 Health Units had coefficients higher than the mean value of the city in 2004, which also coincided with the IPVS map of areas with greater social vulnerability.
The ECMC was 51.59 deaths per 100,000 inhabitants. The present study showed
results between zero and 109.7 deaths per 100,000 inhabitants.
Findings from the study by Drumond Jr.19 in the city of São Paulo in 2004, which
used the same methodology, showed a variation among Health Districts between 32.7 and 101.8 deaths from external causes per 100,000 inhabitants. A total of 13 out of the 24 Health Units had ECMCs higher than the mean value of the city of Araraquara, of which 11 correspond to the city’s peripheral areas, which are those with greater social vulnerability according to the IPVS.
The city of Araraquara had a literacy rate
* The following categories were attributed to each index: 1 – no vulnerability; 2 – very low vulnerability; 3 – low vulnerability; 4 – average vulnerability; 5 – high vulnerability; and 6 – very high vulnerability.
*Sendo atribuídas a cada índice as seguintes classificações: 1 – Nenhuma Vulnerabilidade; 2 – Vulnerabilidade Muito Baixa; 3 – Vul-nerabilidade Baixa; 4 – VulVul-nerabilidade Média; 5 – VulVul-nerabilidade Alta; 6 VulVul-nerabilidade Muito Alta.
Figure 2 - Cartographic representation of the State Social Vulnerability Index for the urban area of Araraquara in 2000, modiied with overlapping coverage areas of health units in the year 2004.
of 94.8% in 2000 according to the IBGE. The results of the present study point to a varia-tion between 68.2 and 97.8% among Health Units. Despite the city’s good performance, it should be emphasized that there were im-portant differences when intra-urban areas were observed individually. Populations with a low level of education usually have poorer living conditions, as they encounter greater difficulties to obtain employment and health care, among other things. Consequently, vulnerability is expected to increase as the head of households’ level of education decreases21.
There were significant differences in HHAI varying between R$ 302.89 and R$ 1,781.83. The city’s per capita income in 2001 was R$ 441.8821. When this component
is taken into consideration, inequalities in this area were also followed by worse per-formances of the other study components, thus pointing to a close relationship among them. The importance of income for heal-th indicators is pointed out by heal-the WHO22
World Health Report, where the global tren-ds of child survival and in life expectancy are described. The increase in inequalities in income means greater inequality in child survival. This unequal growth pattern re-flects on the increasing disparities between healthier and less healthy individuals.
Additionally, the worst results for HHLR and HHAI coincided with the IPVS map of most vulnerable areas. When health-related variables were exclusively considered, there appeared to be no changes in performance in the comparison with the IPVS study, which used socioeconomic condition and family life cycle variables as components. A total of six out of the seven Health Units with the worst results in the study were found in the areas categorized between average and very high vulnerability. When the IPVS and MHI cartographic representations were overlapped, areas of coverage whose census tracts were ranked with values higher than 3 (i.e. 4, 5 and 6 – average, high and very high vulnerability) in the IPVS correspond to the city’s peripheral areas, where seven out of the eight Health Units with the worst
MHI rankings coincide with the most vul-nerable areas in the IPVS. The final results obtained from the Health Units in the MHI varied between 0.38 (worst performance) and 0.81 (best performance), showing the important differences in these units’ per-formance capacity in the sense of seeking health care equity. This is because Health Units have very distinct ways of providing health care, particularly in terms of quality, thus creating inequality, especially among those who most need it7.
Table 3 shows the comparison between the values obtained from the ranking of the area of coverage in the MHI and the ranking of the same area in the IPVS, in 2000.
The results found in the present study are in agreement with what has been pro-posed by Akerman8, who emphasizes the
relevance of problems encountered in cities not being approached individually to pro-duce results capable of providing answers to people’s needs. Mendes’ proposals2 go
in the same direction, pointing towards the need to use composite indicators that show intra-urban differences, taking into consi-deration the phenomena of interaction and synergism among the components used in the study and emphasized by the IPVS study. These results highlight Akerman8,
accor-ding to whom the use of composite indica-tors can be a strategy to show the differences in urban spaces, seeking needs, possibilities of solutions and paths to equalize such differences. Tobar et al.23 considered three
basic dimensions to reduce social inequa-lities: access to health services, equality in the provision of financial resources, and equality in the results, i.e. social classes must reach equal results regardless of their socioeconomic conditions. Equality is here understood as the overcoming of avoidable differences caused by social injustices.
Final Considerations
The present study focused on the analysis of the health conditions of a city in the rural area of the state of São Paulo, considering composite indicators and se-lecting epidemiological variables relevant for collective health, capable of revealing social and health aspects present in the disease-health-care process.
Each of the components used revealed patterns of health inequality where the worst results coincided with the city’s peri-pheral areas, which corresponded to those
with greater social vulnerability indicated by the IPVS.
The MHI is a composite indicator that enabled both the group analysis of its com-ponents and the individual assessment of each of them and per area of coverage of Health Unit, further approaching the local reality. This approach can enable a more accurate assessment of the risks inherent in health and the poverty to which individuals are exposed. This was possible through the use of health indicators that are powerful instruments in the monitoring and evalua-tion process to identify health inequalities Chart 3 -Comparison between the inal value obtained by each Health Unit in the Health Index and the Modiied classiication of census tracts within their areas of coverage in the Index of Social Vulnerability - IPVS, 2000.
Quadro 3 - Comparação entre o valor inal obtido por cada área de abrangência das Unidades de Saúde no Índice de Saúde Modiicado e a classiicação dos setores censitários das respectivas áreas de abrangência no Índice Paulista de Vulnerabilidade Social – IPVS, 2000.
Areas of coverage of Health Units
Modiied health index
Final ranking
Ranking of census tracts of the area of coverage
in the IPVS
SESA 0.81 1st 1, 2 and 3
CMS PAULISTANO 0.80 2nd 1 and 2
PSF B. ANDRADA*** 0.80 2nd
-PSF BELA VISTA*** 0.76 3rd
-PSF MARIVAN 0.73 4th 3
CMS S. ANGELINA 0.72 5th 2 and 3
CMS SANTA LÚCIA 0.72 5th 1, 2 and 3
PSF VALE DO SOL 0.67 6th 2 and 3
CMS SELMI DEI IV 0.67 6th 1, 2 and 5
CMS CECAP 0.66 7th 2, 3 4 and 5
PSF HORTENSIAS 0.64 8th 5 and 6
CMS JD. AMERICA 0.62 9th 2, 3 and 5
CMS JD. IGUATEMI 0.60 10th 3 and 4
CMS V. MELHADO 0.60 10th 1,2 and 3
CMS LARANJEIRAS 0.58 11th 1, 2, 4 and 5
CMS VILA XAVIER 0.57 12th 2 and 3
PSF JD. PINHEIROS 0.51 13th 3, 4 and 5
PSF MARIA LUIZA 0.47 14th 2, 3 and 4
CMS Y. ÓPICE 0.46 15th 2, 3, 4 and 5
CMS SELMI DEI I 0.43 16th 2, 3, 4, 5 and 6
PSF A. DO PAIOL 0.41 17th 2, 4 and 6
PSF V. BIAGIONI 0.40 18th 3
PSF IEDA 0.39 19th 4, 5 and 6
CMS PQ.S. PAULO 0.38 20th 1, 4, 5 and 6
***Nota: A presente classificação refere-se somente aos setores urbanos, as áreas assinaladas são áreas rurais as quais não são contempladas no IPVS.
among different areas.
When the impact of local and regional inequalities in health care and living condi-tions of individuals is evidenced, especially in Primary Care in its broadest sense, there is an emphasis on the understanding that different needs from distinct social groups have repercussions on the process of falling ill and dying of these groups and individuals.
It is believed that the effort made to sys-tematize and produce knowledge about this reality can become an immediate contribu-tion to the city of Araraquara, including not only this city’s Department of Health on its several management levels, but also health professionals and the active community who face the challenge of unequal health care on a daily basis.
Additionally, the use of this methodology can serve the realities of other cities or ser-vices, which will be able to take advantage of local and regional indicators through components that translate their reality, experience or need. Therefore, more subsi-dies will be available for them to reflect on the elements that result in different health care performances and to implement this proposal as a permanent evaluation and monitoring instrument in the areas of co-verage of their services.
The following were some of the limita-tions of the present study: to be conditioned
to the quality and accuracy of the available database; to have used a short period of time (one year) as reference; to not enable comparisons to be made among the results obtained from cities with different realities. Some of these limitations can be overcome with new and more specific studies, whereas others can be overcome with the formation and incorporation of a new evaluation approach.
As immediate recommendations to the municipal management, the following aspects stand out: the importance of more integration between social areas and inter--sectoral actions and partnerships; the de-velopment of the Family Health Strategy; and investments for the improvement of the information system, with the adoption of technological resources that enable one to work on information with the lowest level of data disaggregation possible, so that the understanding of the local reality is deve-loped and the social control of this reality is increased.
Another possibility that can arise from studies of this nature is that of serving as benchmark for the routine follow-up of performance results of different Health Units, by observing variations in the ranking of these services, as the changes in their different components are included.
References
1. Carvalho G, Rosemburg CP, Buralli KO. Avaliação de
Ações e Serviços de Saúde. Revista O Mundo da Saúde
2000; 24(1): 72-5.
2. Mendes EV. Organização da Saúde no Nível Local. 1ª ed.
São Paulo: Hucitec; 1998.
3. São Paulo. Secretária Estadual da Saúde. Coordenadoria de Planejamento em Saúde. Manual de Orientações para os Indicadores de Gestão. SP: SES: CPS; 2002.
4. Akerman M, Stephens C, Campanario P, Maia PB. Saúde e meio ambiente: uma análise de diferenciais intra-urbanos enfocando o Município de São Paulo, Brasil. Rev Saúde Pública 1994; 28(4): 320-5.
5. Berlinguer G. Ética da saúde. 2ª ed. São Paulo: Hucitec;
1996.
6. Sposatti A. Mapa da exclusão/inclusão social da cidade
de Santo André. Santo André: Pontifícia Universidade Católica de São Paulo; 2000.
7. Organização Mundial da Saúde, The World Health
Report 2008: Primary Health Care Now More Than Ever.
Organização Mundial da Saúde; 2008. 156p.
8. Akerman M. A construção de indicadores compostos para projetos de cidade saudáveis: um convite ao pacto
transetorial. In: Mendes EV (org.). Organização da Saúde
no Nível Local. 1ª ed. São Paulo: Hucitec; 1998. cap.1, p. 319-35.
9. Chiesa AM, Westphal MF, Kashiwagi NM.
Geoprocessamento e a promoção da saúde. Rev Saúde
10. Fundação Seade. IPVS. Espaços e dimensões da pobreza nos municípios do Estado de São Paulo. Região Administrativa Central; 2000.
11. Drumond M, Jr. Índice de Saúde. Coordenação de
Epidemiologia e Informação, Secretaria Municipal de Saúde do município de São Paulo; 2002.
12. Kaufman RA. Planificación de Systemas Educativos.
México: Tnllas; 1973.
13. Samohyl, R. Ferramentas Estatísticas de Qualidade. In:
Carvalho, MM. Gestão da Qualidade: teoria e casos. Rio
de Janeiro: Elsevier; 2005.
14. FAPESP. Projeto Dinâmica Social, Qualidade Ambiental e
Espaços Intraurbanos em São Paulo. FAPESP; 2000.
15. Almeida MF. Descentralização de Sistemas de
Informação e o Uso das Informações a Nível Municipal. IESUS 1998; VII(3): 29.
16. Moreira ML. Sistema de Informação de Saúde: A
Epidemiologia e a Gestão de Serviço. Saúde e Sociedade
1995; 4(1/2): 43-45.
17. Mattos ATR, Caccia-Bava MC. Repercussões da Implantação do Programa Saúde da Família no
Município de Araraquara: Impactos e Perspectivas. Rev
Bras Med Fam Com 2004; 1(1): 36-45.
18. São Paulo. Secretaria de Estado da Saúde. Centro de Vigilância Epidemiológica Alexandre Vranjac. Tuberculose em números; 2004.
19. Drumond M, Jr. Painel de monitoramento das condições
de vida e saúde e da situação dos serviços de saúde. Coordenação de Epidemiologia e Informação, Secretaria Municipal de Saúde do município de São Paulo; 2004.
20. Cruz MG. Estudo comparativo de alguns indicadores em municípios do Estado de São Paulo segundo a
implantação da Saúde da Família. Rev Esc Enferm USP
2005; 39(1): 28-35.
21. São Paulo. Secretaria de Estado de Economia e
Planejamento. IDH – Indicadores de desenvolvimento/2001
por municípios; 2001.
22. Organização Mundial da Saúde. The World Health
Report 2008: Primary Health Care Now More Than Ever. Organização Mundial da Saúde; 2008. 156p.
23. Tobar F, Montiel L, Gaya R, Martínez E. Modelos Equitativos de Distribución de Recursos Sanitarios. In:
Buitrago, RIR. La política de financiación de los sistemas
de salud y la equidad de género en el estado de salud. Tesis (Magíster en administración de salud). Pontificia Universidad Javeriana: Bogotá; 2005. 213p.