The architecture of firms’ innovative
behaviors
Research Memorandum 2013-29
Eric Vaz
Teresa de Noronha Vaz
Peter Nijkamp
1
The Architecture of Firms’ Innovative Behaviors
Eric Vaz1, Teresa de Noronha Vaz2 and Peter Nijkamp3
Abstract
During the last decades the amount of studies published about innovation systems has been massive, originating a great interest for policy makers in search for scientific background and technical support to find out the most adequate strategies for development. Although from different perspectives, studies point out knowledge creation and innovation, as the major drivers of change and growth. The consensus is broken, however, as soon as the complexity of innovation and knowledge are tackled: Innovation goes much beyond new product or process development due to its interactive nature, and knowledge surpasses the firms’ attributes because, frequently, it is a spatial endogenous characteristic.
The present paper is a contribution to the earlier discussion and represents an effort to develop a model able to answer how institutions are relating to each other, tracing networks of innovation.
The available database compromises an extensive set of Portuguese innovative firms, spatially identified and able to permit spatial connectivity to understand where and how strong are the links for innovation in Portugal and to analyze the respective level of concentration or dispersion. 1 Ryerson University, Department of Geography, Toronto, Canada 2 CIEO – Research Centre for Spatial and Organizational Dynamics, Faro, Portugal 3 VU University Amsterdam, Faculty of Economics and Business Administration, Amsterdam, the Netherlands
INTRODUCTION AND THEORETICAL FRAMING
The comprehensive systemic approach of innovation
During the last decades the amount of studies published about innovation systems has been massive, originating a great interest for policy makers in search for scientific background and technical support to find out the most adequate strategies for development. Although from different perspectives, studies point out knowledge creation and innovation as the major drivers of change and growth, the consensus is broken, however, as soon as the complexity of innovation and knowledge are tackled: Innovation goes much beyond new product or process development due to its interactive nature, and knowledge surpasses the firms’ attributes because, frequently, it is a spatial endogenous characteristic.
Scientists prompted a worldwide interest in the driving forces and socio-economic impacts of innovation and entrepreneurship (see Nijkamp 2009a, 2009b; Stimson et al. 2006) for which innovation has been a critical parameter of human intelligence and cognitive ability of human kind. Both factors are considered, nowadays, as the major drivers of socio-economic and technological change, able to stimulate the continuous production of new products or processes. To persuade society to continuously consume them requires a systematic and integrative combination of
knowledge assets managed within a framework of institutions, regulations, and some
kind of social cognitive mechanisms (Hall et al. 2005).
The trajectories of technological development
The complexity of the innovation system is structured under conditions related to
governance systems and respective spatio-temporal industrial organization and their
cognitive capacity. This argument calls for Schumpeter’s interpretation on the propensity of innovations to geographically group and generate clusters, encouraging innovation as a powerful instrument of growth. On this basis innovation and its factors became of crucial interest and tracing the complexity of governance systems one of the key vectors to explain the success of efforts to promote innovation. Countless efforts have been made to identify such factors: Some researchers adopted the resource-based
3
view of the firm by accepting the heterogeneous character of firms emphasizing their strategic behaviour (Knudsen 1995 and Noronha Vaz and Cesário 2008).
When knowledge became recognized as a key resource for firms and other economic agents, some authors demonstrated the essential role of linkages between industry and external research organizations for the successful transfer of technological knowledge among firms, later distended and referred to as the Triple Helix concept, a triangular interaction between the research community, governments and industries seen as the solution to successful innovation (Doloreaux (2005)
As linkages among institutions became long lasting and consistently robust, it became possible to addresses the consequential configuration in forms of networks
and/or industrial clusters. In effect, a great variety of studies on clustering were
influential in describing how and why institutions get together to react to competitive pressures. Westlund and Bolton 2006, for example, described clusters as geographical space with normative isomorphism, “where managers and decision makers follow
similar values, cognitive references, perceptions, and experiences therefore with propensity to connect and pursue analogous patterns of organizational behaviour”.
In such a context, the concept of Regional Innovation Systems (RIS) was introduced as “a network of organizations, institutions and individuals, within which,
the creation, dissemination, and exploitation of new knowledge and innovation occurs”
(Cooke et al. 2004), influencing the perception of the dynamics of clustering and admitting that for a given national or regional economy, technological and industrial development takes place following certain trajectories determined by spatial systems traced by groups linked firms, research organizations, policy institutions, government authorities, and financial actors (Teigland and Schenkel 2006).
Networking, the strategic choices of firms and the spatial impacts
Basically, the previously pointed out structures when observed from a global perspective, tend to outline long-lasting technology trends that could, among others help explaining the difficulties in reducing the different growth capacities among countries and regions. In general, the causes for this diverse behaviour and the propensity to have
a cyclic nature of disadvantages in many lagging parts of the world have attracted the attention of many researchers and policy makers since a long time (Hall and Wee, 1995 and Landabaso, 1997).
As proved by the Italian School founded by the GREMI group (Camagni, 1991, 1995a, 1995b) and, later on, by many other northern European researchers, such as Asheim and Isaksen (2003), there is a direct contribution of individual firms or even
of industrial clusters to foster regional growth. Such has been even more emphasized
in the research related to spillover-effects, developed by Kaiser, 2002 and Fischer, 2006. But yet, much stays unsolved:
Fuzzy concepts related to the definition of firms’ environment. Either from the geographical or from the geometrical perspective, the market area each firm and its dominant role vary in function of its nature.
Teigland and Schenkel, 2006, argue that the firm’s environment should be defined by those agents involved in the historical path-dependent development of skills.
Other authors propose that the firm’s environment is mostly responsible for all those strategic interactions that contribute to productive links within the firm’s industrial structure.
Sure is that firm’s environment is highly influenced by the nature of the involved public institutions and their regulations as they may help or obstruct interactions.
Assuming that the firms environment is formed, and shaped coherently by the presence of significant linkages. Sometimes, and assuming that, in spite of uncertainty, the firms face future new needs of resources and clients, cluster formations are still emerging. In this case, it becomes important to detect if the strategic decision of firms is internally or externally driven: Langlois and Robertson (1995) first developed the idea that many questions related to firm strategy and firm boundaries are correlated. As assessed by Freel (1998), not much is understood on how technologically innovative firms grow, learn or adapt to transformations taking place in their environments: i. Will the strategic choices be solved by firms using market solutions? ii. And if so, through which decision-making process?
5
Frequently, innovative firms accumulate knowledge through learning, as a process to reduce uncertainty and not necessarily to get economies of scale. Therefore, facilitating the better decision, knowledge acquisition could engage the entrepreneur in strategic learning – an occasion to absorb economies of scope rather than scale. Thus, the routines of innovative firms are different from those of their non-innovative partners.
Empirical studies often underline the role of the firms’ environment as the local context within which firms develop their activities (Keeble, 1997 and Freel, 1998) in and interactive mode between the parts and the set (Noronha Vaz et al., 2004) and proving that organizational learning and institutional networking combine to boost the performance of innovative firms (Fagerberg, 2003).
Occasionally, firms find possible solutions in specific networks for technological learning through external sources and manage interfaces which help them to combine sources of technical know-how, information and relations (Stough et al., 2007). In such cases, firms may also be organized in institutional local networks.
MEASUREMENTS OF FIRMS’ INNOVATIVE BEHAVIOR AT A REGIONAL CONTEXT
At the same time that innovation and entrepreneurship were accepted as major factors of growth, the measurement of innovative activities received much scientific and public attention. However, the measurements related to this systemic concept still remain in progress. Since the 1990s, statistical surveys have supplied data concerning proxies such as R&D expenditures and number of patented inventions, for example. Sometimes such proxies were improved by adding up employment in R&D related activities or other data of similar kind but so far it cannot be confirmed that an unambiguous direct measure of innovation outputs is consensual.
Because the market structure influences the innovative activities and the extent to which technological change has an impact on the size distribution of firms, great part of the research done are of empiric nature and mostly related to advanced industrial countries. Rarely studies have observed rural or lagging areas (Noronha Vaz et al.,
2004). The debate already started up in 1991 by Acs and Audresch, 1991, invariably points out that there are considerable ambiguities and inconsistencies in the results of empirical studies directly relating R&D or patents to innovation and even more extensively in less favoured areas.
Innovation output indicators have been defined having as reference the total
number of innovations. Kleinknecht and Bain (1993) proposed several methods for collecting data: postal surveys for self-assessment by managers of their innovations or literature-based counting of innovations (in trade journals). Both these methods helped to highlight the issues, indicating related ways to work towards general inquiries. Applied in different countries, the first method in Great Britain, Norway, Denmark, Germany and the Netherlands and the second one in United States, the Netherlands and Ireland these methods proved to be quite subjective, making a scientific consensus difficult for the general use of the scientific community.
The European Community Innovation Survey (CIS), implemented by EUROSTAT to collect firm-level data on inputs to and outputs of the innovation process across a wide range of industries and across European member-states and, occasionally, across regions, finally a great toll facilitated in the progress of comparative analyses of innovativeness across firms, regions and nations. CIS has its limits but provides evidence of the actual composition of inputs engaged by the firms for implementing technological change: In terms of expenditures committed in the EU to innovative activities, formal R&D in labs corresponds to only 41% of the total, while product design costs represent 22%, and in trials, tooling up and training there are about 27% invested.
Also, at macro-level, data suggests that firms are job creators and engines of economic growth. However, such statements do not help to produce enough scientific evidence on the precise role that firms play in the growth mechanisms. Within the context of a learning economy, all enterprises have to adapt their technology to new standards of distribution and to logistic channels and in particular when included in an environment of large competition. There, all categories of enterprises, which may belong to different regional or local innovation systems, are interacting and competing
7
for innovative and market activities, using the same tools and the same knowledge flows (Lester, 2006).
In our opinion, regional or local innovation systems result from historical, path-dependent processes, with high degrees of institutional and organizational specificities –
the technological regimes. Firms are embedded in a technological regime and are
defined by the level and type of opportunities for innovations, by the accumulation of technological knowledge, and by the means of knowledge transmission. The examination of the technological regime of an industry allows some predictability about the kind of enterprises which may innovate, because of the possibilities for protecting innovations, the strength of a dominant design, the nature and the continuity in the learning processes, and the tacitness of knowledge and the means for its transmission.
The above theoretical framing suggests that regional imbalances should be studied by means of a better understanding of the regional firms’ capacity to dynamically innovate. The fact that such capacity may be quantitatively addressed and analysed helps to support the argument even further. Consequently, a key question for further investigation is to detect firms’ innovation patterns, sorting out their structures and handle them as facilitators of regional or local growth, eventually development.
1. A mesoeconomic Model to evaluate the structures of innovation
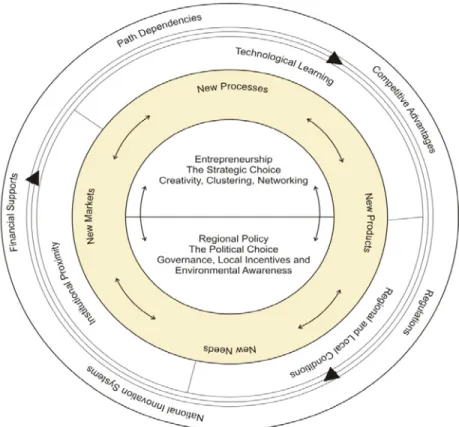
A multilevel model able to improve the analytical tools is required for better understanding the complexity expressed by all the determinants of knowledge and innovation outlined earlier. Figure 1 supplies the model for which knowledge assets are circulating simultaneously between the micro- and macro-levels of economic activity:
An exterior cycle represents the global conditions for change, in general mostly related to the macroeconomic conditions for growth such as GDP, employment, taxes, rates of interest, investment climate, inflation;
The intermediary cycle, however, reproduces the knowledge diffusion taking place at the mesoeconomic where institutional relationships occur: Institutional proximity, technological learning and regional or local conditions:
There is a permeable boundary between the previous cycle and the next, interior one. Economic effects cross this boundary in relevant issues associated to
organizational management (entrepreneurship, strategic choices, creativity, clustering and networking) and regional policy, (political choices, governance, regulation and environmental awareness) determining an interior cycle which embodies knowledge application that may end in new products and processes. The core of the cycle illustrates a sharp microeconomic component confined to aspects such as market competition, costs, prices and marketing issues – they are the last facilitators of the success of new products and processes.
Figure 1. The knowledge circuit
Source: Noronha Vaz and Nijkamp (2009)
In this paper we concentrate our attention exclusively at the intermediary cycle, the mesoeconomic level. Our goal is to model the almost chaotic, eventually frenetic, state of relationships occurring among institutions, happening as result of the three vectors: proximity, learning and cooperating when in presence of regional or local
9
We assume that firm’s proximity can be detected by a GIS application to a statistically significant sample of institutions, if possible, tracing their interaction with others actors belonging or not to the same sample. Learning and cooperating (measured as technological learning) and external conditions to interact are variables obtained by means of direct approach to institutions, either using questionnaires or by consulting the respective web-sites and with application of content analyses for the obtained primary data. In the next Figure 2, a model proposition for measuring firms’ innovative behaviour is provided, for which spatial, institutional and environmental conditions combine.
Figure 2. Firms’ innovative behaviour model (FIBE)
1.1. Application of FIBE
Our investigation applies the previous model (FIBE) to an extensive set of Portuguese private and public institutions detected by their Webpage contents on innovation: 820
Internet sites have been detected and interpreted, giving place to a filtered sample of 623 institutions (which have been considered to be able to provide reliable data through the respective websites). These institutions were classified into nine groups, each characterized by ten variables.
The selection of the variables was based on earlier developed research work (more details in Noronha Vaz and Nijkamp, 2009, for the theoretical basis, and Vicente et al., 2010, for the measurement methods). The various constructed variables are assumed good proxies of factors favouring innovation and are identified as attributes of
innovation. To follow our mesoeconomic model assumptions, these attributes (defined
as variables in the model) have been grouped (as in Figure 2) in:
Variables for technological learning: Application of external technologies (AET); Promoting knowledge (PK); Studying process (SP); Promoting R&D (PRD); New product development (NPD);
Variables for improving conditions to interact: Managing (Mg); Knowledge transfer (KT); Support to entrepreneurship (SE); Promoting partnership and cooperation (PPC); Orientation (Or).
As grouping factors the following institutions, actors of innovation, have been considered: governmental agencies, associations, technological parks and science centres, R&D organizations, entrepreneurship support entities, technological schools, university interfaces, financial institutes – as well as venture capitalists or high risk investors and, finally, other institutions.
As pointed out in the theoretical model, a third group of variables was built to evaluate proximity. Those resulted from Geo-coding each innovative institution4 and respective links to other institutions with whom each institution had kept cooperation (from first to the fifth connection) of any sort for the considered period of time. All the variables have been worked out by use of two different but complementary methodologies: BIPLOT and SPATIAL CONNECTIVITY. The results have been submitted to separate analyses and discussed in different contexts. The observed time period was the year 2006, so that the analysis has a static-comparative nature.
11
1.2. The methods
1.2.1. The BIPLOT analyses
The information used in our analysis was organized in an IxJ binary data matrix obtained from several innovation attributes, in which the I rows correspond to the above-mentioned 623 units (18 governmental entities, 297 companies, 70 associations, 20 technological parks and centres, 58 R&D organizations, 48 entrepreneurship support entities, 12 technological schools, 80 university interfaces, and 14 other entities) and the J columns correspond to the above-mentioned 10 binary innovation characteristics scored as binary variables, viz. present or absent: (PK), (SP); (Mg); (PRD); (KT); (SE); (NPD); (PPC); (AET); (Or).
The applied algorithm was described in Demey et al., 2008. In Annex 1, we go into the detailed procedure to get the External Logistic Biplot based on a Principal Coordinates Analysis, and in a second step of the algorithm, adjusting a logistic regression model for each variable as illustrated in Figure 3.
Figure 3. Steps for external logistic biplot Source: Vicente et al., 2010
The geometric results represent the principal coordinate scores in a map where the regression coefficients act as vectors indicating the directions that best predict the probability of presence of each variable.
According to the geometry of the linear Biplot for binary data as Vicente-Villardón et al., 2006, each variable is represented as a direction vector through the origin. For each variable, the ordination diagram can next be divided into two separate areas predicting presence or absence, while the two areas can be separated by a line that is perpendicular to the characteristic vector in the Biplot and cuts the vector at the point predicting a 0.5 probability.
The characteristics associated with the configuration are those that predict the respective presences adequately. Once the coordinates of the points which represent the entities (in our case the institutions) in the plane are obtained by the External Logistic Biplot, we can apply a K-Means analysis to identify the centroids of the resultant clusters. To produce an elegant solution, we may present a Voronoi diagram of the spatial relationships.
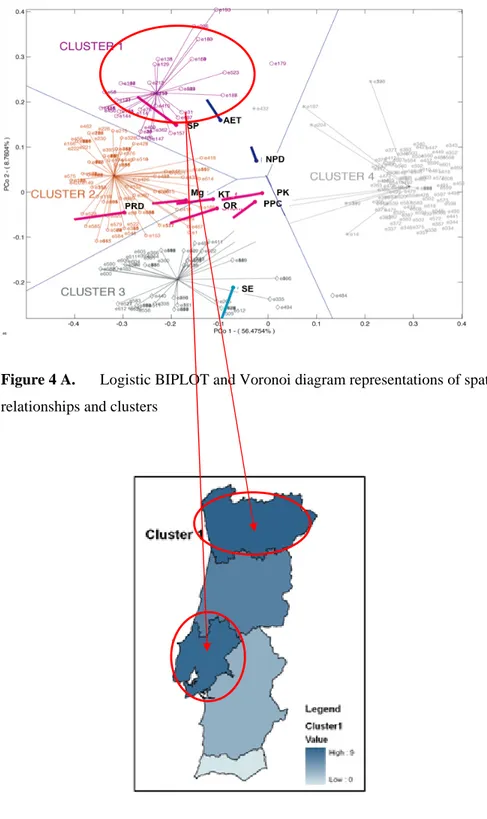
The above described method was applied to our sample, thus eventually indicating the existing force field of the Portuguese innovation system. Figure 4A represents a Voronoi diagram of the existing spatial relationships. Four well defined clusters can be detected, each characterized by the presence or the absence of the different sets of variables. Cluster 1 is characterized by the presence of SP, AET, and NPD and absence of SE; Cluster 2 is characterized by the presence of PK, PPC, OR, KT, Mg and PRD, and absence of SE; Cluster 3 is characterized by the presence of SE, PK, PPC, OR, KT, Mg and PRD and absence of NPD, AET and SP. Cluster 3 is characterized by absence of all the indexes of innovation. By the characteristics of the firms, Cluster 1 has been identified as the one comprehending the largest number of firms, therefore the most innovative one. Figure 4B represents the regional distribution of firms of Cluster 1 for the country, showing that it is mostly represented in the region of Lisbon and Norte.
The application of this method can be extended to different observation levels, including the regional or the local level. If the provided databases are at national level and location is a variable as it should be the case, it is possible to reach the local level.
13
In such case the number of observations should be sufficient for the statistical application. As this is not always the case, in particular inside peripheral regions, the thickness of the entrepreneurial tissue constitutes the first major obstacle to the use of FIBE.
Figure 4 A. Logistic BIPLOT and Voronoi diagram representations of spatial relationships and clusters
15
1.2.2. Spatial connectivity
Spatial information has enabled the possibility to understand the relations over space of different types of features (Jankowski, 1995). The spatial properties of location of activities and respective impacts are still far from being completely understood, and have developed into a complex integration of economics, mathematics and geography. A reason for this is the underlying complexity of the spatial patterns formed (Gustafson, 1998), and the connectivity established among the different agents in a complex network of interactions over space, traditionally studies in Ecology (Moilanen and Hanski, 2002).
The possibility to merge the configuration of features with networks may be assessed elegantly through generating a network which connects spatial information of features. The connectivity of features in space, allows understanding and fostering the dynamics of collaborations of innovation from a spatial perspective. This was achieved by converting the provided street addresses of the businesses into a point vector in space. The address is categorized into its locational determinants entailing its street number, street name, and postal code. This was then added into ArcGIS 10.1 where the process of spatial connectivity – correspondent to the transformation of the address into a point – was carried out. The geocoded addresses were than exported into Google Earth, to match the consistency of the location through attribute properties of the surrounding area, as well as confirmation of metadata related to the geocoded feature.
In our precise case all the institutions belonging to Cluster 1, assumed to be the most innovative one were investigated and the respective links reported till the fifth connection – considered at any geographical level (local, national or international). Because several institutions had no reported links, the sample that was used for the mapping was reduced to 37 institutions in a total of 65 point features. The point features were than aggregated into groups corresponding their partners, defining of 15 aggregated groups. These groups of points were then connected by relevance of indicated partners, allowing establishing a spatial understanding of small networks with spatial connectivity. The points thus, were then converted into line segments and projected accordingly on the map.
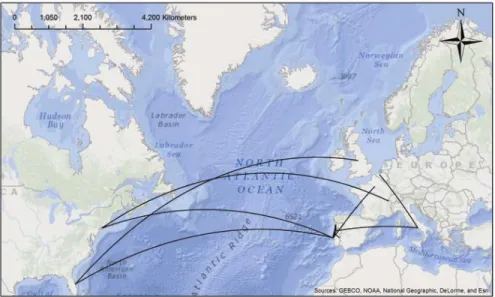
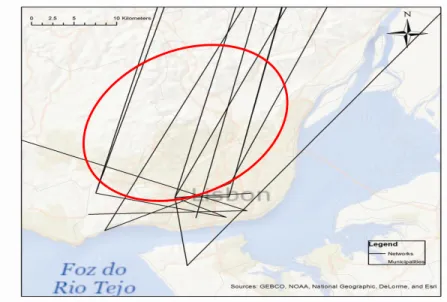
Figures 5, 6 and 7 define the connections found at different scales: global, national and local and report to the 50 most innovative institution in Portugal, all included in Cluster 1 and considered to be the most innovative in the country. Only a few relations are pointed out to exist between the spatial component of countries and business innovators. In fact, most of the relations even at national level are formed only above the Tejo valley, being Lisbon and Porto the main hubs for partnerships.
17
Figure 7. Details of connections in Lisbon area
2. FIBE Model results
By detecting the types of patterns of structures of innovation in Portugal, many advantages and fragilities may be identified and clearly interpreted from a mesoeconomic perspective:
FIBE delivers a combined method able to evaluate the kind of connections underlining the innovation taking place at a certain region or country;
In our particular case – the application for Portugal - we can confirm the asymmetric flow distribution resulting from the connections from the most innovative institutions, which have based their innovation above all on the study of processes (SP), on the use of external technologies (AET); and on new product development (NPD);
The asymmetric distribution shows predominant flows concentrated in Lisbon area and Oporto (in this case much less intensively) that occasionally extend across Europe or to the USA. When observing the connections at country level, we may find two hubs and a small focal point in Centro Region. The method permits to pick up the individual institution responsible for this flow, searching for its innovative prospects.
Contrarily to what was expected, not many connections start in the same point in the Lisbon region. This indicates that different institutions are able
19
to sustain their own innovation paths in a structure that although still not very complex or elaborated defines inter-connections at an elaborated level.
CONCLUSION
The addressed model is able to offer multiple advantages to access the performance of companies by its leaders and policy makers.
Leaders of companies or other institutions can compare their individual profiles, reproduced in a geometrical location, with that of the system average by using a simple tool, concluding whether or not they should reinforce specific measures to improve their relative positioning – this may be done by looking for a more rigorous use of the missing attributes, for example.
Also for policy makers and planners FIBE could become a powerful tool. As pointed out, this study confirms the need to implement tailor made policies to endorse innovation at regional level. Such is only possible when identifying the specific choice of attributes used by the set of companies and others institutions. The pattern they define to innovate may suggest those specific measures required to act directly on each described attribute contributing to a new concept of intervention – the regional
cluster-architecture, to help focus policies for regional development.
The examination of flow designs recommends that the emergence of innovation is also a result of the flow intensity which submits the innovation processes as a spatial determinant. Therefore, major general policies to promote it will not be able to be entirely efficient if flows design is not considered. Resulting paths should be able to create some sort of path dependency; in this case, the efficiency of promoting policies in such environments should tend to increase. The contrary is to expect when no flow design emerges in the regions.
REFERENCES
ACS, Z. J. and AUDRETSCH, D. B. (1991), Innovation and Technological Change. An
ASHEIM, B. T. and ISAKSEN, A. (2003), ‘SMEs and the regional dimension of innovation’, in: Ascheim et al. (eds) Regional Innovation Policy for Small-Medium
Enterprises, Edward Elgar, Cheltenham, 21-46.
AUDRETSCH, D.B., KEILBACH, M.C. and LEHMANN, E.E. (2006), ‘Entrepreneurship and Economic Growth’. Oxford University Press, Oxford.
CAMAGNI, R. (1991), ‘Introduction: from the local milieu to innovation through corporation networks’, in: Camagni, R. (ed), Innovation networks: spatial perspectives, Belhaven Press, London and NewYork, 1-9.
CAMAGNI, R. (1995a), ‘Espace et temps dans le concept de milieu innovateur’, in: Ralllet, A. and Torre, A. (Eds.), Économie Industrielle et Économie Spatiale, Economica, Paris, 193-210.
CAMAGNI, R. (1995b), ‘Global network and local milieu: towards a theory of economic space’, in: Conti, S., Malecki, E. and Oinas, P. (eds), The Industrial
Enterprise and its environment: Spatial Perspectives, Avebury, England, 195-213.
COOKE P., BRACZYK, H.I., HEIDENREICH, M. (Eds.) (2004). Regional Innovation
Systems: The Role of Governances in a Globalized World, 2nd Edition, Routledge,
London.
DOLOREUX, D. and PARTO, S. (2005) Regional Innovation Systems: Current discourse and unresolved issues, Technology in Society (27), 133-153.
FAGERBERG, J. (2003), ‘Schumpeter and the Revival of Evolutionary Economics: an Appraisal of the Literature’, Journal of Evolutionary Economics, 13, 125-59.
FREEL, M. (1998), ‘Evolution, innovation and learning: evidence from case studies’,
21
GUSTAFSON, E., 1998, Quantifying Landscape Spatial Pattern: What Is the State of the Art?, Ecosystems, 1(2): 143-156
HALL, R. and WEE, M. (1995), ‘The Regions in a Enlarged Europe’, in: Hardy, S., Hart, M., Albrechts, L. and Katos, A. (Eds.), An Enlarged Europe. Regions in
Competition? Regional Policy and Development, 6. Jessica Kingsley Publishers and
Regional Studies Association, London, 8-21.
JANKOWSKI, P. (1995), Integrating geographical information systems and multiple criteria decision-making methods, International Journal of Geographical Information Systems, 9(3): 251-273.
KEEBLE, D. (1997), ‘Small Firms, Innovation and Regional Development in Britain in the 1990s’, Regional Studies, 31, 3, 281-293.
KLEINKNECHT, A. and BAIN, D. (1993), New Concepts in Innovation Output
Measurements, St Martin’s Press, New York.
KNUDSEN, C. (1995). Theories of the Firm, Strategic Management and Leadership, in: C. Montgomery (ed.), Resource-Based and Evolutionary Theories of the Firm, Kluwer, Boston, pp. 179-217.
LANDABASO, M. (1997), ‘The Promotion of Innovation in Regional Policy: Proposals for a Regional Innovation Strategy’, Entrepreneurship & Regional Development, 9, 1, 1-24.
LANGLOIS, R. N. and ROBERTSON, P. L. (1995), Firms, Markets and Economic
Change, Routledge, London & New York.
LESTER, R. (2006), ‘Prospects for Local Innovation Systems’, Paper presented at a seminar held in September 2006 at the Department of Economics, National University of Ireland, Galway.
MOILANEN, A. and HANSKI, I., On the use of connectivity measures in spatial ecology, Oikos, 95(1): 147–151.
NIJKAMP, P. (2009a). E Pluribus Unum, Region Direct, vol. 2, no. 2, pp. 56-65.
NIJKAMP, P. (2009b). Regional Development as Self-Organized Converging Growth,in: G. Kochendorfer and B. Pleskovic (Eds.), Spatial Disparities and
Development Policy, World Bank, Washington DC, pp. 205-282.
NORONHA VAZ, T. (2004), ‘The environmental context for small firms in the EU’, in: Noronha Vaz et al (Eds.) Innovation in Small Firms and Dynamics of Local
Development, 13-31.
NORONHA VAZ, T., CESÁRIO, M. (2008). Driving Forces for Innovation: Are They Measurable? International Journal of Foresight and Innovation Policy, 4, 1-2, 30-50.
NORONHA VAZ, T., NIJKAMP, P. (2009). Knowledge and Innovation: The Strings between Global and Local Dimensions of Sustainable Growth, Entrepreneurship and
Regional Development, vol. 21, no. 4, pp. 441-457.
STIMSON, R., STOUGH, R., ROBERTS. B. H. (2006). Regional Economic
Development, Springer, Berlin.
TEIGLAND, R. and SCHENKEL, A. (2006), ‘Exploring the Role of Communities of Practice in Regional Innovation Systems’, in: Coakes, E. and Clarke, S. (eds.) The
Encyclopaedia of Communities of Practice. In Information and Knowledge Management, Hersley, Idea Group.
VICENTE, P., NORONHA VAZ, T. and NIJKAMP, P. (2010), ‘Institutional Capacity to Dynamically Innovate: An Application to the Portuguese Case’, Technological
23
WESTLUND, H., BOLTON, R. (2006). Local Social Capital and Entrepreneurship.
Small Business Economics, vol. 21, no. 2, pp. 77-113.
Websites:
Community Innovation Survey (CIS),
http://epp.eurostat.ec.europa.eu/cache/ITY_OFFPUB/KS-EM-08-001/EN/KS-EM-08-001-EN.PDF
Yao-Hua Tan
2009-2 Marc D. Bahlmann Marleen H. Huysman Tom Elfring
Peter Groenewegen
Global Pipelines or global buzz? A micro-level approach towards the knowledge-based view of clusters, 33 p.
2009-3 Julie E. Ferguson Marleen H. Huysman
Between ambition and approach: Towards sustainable knowledge management in development organizations, 33 p.
2009-4 Mark G. Leijsen Why empirical cost functions get scale economies wrong, 11 p.
2009-5 Peter Nijkamp Galit Cohen-Blankshtain
The importance of ICT for cities: e-governance and cyber perceptions, 14 p.
2009-6 Eric de Noronha Vaz Mário Caetano Peter Nijkamp
Trapped between antiquity and urbanism. A multi-criteria assessment model of the greater Cairo metropolitan area, 22 p.
2009-7 Eric de Noronha Vaz Teresa de Noronha Vaz
Peter Nijkamp
Spatial analysis for policy evaluation of the rural world: Portuguese agriculture in the last decade, 16 p.
2009-8 Teresa de Noronha Vaz
Peter Nijkamp
Multitasking in the rural world: Technological change and sustainability, 20 p.
2009-9 Maria Teresa Borzacchiello Vincenzo Torrieri Peter Nijkamp
An operational information systems architecture for assessing sustainable transportation planning: Principles and design, 17 p.
2009-10 Vincenzo Del Giudice Pierfrancesco De Paola Francesca Torrieri Francesca Pagliari Peter Nijkamp
A decision support system for real estate investment choice, 16 p.
2009-11 Miruna Mazurencu Marinescu
Peter Nijkamp
IT companies in rough seas: Predictive factors for bankruptcy risk in Romania, 13 p.
2009-12 Boriana Rukanova Helle Zinner Hendriksen Eveline van Stijn Yao-Hua Tan
Bringing is innovation in a highly-regulated environment: A collective action perspective, 33 p.
2009-13 Patricia van Hemert Peter Nijkamp Jolanda Verbraak
Evaluating social science and humanities knowledge production: an exploratory analysis of dynamics in science systems, 20 p.
Peter Nijkamp Norbert Schanne
2009-15 André de Waal Karima Kourtit Peter Nijkamp
The relationship between the level of completeness of a strategic performance management system and perceived advantages and disadvantages, 19 p.
2009-16 Vincenzo Punzo Vincenzo Torrieri Maria Teresa Borzacchiello Biagio Ciuffo Peter Nijkamp
Modelling intermodal re-balance and integration: planning a sub-lagoon tube for Venezia, 24 p.
2009-17 Peter Nijkamp Roger Stough Mediha Sahin
Impact of social and human capital on business performance of migrant entrepreneurs – a comparative Dutch-US study, 31 p.
2009-18 Dres Creal A survey of sequential Monte Carlo methods for economics and finance, 54 p.
2009-19 Karima Kourtit André de Waal
Strategic performance management in practice: Advantages, disadvantages and reasons for use, 15 p.
2009-20 Karima Kourtit André de Waal Peter Nijkamp
Strategic performance management and creative industry, 17 p.
2009-21 Eric de Noronha Vaz Peter Nijkamp
Historico-cultural sustainability and urban dynamics – a geo-information science approach to the Algarve area, 25 p.
2009-22 Roberta Capello Peter Nijkamp
Regional growth and development theories revisited, 19 p.
2009-23 M. Francesca Cracolici Miranda Cuffaro Peter Nijkamp
Tourism sustainability and economic efficiency – a statistical analysis of Italian provinces, 14 p.
2009-24 Caroline A. Rodenburg Peter Nijkamp
Henri L.F. de Groot Erik T. Verhoef
Valuation of multifunctional land use by commercial investors: A case study on the Amsterdam Zuidas mega-project, 21 p.
2009-25 Katrin Oltmer Peter Nijkamp Raymond Florax Floor Brouwer
Sustainability and agri-environmental policy in the European Union: A meta-analytic investigation, 26 p.
2009-26 Francesca Torrieri Peter Nijkamp
Scenario analysis in spatial impact assessment: A methodological approach, 20 p.
2009-27 Aliye Ahu Gülümser Tüzin Baycan-Levent Peter Nijkamp
Beauty is in the eyes of the beholder: A logistic regression analysis of
2009-29 Peter Nijkamp Maria Abreu
Regional development theory, 12 p.
2009-30 Tüzin Baycan-Levent Peter Nijkamp
7 FAQs in urban planning, 22 p.
2009-31 Aliye Ahu Gülümser Tüzin Baycan-Levent Peter Nijkamp
Turkey’s rurality: A comparative analysis at the EU level, 22 p.
2009-32 Frank Bruinsma Karima Kourtit Peter Nijkamp
An agent-based decision support model for the development of e-services in the tourist sector, 21 p.
2009-33 Mediha Sahin Peter Nijkamp Marius Rietdijk
Cultural diversity and urban innovativeness: Personal and business characteristics of urban migrant entrepreneurs, 27 p.
2009-34 Peter Nijkamp Mediha Sahin
Performance indicators of urban migrant entrepreneurship in the Netherlands, 28 p.
2009-35 Manfred M. Fischer Peter Nijkamp
Entrepreneurship and regional development, 23 p.
2009-36 Faroek Lazrak Peter Nijkamp Piet Rietveld Jan Rouwendal
Cultural heritage and creative cities: An economic evaluation perspective, 20 p.
2009-37 Enno Masurel Peter Nijkamp
Bridging the gap between institutions of higher education and small and medium-size enterprises, 32 p.
2009-38 Francesca Medda Peter Nijkamp Piet Rietveld
Dynamic effects of external and private transport costs on urban shape: A morphogenetic perspective, 17 p.
2009-39 Roberta Capello Peter Nijkamp
Urban economics at a cross-yard: Recent theoretical and methodological directions and future challenges, 16 p.
2009-40 Enno Masurel Peter Nijkamp
The low participation of urban migrant entrepreneurs: Reasons and perceptions of weak institutional embeddedness, 23 p.
2009-41 Patricia van Hemert Peter Nijkamp
Knowledge investments, business R&D and innovativeness of countries. A qualitative meta-analytic comparison, 25 p.
2009-42 Teresa de Noronha Vaz
Peter Nijkamp
Knowledge and innovation: The strings between global and local dimensions of sustainable growth, 16 p.
2009-43 Chiara M. Travisi Peter Nijkamp
Managing environmental risk in agriculture: A systematic perspective on the potential of quantitative policy-oriented risk valuation, 19 p.
2009-45 Eveline S. van Leeuwen Peter Nijkamp
Social accounting matrices. The development and application of SAMs at the local level, 26 p.
2009-46 Tibert Verhagen Willemijn van Dolen
The influence of online store characteristics on consumer impulsive decision-making: A model and empirical application, 33 p.
2009-47 Eveline van Leeuwen Peter Nijkamp
A micro-simulation model for e-services in cultural heritage tourism, 23 p.
2009-48 Andrea Caragliu Chiara Del Bo Peter Nijkamp
Smart cities in Europe, 15 p.
2009-49 Faroek Lazrak Peter Nijkamp Piet Rietveld Jan Rouwendal
Cultural heritage: Hedonic prices for non-market values, 11 p.
2009-50 Eric de Noronha Vaz João Pedro Bernardes Peter Nijkamp
Past landscapes for the reconstruction of Roman land use: Eco-history tourism in the Algarve, 23 p.
2009-51 Eveline van Leeuwen Peter Nijkamp Teresa de Noronha Vaz
The Multi-functional use of urban green space, 12 p.
2009-52 Peter Bakker Carl Koopmans Peter Nijkamp
Appraisal of integrated transport policies, 20 p.
2009-53 Luca De Angelis Leonard J. Paas
The dynamics analysis and prediction of stock markets through the latent Markov model, 29 p.
2009-54 Jan Anne Annema Carl Koopmans
Een lastige praktijk: Ervaringen met waarderen van omgevingskwaliteit in de kosten-batenanalyse, 17 p.
2009-55 Bas Straathof Gert-Jan Linders
Europe’s internal market at fifty: Over the hill? 39 p.
2009-56 Joaquim A.S. Gromicho Jelke J. van Hoorn Francisco Saldanha-da-Gama
Gerrit T. Timmer
Exponentially better than brute force: solving the job-shop scheduling problem optimally by dynamic programming, 14 p.
2009-57 Carmen Lee Roman Kraeussl Leo Paas
The effect of anticipated and experienced regret and pride on investors’ future selling decisions, 31 p.
Daniel A. Griffith Peter Nijkamp
2010-2 Thomas de Graaff Ghebre Debrezion Piet Rietveld
Schaalsprong Almere. Het effect van bereikbaarheidsverbeteringen op de huizenprijzen in Almere, 22 p. 2010-3 John Steenbruggen Maria Teresa Borzacchiello Peter Nijkamp Henk Scholten
Real-time data from mobile phone networks for urban incidence and traffic management – a review of application and opportunities, 23 p.
2010-4 Marc D. Bahlmann Tom Elfring Peter Groenewegen Marleen H. Huysman
Does distance matter? An ego-network approach towards the knowledge-based theory of clusters, 31 p.
2010-5 Jelke J. van Hoorn A note on the worst case complexity for the capacitated vehicle routing problem, 3 p.
2010-6 Mark G. Lijesen Empirical applications of spatial competition; an interpretative literature review, 16 p.
2010-7 Carmen Lee Roman Kraeussl Leo Paas
Personality and investment: Personality differences affect investors’ adaptation to losses, 28 p.
2010-8 Nahom Ghebrihiwet Evgenia Motchenkova
Leniency programs in the presence of judicial errors, 21 p.
2010-9 Meindert J. Flikkema Ard-Pieter de Man Matthijs Wolters
New trademark registration as an indicator of innovation: results of an explorative study of Benelux trademark data, 53 p.
2010-10 Jani Merikivi Tibert Verhagen Frans Feldberg
Having belief(s) in social virtual worlds: A decomposed approach, 37 p.
2010-11 Umut Kilinç Price-cost markups and productivity dynamics of entrant plants, 34 p.
2011-2 Paulo A.L.D. Nunes Peter Nijkamp
Biodiversity: Economic perspectives, 37 p.
2011-3 Eric de Noronha Vaz Doan Nainggolan Peter Nijkamp Marco Painho
A complex spatial systems analysis of tourism and urban sprawl in the Algarve, 23 p.
2011-4 Karima Kourtit Peter Nijkamp
Strangers on the move. Ethnic entrepreneurs as urban change actors, 34 p.
2011-5 Manie Geyer Helen C. Coetzee Danie Du Plessis Ronnie Donaldson Peter Nijkamp
Recent business transformation in intermediate-sized cities in South Africa, 30 p.
2011-6 Aki Kangasharju Christophe Tavéra Peter Nijkamp
Regional growth and unemployment. The validity of Okun’s law for the Finnish regions, 17 p.
2011-7 Amitrajeet A. Batabyal Peter Nijkamp
A Schumpeterian model of entrepreneurship, innovation, and regional economic growth, 30 p.
2011-8 Aliye Ahu Akgün Tüzin Baycan Levent Peter Nijkamp
The engine of sustainable rural development: Embeddedness of entrepreneurs in rural Turkey, 17 p.
2011-9 Aliye Ahu Akgün Eveline van Leeuwen Peter Nijkamp
A systemic perspective on multi-stakeholder sustainable development strategies, 26 p.
2011-10 Tibert Verhagen Jaap van Nes Frans Feldberg Willemijn van Dolen
Virtual customer service agents: Using social presence and personalization to shape online service encounters, 48 p.
2011-11 Henk J. Scholten Maarten van der Vlist
De inrichting van crisisbeheersing, de relatie tussen besluitvorming en informatievoorziening. Casus: Warroom project Netcentrisch werken bij Rijkswaterstaat, 23 p.
2011-12 Tüzin Baycan Peter Nijkamp
A socio-economic impact analysis of cultural diversity, 22 p.
2011-13 Aliye Ahu Akgün Tüzin Baycan
Peter Nijkamp
Repositioning rural areas as promising future hot spots, 22 p.
2011-14 Selmar Meents Tibert Verhagen Paul Vlaar
How sellers can stimulate purchasing in electronic marketplaces: Using information as a risk reduction signal, 29 p.
Peter Nijkamp 2011-16 Frank Bruinsma
Karima Kourtit Peter Nijkamp
Tourism, culture and e-services: Evaluation of e-services packages, 30 p.
2011-17 Peter Nijkamp Frank Bruinsma Karima Kourtit Eveline van Leeuwen
Supply of and demand for e-services in the cultural sector: Combining top-down and bottom-up perspectives, 16 p.
2011-18 Eveline van Leeuwen Peter Nijkamp
Piet Rietveld
Climate change: From global concern to regional challenge, 17 p.
2011-19 Eveline van Leeuwen Peter Nijkamp
Operational advances in tourism research, 25 p.
2011-20 Aliye Ahu Akgün Tüzin Baycan
Peter Nijkamp
Creative capacity for sustainable development: A comparative analysis of European and Turkish rural regions, 18 p.
2011-21 Aliye Ahu Gülümser Tüzin Baycan-Levent Peter Nijkamp
Business dynamics as the source of counterurbanisation: An empirical analysis of Turkey, 18 p.
2011-22 Jessie Bakens Peter Nijkamp
Lessons from migration impact analysis, 19 p.
2011-23 Peter Nijkamp Galit Cohen-blankshtain
Opportunities and pitfalls of local e-democracy, 17 p.
2011-24 Maura Soekijad Irene Skovgaard Smith
The ‘lean people’ in hospital change: Identity work as social differentiation, 30 p.
2011-25 Evgenia Motchenkova Olgerd Rus
Research joint ventures and price collusion: Joint analysis of the impact of R&D subsidies and antitrust fines, 30 p.
2011-26 Karima Kourtit Peter Nijkamp
Strategic choice analysis by expert panels for migration impact assessment, 41 p.
2011-27 Faroek Lazrak Peter Nijkamp Piet Rietveld Jan Rouwendal
The market value of listed heritage: An urban economic application of spatial hedonic pricing, 24 p.
2011-28 Peter Nijkamp Socio-economic impacts of heterogeneity among foreign migrants: Research and policy challenges, 17 p.
2011-29 Masood Gheasi Peter Nijkamp
Migration, tourism and international trade: Evidence from the UK, 8 p.
Frank Bruinsma 2011-31 Cathy Macharis
Peter Nijkamp
Possible bias in multi-actor multi-criteria transportation evaluation: Issues and solutions, 16 p. 2011-32 John Steenbruggen Maria Teresa Borzacchiello Peter Nijkamp Henk Scholten
The use of GSM data for transport safety management: An exploratory review, 29 p.
2011-33 John Steenbruggen Peter Nijkamp
Jan M. Smits Michel Grothe
Traffic incident management: A common operational picture to support situational awareness of sustainable mobility, 36 p.
2011-34 Tüzin Baycan Peter Nijkamp
Students’ interest in an entrepreneurial career in a multicultural society, 25 p.
2011-35 Adele Finco Deborah Bentivoglio Peter Nijkamp
Integrated evaluation of biofuel production options in agriculture: An exploration of sustainable policy scenarios, 16 p.
2011-36 Eric de Noronha Vaz Pedro Cabral Mário Caetano Peter Nijkamp Marco Paínho
Urban heritage endangerment at the interface of future cities and past heritage: A spatial vulnerability assessment, 25 p.
2011-37 Maria Giaoutzi Anastasia Stratigea Eveline van Leeuwen Peter Nijkamp
Scenario analysis in foresight: AG2020, 23 p.
2011-38 Peter Nijkamp Patricia van Hemert
Knowledge infrastructure and regional growth, 12 p.
2011-39 Patricia van Hemert Enno Masurel
Peter Nijkamp
The role of knowledge sources of SME’s for innovation perception and regional innovation policy, 27 p.
2011-40 Eric de Noronha Vaz Marco Painho Peter Nijkamp
Impacts of environmental law and regulations on agricultural land-use change and urban pressure: The Algarve case, 18 p.
2011-41 Karima Kourtit Peter Nijkamp Steef Lowik Frans van Vught Paul Vulto
From islands of innovation to creative hotspots, 26 p.
2011-42 Alina Todiras Peter Nijkamp Saidas Rafijevas
Innovative marketing strategies for national industrial flagships: Brand repositioning for accessing upscale markets, 27 p.
Peter Nijkamp 2011-44 Andrea Caragliu
Chiara Del Bo Peter Nijkamp
A map of human capital in European cities, 36 p.
2011-45 Patrizia Lombardi Silvia Giordano Andrea Caragliu Chiara Del Bo Mark Deakin Peter Nijkamp Karima Kourtit
An advanced triple-helix network model for smart cities performance, 22 p.
2011-46 Jessie Bakens Peter Nijkamp
Migrant heterogeneity and urban development: A conceptual analysis, 17 p.
2011-47 Irene Casas Maria Teresa Borzacchiello Biagio Ciuffo Peter Nijkamp
Short and long term effects of sustainable mobility policy: An exploratory case study, 20 p.
2011-48 Christian Bogmans Can globalization outweigh free-riding? 27 p. 2011-49 Karim Abbas
Bernd Heidergott Djamil Aïssani
A Taylor series expansion approach to the functional approximation of finite queues, 26 p.
2011-50 Eric Koomen Indicators of rural vitality. A GIS-based analysis of socio-economic development of the rural Netherlands, 17 p.
Peter Nijkamp Jacques Poot 2012-2 Joao Romao
Bart Neuts Peter Nijkamp Eveline van Leeuwen
Urban tourist complexes as Multi-product companies: Market segmentation and product differentiation in Amsterdam, 18 p.
2012-3 Vincent A.C. van den Berg
Step tolling with price sensitive demand: Why more steps in the toll makes the consumer better off, 20 p.
2012-4 Vasco Diogo Eric Koomen Floor van der Hilst
Second generation biofuel production in the Netherlands. A spatially-explicit exploration of the economic viability of a perennial biofuel crop, 12 p.
2012-5 Thijs Dekker Paul Koster Roy Brouwer
Changing with the tide: Semi-parametric estimation of preference dynamics, 50 p.
2012-6 Daniel Arribas Karima Kourtit Peter Nijkamp
Benchmarking of world cities through self-organizing maps, 22 p.
2012-7 Karima Kourtit Peter Nijkamp Frans van Vught Paul Vulto
Supernova stars in knowledge-based regions, 24 p.
2012-8 Mediha Sahin Tüzin Baycan Peter Nijkamp
The economic importance of migrant entrepreneurship: An application of data envelopment analysis in the Netherlands, 16 p.
2012-9 Peter Nijkamp Jacques Poot
Migration impact assessment: A state of the art, 48 p.
2012-10 Tibert Verhagen Anniek Nauta Frans Feldberg
Negative online word-of-mouth: Behavioral indicator or emotional release? 29 p.
2013-2 Haralambie Leahu European Options Sensitivities via Monte Carlo Techniques, 28 p. 2013-3 Tibert Verhagen
Charlotte Vonkeman Frans Feldberg Plon Verhagen
Making online products more tangible and likeable: The role of local presence as product presentation mechanism, 44 p.
2013-4 Aliye Ahu Akgün Eveline van Leeuwen Peter Nijkamp
A Multi-actor multi-criteria scenario analysis of regional sustainable resource policy, 24 p.
2013-5 John Steenbruggen Peter Nijkamp
Maarten van der Vlist
Urban traffic incident management in a digital society. An actor-network approach in information technology use in urban Europe, 25 p.
2013-6 Jorge Ridderstaat Robertico Croes Peter Nijkamp
The force field of tourism, 19 p.
2013-7 Masood Gheasi Peter Nijkamp Piet Rietveld
Unknown diversity: A study on undocumented migrant workers in the Dutch household sector, 17 p.
2013-8 Mediha Sahin Peter Nijkamp Soushi Suzuki
Survival of the fittest among migrant entrepreneurs. A study on differences in the efficiency performance of migrant entrepreneurs in Amsterdam by means of data envelopment analysis, 25 p.
2013-9 Kostas Bithas Peter Nijkamp
Biological integrity as a prerequisite for sustainable development: A bioeconomic perspective, 24 p.
2013-10 Madalina-Stefania Dirzu
Peter Nijkamp
The dynamics of agglomeration processes and their contribution to regional development across the EU, 19 p.
2013-11 Eric de Noronha Vaz Agnieszka Walczynska Peter Nijkamp
Regional challenges in tourist wetland systems: An integrated approach to the Ria Formosa area, 17 p.
2013-12 João Romão Eveline van Leeuwen Bart Neuts
Peter Nijkamp
Tourist loyalty and urban e-services: A comparison of behavioural impacts in Leipzig and Amsterdam, 19 p.
2013-13 Jorge Ridderstaat Marck Oduber Robertico Croes Peter Nijkamp Pim Martens
Impacts of seasonal patterns of climate on recurrent fluctuations in tourism demand. Evidence from Aruba, 34 p.
2013-14 Emmanouil Tranos Peter Nijkamp
Urban and regional analysis and the digital revolution: Challenges and opportunities, 16 p.
2013-16 Serenella Sala Biagio Ciuffo Peter Nijkamp
A meta-framework for sustainability assessment, 24 p.
2013-17 Eveline van Leeuwen Peter Nijkamp
Aliye Ahu Akgün Masood Gheasi
Foresights, scenarios and sustainable development – a pluriformity perspective, 19 p.
2013-18 Aliye Ahu Akgün Eveline van Leeuwen Peter Nijkamp
Analytical support tools for sustainable futures, 19 p.
2013-19 Peter Nijkamp Migration impact assessment: A review of evidence-based findings, 29 p. 2013-20 Aliye Ahu Akgün
Eveline van Leeuwen Peter Nijkamp
Sustainability science as a basis for policy evaluation, 16 p.
2013-21 Vicky Katsoni Maria Giaoutzi Peter Nijkamp
Market segmentation in tourism – An operational assessment framework, 28 p.
2013-22 Jorge Ridderstaat Robertico Croes Peter Nijkamp
Tourism development, quality of life and exogenous shocks. A systemic analysis framework, 26 p. 2013-23 Feng Xu Nan Xiang Shanshan Wang Peter Nijkamp Yoshiro Higano
Dynamic simulation of China’s carbon emission reduction potential by 2020, 12 p.
2013-24 John Steenbruggen Peter Nijkamp
Jan M. Smits Ghaitrie Mohabir
Traffic incident and disaster management in the Netherlands: Challenges and obstacles in information sharing, 30 p.
2013-25 Patricia van Hemert Peter Nijkamp
Enno Masurel
From innovation to commercialization through networks and agglomerations: Analysis of sources of innovation, innovation capabilities and performance of Dutch SMEs, 24 p.
2013-26 Patricia van Hemert Peter Nijkamp
Enno Masurel
How do SMEs learn in a systems-of-innovation context? The role of sources of innovation and absorptive capacity on the innovation performance of Dutch SMEs, 27 p.
2013-27 Mediha Sahin Alina Todiras Peter Nijkamp
Colourful entrepreneurship in Dutch cities: A review and analysis of business performance, 25 p.
2013-28 Tüzin Baycan Mediha Sahin Peter Nijkamp
The urban growth potential of second-generation migrant entrepreneurs. A sectoral study on Amsterdam, 31 p.
Vaz
Peter Nijkamp