The Portuguese agriculture and fisheries at the start of the Millennium: is
there a way out ?
Vaz Noronha M.T. de in
Allaya M. (ed.).
Les agricultures méditerranéennes : analyses par pays Montpellier : CIHEAM
Options Méditerranéennes : Série B. Etudes et Recherches; n. 61 2008
pages 383-405
Article available on lin e / Article dispon ible en lign e à l’adresse :
---http://om.ciheam.org/article.php?ID PD F=800144
---To cite th is article / Pou r citer cet article
---Vaz Noronha M.T. de Th e Portu gu ese agricu ltu re an d fish eries at th e start of th e Millen n iu m: is th ere a way ou t ?. In : Allaya M. (ed.). Les agricultures méditerranéennes : analyses par pays . Montpellier : CIHEAM, 2008. p. 383-405 (Options Méditerranéennes : Série B. Etudes et Recherches; n. 61)
---http://www.ciheam.org/ http://om.ciheam.org/
The Portuguese Agriculture and Fisheries at the
Start of the Millennium: Is there a way out?
Teresa de Noronha Vaz
Professor of Regional Economics and Economics of Innovation and Coordinator of the Research Centre for Spatial and Organizational Dynamics at the University of Algarve, Portugal.
Introduction
New, challenging prospects are opening for rural development in the European Union. These are based on the most recent decisions for the European Common Agricultural Policy (CAP) presented by Fisher Boel at an Audition in the Assemblée Nationale in Paris on the CAP Health Check, a package of instruments to transfer funds, before 2013, from agricultural direct payments into the rural development budget. If we consider that the set of measures indicate a clear signal for the meaning attributed to rural development, we should also accept that we are facing the creation of a diversified context for agriculture and above all for the rural world.
A different set of determinants related to the global use of natural resources as well as to the international market contexts impose and justify increasing support measures to rural development so that new orientation in policies require a readdressing from CAP. Firstly, the variations in market prices for cereals will be increasingly driven by future Indian and Chinese consumer trends. Secondly, fuel or other bio-energy programs will be able to solve a great part of our bio-energy problems offering a complementary solution to a global package of alternative energy usage. Also, the expected climate changes, like drought in many regions around the world, and also in Europe, demand fast and re-active market responses to sudden productive catastrophes – storages and nuclei of local production can represent instruments for covering unexpected market imbalances. Finally, in the near future water scarcity will represent a serious restriction for many parts of the world, demanding water management in a way where production levels should be put back into their natural levels and environments.
Thus, not surprisingly, those policy makers are using their power to make actors aware of the need for a more responsible attitude in the creation of “tailor made” support measures to reduce existing production bias in the agricultural scene.
This is a long term goal, involving all the social participants, even citizens in general, and stressing for a cooperative behaviour. In Europe, it is expected that CAP will achieve positive results by using the following measures: single payment entitlements, decoupling, modulation, and cross-compliance. These are the new instruments for a two step model in which the European Commission expects to create a progressive scheme as well as to dismantle the planting rights.
The Portuguese context for increasing the productivity of the agricultural sector and development of the rural areas depends, therefore, on this changing background that, for decades, has been the bastion of growth and development for so many European agricultural regions.
It is important to consider that the results we shall discuss in this chapter derive from the set of measures in practice since June 2003, which meant a fundamental reform of the Common Agricultural Policy (CAP). This reform has completely changed the way how the EU has supported its farm sector. The new CAP tried to give EU farmers the freedom to produce what the market wanted and the vast majority of subsidies were paid independently from the volume of production. To avoid abandonment of production, Member States could choose to keep a limited link between subsidies and production, but this under clear
animal safety. Policy makers confirmed, at the time, that the goal also was a due income stability while assuring more competitive and market-oriented farmers’ decisions. Key elements for this reform of CAP were:
A single farm payment for EU farmers, independent from production; limited coupled elements may be maintained to avoid abandonment of production, this payment linked to the respect for environment, food safety, animal and plant health and animal welfare standards, as well as the requirement to keep all the farmland in good agricultural and environmental conditions ("cross-compliance");
A strengthened rural development policy with more EU funds, new measures to promote the environment, quality and animal welfare and to help farmers to meet EU production standards starting in 2005;
A reduction in direct payments ("modulation") for bigger farms to finance the new rural development policy;
A mechanism for financial discipline to ensure that the farm budget fixed until 2013 is not overshot; Revisions to the market policy of the CAP:
- asymmetric price cuts in the milk sector: The intervention price for butter was reduced by 25% over four years, which was an additional price cut of 10% compared to Agenda 2000, for skimmed milk powder a 15% reduction over three years, as agreed in Agenda 2000;
- reduction of the monthly increments in the cereals sector by half, the intervention price maintained; - reforms in the rice, wheat, nuts, starch potatoes and dried fodder sectors.
It is important to understand the impacts that this policy measures had upon the structural change of the Portuguese primary sector. Among other considerations not previously described, we should point out the natural movement of labour resulting from a country, which in the last thirty years has highly increased the contribution of Services for the National Internal Product. The impact of this adjustment on the regions shows an increasing tendency for asymmetric development characterised by growing population rates in the littoral areas and exodus from the hinterlands.
Alentejo, Beira Interior, Trás-os-Montes are the three regions to demand from public policy a more attentive intervention in order to avoid stagnation. Particularly, Alentejo has been historically an agricultural area. With a land use structure of great properties, (latifúndios), it was the prime cereal productive area of the country up to the seventies.
Today, Alentejo is famous for the quality of meat and wine, in parallel with the still existing very extensive cork plantations. To improve the commercial circuits using local identity labels has been a task related to the regional policies, still the results have not been so good as to revert the tendency for more regional activities in the food sector.
A new aspect related to the multi-functioning of agriculture is bringing new hope to this large region. Namely, to link activities of the primary sector to others related with tourism, sports, large cultural events, production of alternative energy forms or other activities to require much space and low property prices. Also, Portuguese decision makers are aware of the immense potential hidden in the regional university and up to the last five years there has been a transversal interest in promoting these institutions, in order to use them as possible knowledge pools. Interior regions, earlier seen as typical agricultural areas, have almost all of them, universities interested in promoting regional entrepreneurship and spin-offs of skills adapted to the regional interests. It has been a long, but steady building process.
I -
The Agricultural sector
1. General trends
Based on an overall view of annexe 1 we can say that Portuguese agricultural activities are not only decreasing their relative participation in the Gross Internal Product, but also decreasing their absolute value for the period 2003-2005. Forestry constitutes an exception, but the increase is so low that it can be considered as being kept constant. It is almost shocking to realise that the vegetable production has
decreased about 14%, during the short period considered, for an increase of about 10% of animal production. This means not only a profound structural change in the productive system, but moreover, indicating a new trend towards northern consumption habits. This is indeed a reaction that has been taking place in the country since the eighties and is due to an heavy investment of European distribution chains in the commercialization of food production.
We can observe that subsidies reductions, conforming to the global goals of CAP, had its influence upon the performance of the vegetable, animal and fish sub-sectors and justify the slight reduced production. However, due to the fact that forestry received a 46% increase in subsidies, it is able to show better results, particularly in what concerns its gross added value. Another possible consequence from that reduction is related to the growing depreciations of capital for both agricultural and animal production and forestry. Exception goes for fisheries whose enterprises survived, obliged to renew their equipments. The variations in the added values of agricultural production tend to low, another signal of the bad shape of Portuguese agriculture, which alltogether shows a decreasing income.
Certain is that the new reforms of CAP were not conform to Portuguese needs for a total reshaping of many traditional and not organized structures. Still, such a negative trend demands a careful consideration about the efficiency of most of applied policy instruments.
Before being able to enter in such detailed analyses we will observe the composition of agricultural accounts by sector, trying to understand the justification for this performance from both the internal perspective and the international markets trends.
2. Agricultural structure
Most of the decision to grow crops in a given region results from three major factors: the soil characteristics, climate adequacy and the structure of the land use. Although Portugal is not a country rich in arable soil, due to a great parcel of rocky and sandy areas, the climate conditions are in general very convenient for agricultural production.
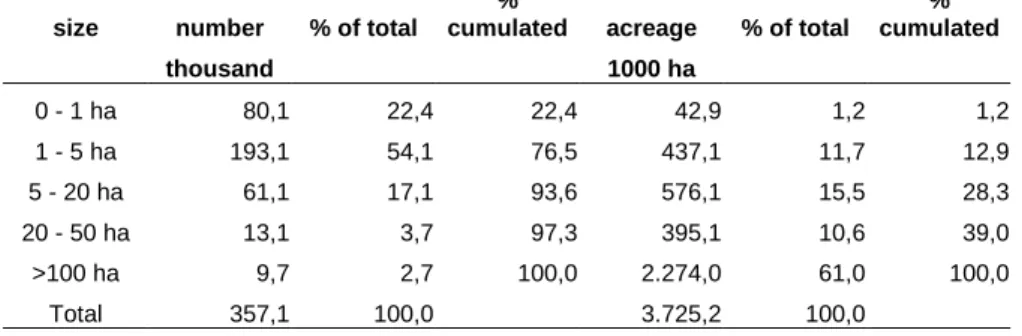
History has determined that properties have an asymmetric dimension across the country: the northern central part almost composed of small size farms, and the southern areas of Alentejo and Algarve rich in huge extensive farms. Let us clarify that, for example, Alentejo farms bigger than 50 ha occupy 76% of the total agricultural surface of Portugal (excluding the islands).
Annexe 2 demonstrates such asymmetry. From the total arable area, 61% is concentrated in less than 3% of the total number of farms. Such an unbalanced distribution could be used as a potential advantage for restructuring the Portuguese primary sector, would the few investors be called to pro-actively act in joint public policies - after all, 9.729 entrepreneurs are involved in the use of 2/3 of the country’s land. Instead, most of the policy decisions (frequently inappropriate) are oriented to the great majority of farmers who compose the 76,5% of small firms fighting for survival in a competitive global world, their farms not being larger than 5ha. As it is well known the level of economic efficiency achieved by such a small structure is very low, unless there is a determination to cooperate and organize in associative forms to produce, learn and sell. In spite of many European programs from FEDER and FEOGA to directly or indirectly improve Portuguese organization capacity in the agricultural sector, cooperation has never been an easy task to surmount.
In the earlier discussion we had already seen that we were assisting to a decrease in added value for most of the sub-sectors of the agricultural activity. For the period 2004 and 2005, those productions mostly responsible for such results have been: cereals, pulses, potatoes, table olives, industrial crops and other, non-specified items. Meat and livestock production decreased not so significantly due to higher consumption of pork, poultry and milk.
The fact that a great part of those products belonging to a Mediterranean diet (with exception of olive oil) are being less produced, suggests that, on one hand, the Portuguese consumption patterns are changing as previously stated, while the productive structure is slowly adjusting them or, on the other hand, our traditional producers are losing competitiveness towards Spanish or other Mediterranean producers.
Annexe 3 supplies detailed information on the agricultural economic accounts by products and activities and demonstrates that also intermediate consumption is controlled to the production decreases, with exception of services. Services are increasingly required for supporting the production process as to sell these primary products. Alltogether the Gross Added Value at market prices for the Portuguese agricultural production decreased 16,4%.
A much more enthusiastic view can be obtained when considering the forestry sector, which could show, for the considered period, an increase in the output of about 4%. This was mainly due to both the new plantations of cork and reforestation work. Also positive is the fact that this increase did not correspond to a raise in the intermediate consumption.
In the fishery sector crustaceans, seafood and shellfish have been those products mostly responsible for the stability. Fisheries have delivered more services to other sectors than in the previous period guaranteeing for a final output that move up from 2004 to 2005 of about 2,5%. Reasons to justify this can be found in the better use of public support instruments, which increased about 29%.
The data presented in annexe 4 shows the absolute values of production and land used for the several crops of the Portuguese primary sector, giving the idea of how much the different productivities have changed. It is important to realise that most of the crops have significant increases from 2003 to 2004, with exception of the production of lemons, apples, peaches and almonds. However, in the following year, when new instruments from CAP were at fullest, we could observe decreases in the productive level of all productions with no exception.
Contrarily to vegetable production, meat production increased significantly between 2003 and 2005, mainly due to more consumption of beef, pork and poultry as shown in annexe 5. In the annexes 6 and 7 the level of changes in cattle production and milk production is illustrated: both increased slightly, showing a growing tendency for the absorption of northern consumption patterns into the Portuguese diet.
3. Some history about the agro-food sector in Portugal
At this point of the description we would like to introduce a summary of what has been so far, the dynamics of the agro-food sector in Portugal, because its development reflects both what have been the internal policies and the not favourable international context.
Since about a decade now, that the Portuguese economy has been facing very slight, almost insignificant growth rates – some scholars even discuss if the period is not of stagnation. Some drivers of change have been missing as components to growth: Investment, Exports and Internal Consumption. Salaries are far below those of the European average, even below some of the recent EU eastern members. Agriculture has not been a major focus of Portuguese political targets, the food industry either. The result of which was, for example, during 2003 and in the intra-EU changes, a deficit in the agricultural and food sectors of – 2.408,9 millions of Euros. This negative contribution to the Trade Balance is representing an abnormal high value of external food dependency, which is achieving values superior to 80% for both sectors. Just for comparison, other European country members of the same dimension have much lower dependency levels: Spain, 46,5%; Ireland 51,9%; Denmark, 7,0%; Greece, 48,7% - the last two being net exporters.
Since the Portuguese entry to the European market, twenty years ago, the Portuguese openness level (OL) of the agro-food sector (considering agriculture and the food industry together) has increased at a very slow speed.
Table 1.
Years 1980 1985 1990 1995 2000
OL (%) 50.6 44.0 49.3 61.5 67.4
Source: Agricultural Statistics and National Accounts.
The Portuguese consumption was increasingly composed of imports, more significant in the food industry than in the agricultural production, as it can be seen by the loss of self-sufficiency shown in the data below. Table 2. Years 1980 1885 1990 1995 2000 Agriculture 78.4 75.9 80.8 74.6 74.9 AFI 93.8 94.1 90.1 85.1 83.6 Set 86.7 83.2 86.4 81.3 80.7
AFI : Agro Food Industries
Source: Agricultural Statistics and National Accounts.
It is possible to better evaluate the commercial efficiency of the food sector by observing the import-export rate during the same period.
Table 3.
Years 1980 1985 1990 1995 2000
Agriculture 9.7 7.7 15.2 14.3 18.5
AFI 88.6 86.1 55.0 51.7 48.9
Set 29.4 26.5 32.4 33.2 35.8
AFI : Agro Food Industries
Source: Agricultural Statistics and National Accounts.
In summary, after 1986 and due to Portugal’s integration in the European Community most of the agricultural commercial flows took place within the European common market. This was due to two major reasons: An increase in the consumption levels of food and a consequent raise of the associated imports. International food distribution chains located gradually in the country, accessing great part of the Portuguese population, first in big towns, then in small ones. They drove Portuguese consumption patterns towards those of the other European countries at a time when producers and industrials were still not ready to move into new productive processes and new commercial chains. So far, it is important to realise that while the agricultural production is slowly trying to adapt to a new reality by changing into innovative productive forms, most of the national food industry is giving up in favour of the big international companies.
Policy makers have traced for the country, in the period 2003-2005, a national strategy for rural and agricultural development driven by the goals of improving competitiveness, quality and food security and, finally, increasing exports and substituting imports. Still, it is questionable if so late in time this decision will be able to surpass a great number of global restrictions facing the CAP in general. The framework that Portuguese have to face from now on is designed by environmental concerns, new comers into the world agro-food scene like Australia, New-Zealand, Brazil and Argentina, and the different approaches about the forms how land should be used in the future.
4. Market prices
Generally, the evolution of market prices reflects those pathways a country has followed in a compromise between international markets, internal consumption trends and political choices. In the case of Portugal, a country that has been gradually integrating the intra-European market, the agricultural flows prospect price irregularities and new price tendencies.
The first set of factors that should be considered responsible for these tendencies extended along the last twenty years, resulted from major changes in the consumption patterns of the country, now much similar to those of northern Europe.
In fact, social conditions in association with the entry of big distribution chains in the commercial circuits created opportunities for higher consumption of processed food. The case of higher consumption of frozen fish or processed vegetables to fill up the needs of a different labor structure, where women become permanently active, is a good example.
Also, a very important fact to be considered is that in presence of a total exposition to the globalization process, the big distribution chains brought to Portugal long term agreements with those agricultural and food producers whose prices were lower, importing them from no matter which country. These were circumstances to create an additional pressure to the already permanent tendency for the international lowering of agricultural prices.
From the group of products listed in annexe 8 we can find a small group of products for which prices increased, contradicting those arguments pointed out earlier. These products may be associated to traditional food. Those products, earlier closed within commercial forms of proximity, were exposing to an opened European market and demanded by other countries. If able to fast adapt to international requirements and to provide rural identity, market segmentation, adequate labeling and good quality standards, those products represented ideal items for exports. Competing in a traditional internal market and an increasing demand for exports, they have brought in many cases modern techniques to the traditional productive scene justifying price increases. The production of grapes, mandarins, apples, olive oil and sheep are examples.
Quite different is the case of other basic productions, whose prices also raised up, but due to different reasons. Previously sold at very low prices but also having irregular quality, their supply could not match with those requirements expected by the modern distribution. In such cases imports took place at higher prices; potatoes and onions illustrate the case.
When observing the data presented in annexe 8, that shows the changes for the agricultural prices in the period 2003 to 2005, we may be tempted to evaluate the price changes only by considering market determinants. But this would not be a sufficient analysis to find the complete justification for price changes and their respective irregularities: the prices of raw materials and intermediary products. Annexe 9 illustrates the price variations of agricultural inputs.
Those data demonstrate that, contrarily to what could have been expected, agricultural labor prices decreased in Portugal for both qualified and non-qualified workers. Also, the price for seeds and plants for growth have followed down. Against this opportunity to buy raw materials cheap, the price of fuel and fertilizers, which compose a non-neglectable part of production costs, have rised significantly, during the period, the same happening in the rates for investment.
5. Food industry and external trade
In 1995 the Portuguese food industry represented about 17% of all the activities in manufacturing. These significant activities occupied 112.484 people, in a total of 7.682 firms, selling just about 12% of the sales realized by the secondary sector. The levels of productivity by sector were low, recalling the fact that the food industry in the country, although important at the employment level, was not considered a major
contribution to the internal product. Not surprising that since then the political development strategies for the country have not considered it to be a major vector either.
It was probably a big error of policy makers to have let the agro-food sector apart from the strategic development process of the country. The loss of business opportunities in other more complex developments of industrial correlated segments or the delay in R&D in biotechnology are paying for such political choices and Portugal shows a great difficulty in adding new value to the agricultural sector and performing competitively in the food sector in general. Slowly, the number of involved firms in the food industry is decreasing, the same for workers, the sells keeping constant during the last ten years. A balance over a long period points out an increase of productivity and stagnation in production.
Annexe 10, nonetheless, shows for the last two years some taking off that could signal an end for the stagnation period. We can detect an increase in sales (not much change in the added value) and a reduction in employment that can be interpreted as propensity for the industry to become more capital intensive. These results are also confirmed by the recent evolution in the external trade. Although the share of agricultural production in the Portuguese trade balance is minimal, (annexe 12 shows that the weight of agricultural exports in all the exports of the country is near 1% and in the exports about 4%) there is a 3,5% decrease in the imports of agricultural production and a 5,8% increase in exports of 5,8%, for the period 2004/2005. Annexe 13 shows the level of agricultural external trade by main products. Per sector, the activities composed of a higher number of firms are: bread, pastry and biscuits – similarly to the less developed countries. Oil and fat industries, as well as meat processing products are also represented in an important number of firms. From 2003 to 2004 there has been a clear expansion in some activities within the entrepreneurial structure, like meat products and dairy milk industries, confirming our approximation to the northern diet. Also a rise in the productivity levels, considering it by added value or by sales, can be observed.
II -
Effects of the Common Agricultural Policy in Portugal
In June 2003, the CAP reform was approved by the European Council of Ministers for Agriculture. Later on it was complemented with the reforms of the so called Mediterranean products (olive oil, tobacco, cotton) and the hop. The change on the way how the European Union decided to support the communitarian agriculture meant, in fact, that a large amount of direct aids were granted by means of a sole payment per exploration, apart from the production volume, having to comply with the environmental regulations, alimentary security, animal and vegetal sanity as well as the animals’ well-being. Also, what was called to be the new CAP, counted on the reinforcement of the rural development policy, either through the increase of the European Union funds, made available for the rural development measures, or by introducing new chapters, namely the Compliance with Regulations and the Food Quality.
Following the Agenda 2000 decisions, some Common Market Organisations (CMO) were revised as well as some specific regimes of support, namely cereal, rice, stiff wheat, dry forages, milk and husk fruits. Beside the large above referred measures, the reform still considered important and specific aspects for Portugal:
several alternatives of partial disconnection of the direct aids instead of a total and generalized disconnection in all sectors;
the possibility of implementing the disconnection of the aids until 2007;
the faculty of excluding the aids given in the Autonomous Regions from the sole payment regime per exploration ;
the compulsiveness in all the Member States of modulation of the direct aids, allowing a financial reinforcement for the Rural development actions ( the Autonomous Regions being excepted from their application ) and with individual limits that resulted in net financial profits for Portugal ( 33 million euros/ year);
the introduction of aids to adapt to the compliance of new rules in the environment, hygiene and animal well-being.
The main elements of this reform and the state of the implementation process can be highlighted as follows:
1. Sole payment per exploration
The sole payment regime, resulting from the CAP reform agreed in June 2003 replaced the majority of the direct support to farmers’ regimes existing in the sectors of tilled ground cultures, leguminous for grain, dry forages, bovines, sheep and goats and hop.
This regime consisted of the attribution of an aid to the agricultures income independently from the culture that the farmer wished to plant, even with the chance of opting for maintaining the land in good conditions, both agriculturally and environmentally. As an exception, the farmers were prevented from benefiting of this aid in the patches with permanent cultures or where they cultivated fruits or horticultures. Of course that with the introduction of new aids in the sole payment, as it is the case of the olive oil, the rules were adapted.
In order to benefit from these aids the farmers were payed in a number equal to the hectares average on which the farmer benefited from the direct aids integrated in the sole payment in a reference period, triennial 2000/2001/2002. The total value of these rights was equal to the average amount of the direct aids comprehended in the regime, received in the reference period, these amounts being updated according to the values of the premiums in force. Apart from this general rule, in terms of calculating the rights and use conditions, there were two particular cases with different conditions. First, we had the set-aside rights, calculated according to the above described system but bearing in mind only the compulsory set-aside areas and the respective aids, these rights could be used only in patches where the farmer went on practising the set-aside following the present rules. Secondly, we had the rights subject to special conditions. These rights are created when the producer’s historical aids corresponded to animal productions to which it was not necessary to declare forage areas or when the normal calculation of the rights gave origin to amounts higher than 5.000 Euros/ha. In the case of producers under these conditions the historical amounts were divided into rights of 5.000 Euros, the farmers having the chance to benefit from these amounts, if they did not have those areas, keeping 50% of the effective animals, in Normal Heads that generated the historical amounts.
The farmers who initiated their activity after the reference period and due to a special situation did not have a history of aids or if that did not reflect the investments made, could apply to the national reserve in order to obtain rights to those new aids.
Those rights could be transacted with or without land and utilized in patches different from those where they were generated.
Decisions and National options
Beginning of the regime application
That regime applied in Portugal as from 2005 in order to enable the farmers to adapt quickly to the rules in force until 2013, avoided simultaneously the increase in situations of transition and any inconveniences arising from a larger amount of time between the reference period and the beginning of the regime. However, in the case of olive oil, cotton and tobacco, according to the regulation, these sectors could be included only as from 2006. In what regards the milk sector it was decided to integrate it in the regime as from 2007, taking into account the high levels of restructurations in course.
Options of disconnection
Portugal opted for not keeping connected to the production aids in the tilled cultures sector, once the low level of allowed reconnection ( 25% for payment to the tilled cultures or, alternatively, 40% for the supplement of wheat) was not a sufficient incentive to promote the production, and it would become an obstacle to the possibility of reconverting, namely for the extensive breeding of cattle (taking advantage of the added 90.000 rights to the premium for the feeding cows that Portugal obtained in the negotiations) and it could also correspond to a loss in the financial resources for the country. In the bovine sector, the option was towards maintaining the premiums at the allowed maximum level, that is, the feeding cow at
the present level (reconnection at 100%), the premium for the slaughtering of calves also at the present level, and the premium for the slaughtering of adults to 40% of the present level. In the ovine and sheep sector the option was also to keep the maximum levels of allowed support, that is, 50% of the basis premium per sheep and goats, and of the supplementary premiums for the non-favoured regions. These and other aids connected with production could be accumulated with the aids disconnected from the production.
Facultative implementation for specific types of agriculture and quality production
It is up to the Member State to retain the aids, by sector, in order to constitute a financial package that will serve to give a complementary payment to the farmers who produce a certain type of products of the referred sector or sectors. In this context, in Portugal there was reduced retention (1%) by sector, with the purpose of financing one or various actions proposed in the National Plan for Biological Agriculture Development (NPBAD).
Exclusions
Given the chance foreseen in the Council regulation, Portugal has decided to take from the sole payment the aid to the sector of seeds and the aids given to the autonomous regions (Azores and Madeira).
2. National Reserve
A national reserve must be constituted to give rights to farmers who don’t have them or to increase the value of rights for farmers who have them.
For that, a reduction was made in the value of reference amounts, which in Portugal is foreseen to be 3%. Apart from this financing, it is foreseen the possibility of the Member State retaining part of the rights or of the amounts associated in the case of sales, with or without land. There isn’t any decision taken on the subject, being in course the querying to the main organisations representing the sector.
The reserve will compulsorily have to satisfy the “special situation” cases, which will be identified in national terms: in this situation the cases of certain types of investment, production reconverting and restructuring programmes may be included, their typifying being under procedure.
Criteria for the access to the reserve and attribution of amounts were defined and a decision was taken regarding the establishment of homogenous income zones, for the purpose of calculating the average amount and the eventual limitation of utilization of rights and transfers. In this case the decision from the various organisations representing the producers was considered.
Attribution of rights and particular aspects of the regime application
Certain particular issues are being defined in order to implement the regime, as it is the case of attribution of rights when there are agro-environmental compromises, definition of “agricultural activity”, settlement of dates for the purpose of process electing and procedure, as well as the specific subject of electing areas with trees (aggravated by the future inclusion of the olive trees in the regime) and the situation of permanent pastures. A proposal was also prepared for the definition of the minimal agricultural and environmental conditions, the same being still consulted.
3. Conditionality
The concession of direct aids were subject to the environmental rules, alimentary security, animal and vegetal health, animal well-being, corresponding to 18 communitarian directives and still to the compliance with the demands of keeping the agricultural lands in good agronomic and environmental conditions.
In case of non compliance, the direct payments suffer a reduction in proportion to the risks and damages. The application of this mechanism was defined, through a joint work involving the Organisms under the
responsibility of MADRP and MCOTA, in order to create the control system and establish the respective control indicators, the most precisely and identifiably as possible, so that the farmers could not be unduly penalized.
4. System of agricultural counselling
This system was facultative until 2006. As from 2007 the Member-State gave to their farmers systems of agricultural counselling. This service enables to advise the farmers about the application of norms and good practices in the production process. Auditing may be applied to the explorations by means of balance sheets and structured and regular accountings of the physical fluxes and the processes considered relevant, at the entrepreneurial level, for a certain purpose (environment, alimentary security and animal well-being). The farmers’ participation will be voluntary. In 2010 the Council will decide, based on a report by the Commission about its functioning, if the counselling system should be compulsory for the farmers or not.
5. Modulation of the direct aids
In order to reinforce the budgetary resources available for the rural development, a system of progressive reduction of the direct payments was introduced, for the period from 2005 to 2012, at the communitarian scale, with the exception of Ultra-periphery regions, and with a compulsory character. All the direct payments given to an exploration above the 5.000 euros per year were reduced by 3% in 2005, by 4% in 2006 and by 5% as from 2007.
The modulation of direct aids was applicable only to explorations with a global volume of aids higher than 5.000 euros, this meaning that about 96% of the Portuguese farmers will be exempt from this mechanism. The budgetary savings generated by this mechanism were applied in Rural Development measures. This redistribution represents a yearly net financial balance for Portugal of about 33 million euros.
The recent trends for increases in the international prices of agricultural products justify and facilitate the recent reform of the Common Agricultural Policy. Portugal can benefit from reforming the CAP, if the governmental policies are able to give a decisive impulse to this dossier.
Until 1986 the USA supplied more than 50% of Portuguese importation needs. Today, the major producer is France, with higher prices, only possible because there is external protection. The cereals represent almost 15% of our agricultural imports. The poorer consumers, with a higher weight of expenses centred on the food are the most affected by a policy that subsidizes those who produce in more quantity, thus benefiting the larger producers. These are not only the richest but also the ones who are farther from an ecologic agriculture. The CAP has managed to promote an agriculture which is nearly as aggressive to the environment as industry.
This is a situation that is important to be changed, raising the still very high barriers to commerce that maintain the prices artificially high in the European market and reduce the expenditures that consume almost 40 percent of the communitarian budget. The Europeans must reform the CAP because it is unfair, expensive, inefficient and anti-ecological. Portugal should appear in the first line of defending this reform for these reasons, but also because within Europe it is one of the countries most prejudiced by this policy.
The countries that mostly benefit from CAP are those with a great volume of exports to the communitarian space of products, like the cereals, in which the external protection is high and the subsidies for the guarantee of prices in production are generous. Being a large agricultural exporter, France benefits from the guarantee of high prices proportioned by CAP. The case of Portugal is the opposite. The country is mainly an importer of food from the EU, being predominant the consumers’ loss, due to the limited gains obtained with our agricultural exports, specialized in products little or nothing subsidized. But Portugal
may also be affected by the fact of the budgetary resources absorbed by CAP limiting the structural funds increase.
The CAP reform might limit the loss of those transfers to Portugal after 2013. The country is still prejudiced in another almost invisible way. The liberalisation of the access to the European agricultural markets has become an important factor of blockade in the negotiations within the World Trade Organization. The countries of South America and Africa (led by Brazil and Argentina) demand cessions in this field as a counterpart for opening their markets to the European manufactured products. The maintenance of tariffs to the agricultural imports results in tariffs to the European exports.
It is an invisible tax paid by the exporters. A tax difficult to quantify, but that has a real cost and limits the expansion of exchanges. The Portuguese government commitment in what concerns the strengthening of relationships with Africa and South America must also have to do with assuming a clear position regarding the opening to the European agricultural markets. The existing restrictions are one of the factors that mostly limit the development of those continents countries. The summit EU-Africa must highlight this issue. The recent evolution of the Portuguese exports shows that we can largely benefit from the opening to the extra-EU markets. Portugal has seen its exports to those markets rising.
Our companies are well positioned to take advantage from the opportunities of the eventual liberalization of exchanges with Africa and South America. Blocking these opportunities to Europeans and Africans there is a France more and more isolated and divided in this matter. The present situation, in which the prices of agricultural estate are particularly high and in which possibilities of expanding the agricultural activity to the production of energy, helps softening the eventual adjustment costs proceeding from the opening and the subsidies decrease. This is the moment to go forward with the revision of the agricultural file.
6.
National Strategic Plan for Rural Development, 2007-2013
Our 20 years of experience in CAP, Common Agricultural Policy, shows very well how other and different agro-rural policies are needed. Namely regarding the definition and application of other and different criteria and formula of distribution of aids for the called “Rural Development” and of the (ex) Direct Aids” now included in the Sole Payment Regime, SPR”.
Other and different criteria and formula that enable more social justice promote the national production and compensate those who more and better work the land, the Familiar Agricultural Explorations.
However, the various proposals and options of the Government don’t follow that direction. In fact, the governmental priority and the dynamics to be developed go towards the alleged “competitiveness of the agricultural and forest sectors” – the Axis 1 – of PENDR which constitutes the “central core” of the governmental options. In this case, with a (foreseen) provision between the 45% and 55% of the total 500 millions of euros/ year available on principle, therefore with amounts between 225 and 275 millions of euros per year, to concentrate in projects of “national impact”.
As a consequence, the amounts are more reduced (by the Government) for the “Axis II –Environment and Rural Landscape Improvement” – with a percentage of 35% to 45% (from 175 to 225 million euros /year) – and for “Axis III – Quality of Life in the Agro Rural Zones and Diversification of Rural Economy” – with 10% to 20% (from 50 to 100 million euros/year).
III -
The fishing sector
1. Production and Trade
With an Exclusive Economic Zone of about 1.700 thousand km² and a cost line of 940 km and two autonomous island regions, Portugal is in Europe the country that has a deepest tradition with the sea. Thus, it is not surprising the importance of the fishing industry for the country. From both the economic and social perspectives the coastal population has depended on it or on related activities as a major means of subsistence. Accompanying these natural conditions Portuguese diet is characterised by this trend ever since: In the EU, Portugal is the largest consumer of fish as it exceeds 60 kg per head a year, much above the Community average consumption of any country.
However, and in spite of the finishing tradition, the openness to European and international markets brought to Portugal a serious problem: Production is only able to cover about half of the market demand and imports are the frequent alternative. A consequence is the Portuguese trade balance for fishery products remaining negative for the past few years. Accompanying increasing imports, exports of fishery products show a systematic downward tendency due to the fresh and frozen sub-sectors and the canning industry.
While productive activity tends to constrain (at the end of 2002, there were 22 025 registered fishers, a decline of 6.6% compared with the same period in 2001) while the consumption patterns of fish products tend for frozen fish and dried salted cod as well as very fresh fish sold at auctions (per capita consumption of cod is estimated to be around 30 kg per year, in fresh fish equivalent.
Taking 2002 as a reference year, imports of fish, crustaceans and molluscs amounted to 307 000 tonnes, while 81 000 tonnes were exported. Also for this year the cash income from fisheries represented a nominal rise of 10.7% in 2001, which represents an increase in the current value of fisheries output up to 3.6%, but with a decrease of intermediate consumption of 2.7% compared with 2001.
Up to 2002, the data confirm the existence of growth in the output in the fishing industry, which combined with the upward trend in prices, may have explained 3.6% increase in output, at current prices. The main reason for the low intermediate consumption was the fall in the volume of fuel consumption, so that for this period an increase of 5.8% in Gross Value Added was observed when compared with 2001. Notwithstanding this better performance of the sector we should bear in mind that direct and indirect employment in the sector have been declining since the 1990s as a consequence of industrial technological improvements.
Traditionally the Portuguese are distant-water fishers; their fleet operates in NAFO-regulated waters. In 2002, catches in this area amounted to 19 000 tonnes, up to 3.5% in 2001. The area accounts for 34.3% of all catches, and the main species are redfish and Greenland halibut. The next area is Norway and the main species is cod, accounting for 85% of all catches. They also fish in the Falkland Islands.
Another sub-activity with increasing importance is aquaculture, whose production structure in 2001 consisted of 1 412 operational farms, 1 392 of which were licensed for sea/saltwater farming. They covered 1 587 hectares corresponding to an output of 8 200 tonnes. The main farmed species are: Carpet shell, dorade, trout, oyster and bass, altogether accounting for 92.3% of total output. From 2000 to 2001 the total aquaculture output grew in volume 9% due to a rise in the output of oysters (up 74.9%), which seems to have been generated by an upgrading in product quality, encouraged by domestic and Community financial support.
In 2001, the fishery and aquaculture processing industry produced 135 000 tonnes, of which 128 000 tonnes were traded. This represented 5.2% increases in sales from the previous year basically driven by the traditional dried salted cod. This traditional product still represents 26% of output and 41% of the sales value of the global processed fish production.
As from 2002, the national registered fishing fleet comprised 10 438 vessels with a total tonnage of 109 066 GRT, 117 765 GT and total engine power of 407 449 kW. Vessels of under 5 GRT accounted for around 85% of the total fleet in 2002, and 12.1% of GRT.
2. Management regime
The greatest concern related to the management of fisheries is to keep the sector sustainable, thus policy makers have their targets related to both its social dimension and the certainty to keep up the growth of this industrial sector. The Portuguese legal framing and the respective political choices are supported by EU’s Common Fisheries Policy. Those legal instruments that have recently been introduced intend to
provide economically, environmentally and socially sustainable conditions for the harvesting of common biological resources. In conformity with the Portuguese Constitution which confers upon the State the
responsibility to promote the rational use of natural resources by protecting renewal capacity and
ecological stability the applied sanctions and penalties to infractions are now more rigorous. An important
part of the legislation considers the minimum sizes for commercially important species, fishing gear and biological rest periods, to keep sustainable harvesting of the weakest ecosystems.
Institutional structure
The responsibility for the application of domestic fisheries policy is in charge of the Ministry of Agriculture, Rural Development and Fisheries represented by the Deputy of State Secretary for Fisheries. During the last decade, the policy measures were accompanied by a financial instrument: the Operational Programme for Fisheries (MARE), for the continental part of the country and for the islands, the PRODESA, the Operational Programme for the Economic and Social Development of the Azores and the Multifund Operational Programme for the Autonomous Region of Madeira, POPRAM III. In any case, the current fishery resources management system is based on the Community regime taking a multi-annual approach to management with the adoption of recovery or management plans. Those species not covered by recovery plans are protected by restrictions on catch (TACs and quotas) and fishing effort, published in EU Council Regulations, every year. In Portugal they are: anchovy, megrim, anglerfish, whiting, hake, blue whiting, Norway lobster, plaice, mackerel, sole and horse mackerel. Some Portuguese quotas have stayed partially unused and are therefore traded with other Member States.
There is a complex system of instruments to organise and control the fishing efforts. First, a prior administrative authorisation for the acquisition or construction of new fishing vessels and for the use of fishing gear, and annual licences to fish is required. The authorities grant licences on the basis of criteria and requirements laid down in an Order issued by the government, which also sets the maximum number of licences to be granted every year. As for aquaculture, the installation and operation of marine aquaculture and related facilities (shipping centres, depuration plants) are also subject to prior authorisation by the authorities.
IV -
Conclusion
How to comment on the future prospects for the Portuguese agricultural and food production?
Table 14 points out towards all the main indicators basic for the development of the sector: investment, research, training, market supports, and input subsidies. None represents a hope, an increasing effort to challenge the trend driving Portuguese agriculture out of a no-return way. Some, few agricultural products have survived to a disastrous internal economic policy promoting services ahead the industry. Along the last twenty years no target was clearly defined to find a link between the food processing and the agricultural production. Notwithstanding, cork, wine, few fruits were able to adapt to market pressures. However and, in spite of the available European support given to producer organizations, the great majority of producers were not able for a long time to combine forces and create those structures required for commercializing their products.
Finally, as it seems, the way is now traced and CAP searches for alternative forms to better sustain the rural world which is not, fortunately, uniquely based upon agricultural production. The multifunctional agriculture should be faced in Portugal as a major challenge and a possible solution to keep up population in those rural-interior areas that once were in charge of agricultural production. Also traditional food production needs to be seen as an alternative choice to bring into such regions and locals new learning forms.
Similar tendency can be observed in the fishing sector, where in recent years, harvesting levels by the Portuguese fleet in international waters has remained pretty the same, with no major changes in the quotas used for cod, redfish, swordfish, prawn and Greenland halibut. Although the amount of fishery production is decreasing, it is important to refer that the level of productivity of the sector is improving. The food industry shows relevant potential as consumers are opened for innovative products and soon are learning to be aware. However, the small market dimension eases the entrance of Spanish and other international firms into the sector. Portuguese entrepreneurs are asked to provide the best quality and fight for market proximity advantages or to courageously enter in the export market, which demands skills not always available for small firms.
Agriculture, fishing and the food sector in general have become weak pillars in the diversity of the country’s economic activities, its survival depending now from a significant level of political ability and will. The recent CAP reforms can be also used to drive the future of Portuguese rural world towards more sustainable pathways and we hope for their achievement.
Annexes
Annexe 1. Agricultural economic account. Global results (millions €, constant prices)
2003 2004 2005 Variation
2005/03
constant constant constant %
I - Agriculture and livestock price price price
A. Final agricultural output 6 625,00 7 104,94 6 411,60 -3,22
vegetal productions 4 013,60 4 231,56 3 527,56 -12,11
animal productions 2 344,80 2 604,82 2 625,03 11,95
B. Intermediate consumptions 3 856,50 4 051,82 3 852,07 -0,11
C = A-B. Gross value added 2 768,50 3 053,12 2 559,09 -7,56
D = Subsidies 433,34 562,60
E = Taxes
F = C + D - E. Gross value added at factor costs 2 489,40 2 780,30 2 402,50 -3,49
G = Depreciations 696,90 689,60 725,50 4,10
H = F - G. Net value added at factor costs
= agricultural income 1 792,50 2 090,70 1 677,00 -6,44
2003 2004 2005 Variation
2005/03
constant constant constant %
II - Forestry price price price
A. Final agricultural output 768,54 744,74 772,18 0,47
B. Intermediate consumptions 104,18 106,25 105,50 1,27
C = A-B. Gross value added 664,36 638,49 666,68 0,35
D = Subsidies 4,90 7,86 9,16 86,94
E = Taxes 78,24 76,31 77,50 -0,95
F = C + D - E. Gross value added at factor costs 591,02 570,04 598,38 1,25
G = Depreciations 74,13 75,04 81,49 9,93
H = F - G. Net value added at factor costs
= income 516,89 495,00 516,89 0,00
2003 2004 2005 Variation
2005/03
constant constant constant %
III - Fisheries price price price
A. Final agricultural output 574,90 550,20 563,60 -1,97
B. Intermediate consumptions 174,60 184,30 195,60 12,03
C = A-B. Gross value added 400,40 365,80 368,00 -8,09
D = Subsidies 11,23 7,29 9,42 -16,12
E = Taxes 41,97 41,32 40,16 -4,31
F = C + D - E. Gross value added at factor costs 369,60 331,80 337,20 -8,77
G = Depreciations 164,54 157,58 155,52 -5,48
H = F - G. Net value added at factor costs
= income 205,06 174,22 181,68 -11,40
Annexe 2. Number of farms by size and acreage, 2003
size number % of total
%
cumulated acreage % of total
% cumulated thousand 1000 ha 0 - 1 ha 80,1 22,4 22,4 42,9 1,2 1,2 1 - 5 ha 193,1 54,1 76,5 437,1 11,7 12,9 5 - 20 ha 61,1 17,1 93,6 576,1 15,5 28,3 20 - 50 ha 13,1 3,7 97,3 395,1 10,6 39,0 >100 ha 9,7 2,7 100,0 2.274,0 61,0 100,0 Total 357,1 100,0 3.725,2 100,0 Source: INE.
Annexe 3. Agricultural economic accounts. Results by activity, (millions €)
I - Agriculture and livestock 2004 2005
A. Final agricultural output 6.931,80 6.219,64
vegetal productions 4.342,15 3.662,85
Cereals 284,61 138,01
Rice 52,30 42,38
Pulses 262,98 165,66
roots and tubers 133,50 100,22
industrial crops 109,20 83,60
Vegetables 674,44 622,20
fresh fruit 903,06 746,22
Citrus 88,13 72,06
Grapes 208,50 189,46
wine and grape juice 1.093,12 977,72
table olives 225,14 152,90
olive oil 70,42 84,25
Other 7,11 4,06
meat and livestock 2.588,70 2.543,95
Beef 599,80 543,86
Sheep and goat 166,28 161,13
Pork 588,93 603,54
Poultry 324,81 329,40
Milk 683,35 699,77
Eggs 93,00 83,72
other livestock products 20,16 17,75
B. Intermediate consumptions 3.887,17 3.665,01
Seeds and plants 174,74 151,95
Livestock Energy 303,71 289,03 Fertilizers 135,11 125,51 Phytosanitary 96,75 87,75 veterinary products 28,22 29,72 feeding stuff 1.543,95 1.441,16
capital conservations and repairs 128,94 122,49
services 242,11 250,05
Other 1.223,64 1.167,35
C = A-B. Gross value added at market price 3.054,63 2.554,63
Annexe 4. Evolution of main productions Acreage 1000 ha production 1000 T 2003 2004 2005 2003 2004 2005 Hard wheat 144,16 152,04 20,08 113,42 234,57 1,17 Soft wheat 30,15 35,40 120,64 36,16 58,30 80,32 Barley 11,49 15,89 34,33 13,02 26,24 20,44 Maize 141,60 137,48 110,19 798,02 789,40 513,12 Rice 25,66 25,58 21,94 147,80 149,25 121,49 Other cereals 97,88 96,35 80,89 77,25 105,24 53,04 Total cereals 450,94 462,74 370,07 1.185,67 1.363,00 789,58 Potatoes 48,12 47,90 41,78 735,83 769,76 576,30 Sugar beet 7,49 8,36 8,62 484,15 626,56 604,88 Sunflower 36,63 28,37 7,07 18,01 13,92 2,39 Forage 13,40 12,93 10,30 6,36 6,07 3,70 Lettuce 2,53 2,54 57,16 57,28 Watermelons Melons 3,86 91,80 Tomatoes 12,45 14,01 13,68 894,18 1.200,93 1.085,06 Peppers 1,69 47,63 Onions 1,54 1,61 36,84 38,59 Oranges 21,77 21,56 21,48 276,91 250,32 218,79 Mandarins 5,00 4,85 4,92 63,21 62,87 61,44 Lemons 1,04 1,02 1,02 13,47 12,32 11,83 Apples 21,57 21,41 21,29 287,49 277,30 249,14 Pears 12,90 13,00 12,89 89,66 187,56 130,39 Peaches 6,48 6,34 6,26 56,92 52,04 49,48 Almonds 38,11 38,17 38,05 23,83 13,95 13,95 Bananas 1,18 1,11 21,30 29,55 Grapes 5,95 6,01 6,03 52,41 55,68 49,09 Wine 216,49 216,49 216,49 7.129,00 7.258,00 7063,7* Table olives 10,63 10,63 11,21 11,29 11,45 7,96 Olive oil 363,50 363,80 363,30 364,97 420,08 318,17* Others Note: * - 1000hl
Annexe 5. Evolution of animal production: meat
slaughters (1000) meat production (1000 T)
2003 2004 2005 2003 2004 2005 estimation estimation Meat 778,32 796,69 812,69 Beef 468,78 480,68 438,99 105,77 119,26 119,02 Sheep 1.070,03 1.087,19 1.117,27 22,43 21,99 21,99 Goat 128,59 114,94 130,89 1,73 1,57 1,36 Pork 5.034,39 5.139,39 5.386,63 354,87 340,28 352,99 Horse 1,39 1,43 1,22 0,29 0,24 0,24 poultry 158.073,20 164.815,65 158.537,91 201,73 215,71 215,92 Rabbit 5.124,15 5.528,00 5.928,02 6,08 6,77 6,55 Other 85,42 63,87 94,62 Source: INE.
Annexe 6. Evolution of animal production: cattle
(1000 heads) 2003 2004 2005 estimation Cattle 1389 1443 1441 Sheep 3356 2348 3583 Goats 502 547 551 Pigs 2249 3541 2344 laying hens Other Source: INE.
Annexe 7. Evolution of animal production: milk
production (1000 T) 2003 2004 2005 estimation Milk 2019,95 2076,95 2128,41 cow milk 1893,24 1949,67 1999,23 sheep milk 98,16 98,71 100,09 goat milk 28,54 28,57 29,08 Other Eggs 125,55 131,68 120,45 Other Source: INE.
Annexe 8. Farm gate prices (€/T) estimation 2003 2004 2005 hard wheat 140,50 139,20 137,80 soft wheat 116,90 130,70 137,30 Barley 131,60 142,80 136,90 Maize 157,90 137,80 142,20 Rice 290,00 160,00 193,90 total cereals 836,90 710,50 748,10 Potatoes 168,70 232,70 235,30 Sugar beet 482,30 469,90 477,90 Sunflower 205,00 210,00 183,20 Lettuce 588,10 475,00 569,30 Watermelons 222,20 127,60 171,60 Melons 292,30 305,60 284,70 Tomatoes 569,50 475,80 464,90 Peppers 688,50 736,60 512,90 Onions 240,00 324,60 444,30 Oranges 294,50 334,40 187,40 Mandarins 444,80 427,40 610,60 Lemons 472,20 408,40 464,70 Apples 497,70 583,00 611,00 Pears 797,50 734,10 579,70 Peaches 892,20 1.062,60 568,20 Almonds 734,30 844,70 974,40 Grapes 782,70 910,00 859,20 Wine 337,61 328,49 333,32 olive oil 189,83 241,18 322,65 Beef 2.826,90 2.589,20 2.738,80 Sheep 2.146,60 2.340,10 2.342,40 Goat 4.326,50 4.196,40 4.312,60 Pork 1.328,50 1.422,30 1.433,40 Horse Poultry 832,90 806,30 762,30 Rabbit 1.701,70 1.674,80 1.685,40 cow milk 32,59 33,07 32,19 sheep milk 89,44 87,73 91,32 goat milk 32,30 35,71 35,02 Eggs 58,00 42,80 45,10
Notes: wine and olive oil prices are given by Euros/hl and eggs prices are given by Euros/1000 units
Annexe 9. Price of main inputs (local currency /T)
unité 2003 2004 2005
estimation
non qualified labour 1000 UTA 359,80 338,50 317,20 qualified labour (precise) 1000 UTA 61,70 57,00 52,20
non irrigated land (rent) % (ha) 82,30 83,70
irrigated land (rent) % (ha) 17,70 16,30
seeds €/1000kg hard wheat €/1000kg 309,20 279,60 278,80 soft wheat €/1000kg 372,70 304,70 356,80 maize €/1000kg 10.480,00 10.933,70 5.576,70 barley €/1000kg 334,30 313,40 340,80 potatoes €/1000kg 427,00 440,20 398,20 onions €/1000kg 240,00 324,60 444,30 melons €/1000kg 292,30 305,60 284,70 watermelons €/1000kg 222,20 127,60 171,60 peppers €/1000kg 688,50 736,60 512,90 tomatoes €/1000kg 569,50 475,80 464,90 plants 10 6 156,69 174,74 151,95 citrus €/1000kg 294,50 334,40 187,40 vine €/1000kg apples €/1000kg 497,70 583,00 611,00 peaches €/1000kg 892,20 1.062,60 568,20 pears €/1000kg 797,50 734,10 579,80 apricots €/1000kg fuel 372,80 436,30 556,40 transport €/1000L azoted fertilizers €/1000kg 675,30 747,50 802,50 phosphated fertilizers €/1000kg 813,90 836,80 904,40 potassium €/1000kg 340,00 363,30 416,50 other €/1000kg 226,50 229,60 250,10 phytosanitary products €/1000kg 4.678,80 4.127,70 3.942,70 veterinary services 10 6 27,42 28,22 29,72 hired works soil preparations tractor rent
combine harvester rent
cattle feed 10 6 1.514,75 1.543,95 1.441,16
fodder €/1000kg 142,70 162,20 140,90
concentrated feed 10 6 285,20 302,80 285,00
water of irrigation
short term interest rate 10 6 108,85 128,18 188,78
long term interest rate
Annexe 10. Main indicators of agri-food industries (AFI)
2004 2005
Unités total industries AFI total industries AFI
employment 1000Un 104.955,00 101.731,00 sales 10 6 € 51.336,38 9.534,67 53.163,49 9.635,06 value added 10 6 € 23.019,00 4.054,00 23.295,00 3.626,00 salaries 10 6 € 1.342,75 investments Source: INE.
Annexe 11 - Indicators of the Food Industry
2003
number number sales value
of enterprises of employees added
unit thousand million UM million UM
meat industries 455,00 15.345,00 1.417,446 289,48
fish industries 94,00 5.429,00 588,450 103,19
Processed vegetables 153,00 3.936,00 433,710 117,76
oils and fats 466,00 2.596,00 292,440 77,05
dairy milk industries 297,00 7.688,00 1.231,510 278,31
mill products 165,00 2.214,00 39,900
Animal feed 110,00 4.543,00 991,340
Bread, pastry, biscuits 1.507,00 869,260
Sugar 6,00 284,720
cacao, chocolate 7,00 52,370
Wine 212,00 891,605
Beer and malt 8,00 383,610
Eau 21,00 190,180
Other alcoholic drinks
Water and non alcoholic drinks 29,00 520,480
Total AFI 8.540,00 104.955,00 9.537,670 2.402,78
2004
number number sales value
of enterprises of employees added
unit thousand million UM million UM
meat industries 490,00 15.345,00 1.417,446 289,48
fish industries 100,00 5.429,00 588,450 103,19
Processed vegetables 156,00 3.936,00 433,710 117,76
oils and fats 416,00 2.596,00 292,440 77,05
dairy milk industries 341,00 7.688,00 1.231,510 278,31
mill products 165,00 2.214,00 39,900
Animal feed 114,00 4.543,00 991,340
Bread, pastry, biscuits 1.573,00 869,260
Sugar 6,00 284,720
cacao, chocolate 7,00 52,370
Wine 212,00 891,605
Beer and malt 8,00 383,610
Eau 21,00 190,180
Other alcoholic drinks
Water and non alcoholic drinks 29,00 520,480
Total AFI 8.496,00 104.955,00 9.537,670 2.402,78
Annexe 12. Total and agricultural external trade (millions €) 2004 2005 All products 28.394,72 28.411,37 Exports 45.861,48 47.644,34 imports Agricultural products exports 411,26 435,04 imports 1.956,52 1.887,32 Source: INE.
Annexe 13. Agricultural external trade by main products
2004 2005
imports Exports imports exports
quantity value quantity value quantity value quantity value
1000 T 1000 € 1000 T 1000 € 1000 T 1000 € 1000 T 1000 € hard wheat 95,16 16.297,00 11,43 1.606,00 97,17 14.408,00 10,77 1,40 soft wheat 1.360,05 206.692,00 61,39 8.130,00 1.742,64 224.682,00 144,27 18.875,00 Barley 377,25 53.782,00 70,08 10.986,00 394,19 51.011,00 73,47 98.559,00 Maize 1.122,73 169.822,00 44,17 8.452,00 1.235,40 162.760,00 23,74 5,16 Rice 93,11 29.199,00 21,96 7.743,00 148,45 40.078,00 14,04 4.340,00 other cereals 14,58 3.677,00 2,90 550,00 32,41 6.635,00 11,78 1.649,00 total cereals 3.062,88 479.469,00 211,93 38.267,00 3.852,76 549.050,00 294,99 134.792,00 Potatoes 252,76 51.565,00 26,22 14.070,00 233,51 38.545,00 19,85 6.872,00 Sunflower 203,72 54.824,00 4,81 1.198,00 274,14 73.478,00 1,14 427,00 Fourrage 73,27 31.016,00 12,98 9.051,00 61,02 32.532,00 12,83 9.998,00 Lettuce 1,35 1.999,00 4,32 6.411,00 1,38 2.060,00 4,92 9.961,00 Melons 62,92 21.430,00 3,99 2.163,00 62,54 30.290,00 2,40 1.329,00 Tomatoes 28,33 16.987,00 94,53 8.608,00 25,88 24.276,00 51,82 7.898,00 Peppers 7,55 7.436,00 1,34 2.072,00 9,86 9.114,00 2,58 2.734,00 Onions 42,76 17.077,00 1,42 1.090,00 37,40 13.624,00 3,34 2.209,00 Oranges 30,19 15.983,00 5,78 2.216,00 27,59 11.637,00 12,62 4.798,00 Mandarins 8,35 5.446,00 0,38 325,10 9,84 5.784,00 3,61 1.570,00 Lemons 6,91 3.939,00 0,08 54,83 6,12 3.216,00 0,29 173,50 Apples 7,94 47.903,00 10,53 4.147,00 75,62 45.125,00 8,63 2.758,00 Pears 22,42 15.507,00 29,23 21.438,00 21,99 13.507,00 46,79 27.031,00 Peaches 30,56 23.825,00 0,58 689,00 30,93 17.946,00 1,35 1.020,00 Almonds 2,40 10.648,00 1,02 1.824,00 1,87 10.589,00 2,14 4.019,00 Bananas 160,79 78.014,00 28,94 18.637,00 163,47 100.824,00 53,54 39.739,00 Grapes 26,55 27.749,00 1,41 1.816,00 27,76 30.059,00 1,38 1.795,00 Wine 1.582,09 69.864,00 3.187,75 533.094,00 1.423,66 64.279,00 2.598,78 529.117,00 table olives 12,34 8.720,00 6,44 5.672,00 14,78 10.190,00 10,42 8.388,00 olive oil 55,88 135.959,00 20,82 64.506,00 57,87 166.950,00 21.883,00 77.491,00 Source: INE.