Feasibility to convert an advanced PWR from UO
2
to a mixed U/ThO
2
core – Part I: Parametric studies
Jose R. Maiorino
a,b,⇑, Giovanni Laranjo Stefani
b, João M.L. Moreira
a,b, Pedro C.R. Rossi
a, Thiago A. Santos
b aCenter of Engineering, Modeling and Applied Social Sciences, Federal University of ABC, Santo André, SP, BrazilbPost-Graduate Program in Energy, Federal University of ABC, Santo André, SP, Brazil
a r t i c l e
i n f o
Article history:
Received 31 October 2016
Received in revised form 7 December 2016 Accepted 9 December 2016
Keywords:
Thorium PWR AP1000 Neutronics
a b s t r a c t
This work presents the neutronics and thermal hydraulics feasibility to convert the UO2core of the Westinghouse AP1000 in a (U-Th)O2core by performing a parametric study varying the type of geometry of the pins in fuel elements, using the heterogeneous seed blanket concept and the homogeneous con-cept. In the parametric study, all geometry and materials for the burnable poison were kept the same as the AP 1000, and the only variable was the fuel pin material, in which we use several mass proportion of uranium and thorium but keeping the enrichment in235U, as LEU (20 w/o). The neutronics calculations were made by SERPENT code, and to validate the thermal limits we used a homemade code. The opti-mization criteria were to maximize the233U, and conversion factor, and minimize the plutonium produc-tion. The results obtained showed that the homogeneous concept with three different mass proportion zones, the first containing (32% UO2-68%ThO2); the second with (24% UO2-76% ThO2), and the third with (20% UO2-80% ThO2), using235U LEU (20 w/o), and corresponding with the 3 enrichment zones of the AP 1000 (4.45 w/o; 3.40 w/o; 2.35 w/o), satisfies the optimization criteria as well as attending all thermal constrain. The concept showed advantages compared with the original UO2core, such a lower power den-sity, and keeping the same 18 months of cycle a reduction of B-10 concentration at the soluble poison as well as eliminating in the integral boron poison coated (IFBA).
Ó2016 Elsevier Ltd. All rights reserved.
1. Introduction
The feasibility of thorium utilization in PWRs has been demon-strated in nuclear power plants such as the PWR Indian Point Reac-tor number 1 (270 MWe), which was the first to utilize a core loaded with (U-Th)O2, with high enriched U (93 w/o), and
achiev-ing a maximum burn up of 32 MWD/kg HM (Maiorino and Carluccio, 2004). The last core of the Shippingport PWR was loaded with ThO2and (U-Th)O2fuel rods using the seed-blanket concept
and operated as a light water breeder reactor during 1200 effective full power days and reached a final burnup of 60 MWD/kg HM (Kasten, 1998). The experience on fabrication, post-irradiation analysis of thorium fuel from these developments had demon-strated the technical feasibility of the utilization of Thorium as fuel in PWR (IAEA, 2005; Maiorino and Carluccio, 2004).
The Radkowsky thorium fuel seed-blanket concept proposes a concept to be used in typical fuel elements of PWRs in which the seed is a U/Zr alloy, and the blanket an (Th0.9-U0.1)O2oxide using
low enriched uranium (Kasten, 1998).Herring et al. (2001)studied
the utilization of mixed thorium/uranium dioxide (U-Th)O2 in a
typical generation II PWR using a 1717 type fuel assembly.
The results showed that the (U-Th)O2cores could be burned to
about 87 MW day kg HM using 35 wt% UO2and 65 wt% ThO2with
an initial enrichment of about 7 wt.% of the total heavy metal fissile material, quite similar that obtained here.
A comprehensive research program about Th utilization in PWRs was conducted by the CDTN (Centro para o Desenvolvimento da Tecnologia Nuclear) in Brazil and the former KFA (Kern-forschungsanlage Juelich) in Germany aiming at analyzing and proving the option of thorium utilization in PWRs (NUCLEBRAS/ KFA, 1988). The program was conducted between 1979 and 1988, and defined core configurations of Th fuel cycles for standard 1300 MW Siemens PWRs; defined technical specifications for fuel technology of (U-Th)O2 and (Th-Pu)O2; studied fuel design and
modeling, including the fuel behavior in irradiation experiments at the FRJ-2 at KFA; studied the spent fuel treatment, including lab-oratory investigation on reprocessing spent thorium fuels with non-irradiated elements (NUCLEBRAS/KFA, 1988; Pinheiro, 2002). Similarly to other countries, Brazil is interested in the Thorium uti-lization in nuclear power reactors due to its large estimated reserves of this nuclear fuel (IThEO, 2014; Gentile, 1996).Table 1 presents current Th reserve estimations for the world while the
http://dx.doi.org/10.1016/j.anucene.2016.12.010 0306-4549/Ó2016 Elsevier Ltd. All rights reserved.
⇑ Corresponding author at: Center of Engineering, Modeling and Applied Social Sciences, Federal University of ABC, Santo André, SP, Brazil.
E-mail address:joserubens.maiorino@ufabc.edu.br(J.R. Maiorino).
Contents lists available atScienceDirect
Annals of Nuclear Energy
reasonable assured reserves for Brazil is 606,000 kt (IThEO, 2014). Moreover, the long-range expansion plans (EPE, 2007), predicts the construction of 4–8 new NPP, of 1000 MWe, and a PWR Generation III is the one with a potential to be selected as the next reactors to be constructed in Brazil.
More recently, many researchers turned their attention to Th fuel cycles in PWRs aiming at reducing the generation of minor actinide waste, at improving the nuclear power sustainability, and at better fuel utilization and breeding. A review of Thorium utilization as an option for advanced fuel cycles or as a primary energy source for electricity generation is discussed in the litera-ture (Maiorino and Carluccio, 2004; Maiorino et al., 2014).Ashley et al. (2014) discussed open cycles for thorium-fueled nuclear power systems, (Baldova et al., 2014a,b, 2016) discussed the use of high conversion Th-233U fuels in current generation PWRs in
the assembly and full core three-dimensional levels, andLindley et al. (2014a,b,c) studied thorium-fueled PWRs with reduced-moderation and possible closed fuel cycles. Similarly, IAEA and NEA have presented studies about the possible role of Th utiliza-tion in power reactors and the associated fuel cycles (IAEA, 2005; NEA, 2015). These studies were interested in assessing the feasibil-ity of using233U-Th fuels in PWR without worrying about how to
obtain the initial233U fuel load or the transition from an uranium
to a thorium core in the current nuclear power plants.
In this work we continue the studies reported above about the use of Th in Brazilian PWRs (Pinheiro, 2002; NUCLEBRAS/KFA, 1988) but considering a Generation III PWR design as the core con-figuration to introduce Th fuels. The chosen core is the Westing-house AP1000 which presents commercial success with units being and planned to be built in many countries. The objective is to obtain a transition core in which we convert the initial UO2core
to one with mixed (U/Th)O2,keep as much as possible the same
geometry and operational parameters for the fuel rods, fuel assem-blies, burnable poison, etc., and eventually obtain sufficient233U
for solely (233U-Th)O
2 fuel cycles. This work presents neutronic
and thermal hydraulic verifications of this initial transition core, which we denominated as AP-Th 1000.
In Section2we present the methods and data, in Section3the core modeling, in Section4the results and discussions and finally in Section5the conclusions.
2. Methods and data
A viable transition from the current UO2AP1000 core to one
with mixed U/Th fuels should be such that minimum changes occur on its current core design and operational parameters. Thus one could consider the following requirements in this study: pro-duce important amounts of 233U for future 233U/Th cores; keep
the current fuel assembly geometry, i.e., fuel rod diameter and pitch and meet the current thermal-hydraulic limits such as maximum center line fuel rod temperature and maximum linear power density in order to avoid as much as possible changes in the current design; keep the current fuel cycle length of 18 months,
and keep similar values of temperature coefficients of reactivity and kinetics parameters in order to maintain the current operation and economical parameters.
To do this it is necessary to search for a viable core configura-tion among many different alternatives bearing U/Th fuels. We do that through a parametric study in which we compare the dif-ferent operational and design core parameters of the U/Th core configurations against a reference AP1000 core configuration cho-sen as benchmark. In this study we undertake the following steps:
(1) Choose a AP1000 core configuration as the reference bench-mark to compare the several U/Th fuel configurations; (2) Establish a set of criteria based on design and operational
parameters of the AP1000 core. These criteria should ensure that minimum changes would occur with the new U/Th core configuration regarding plant operation, fuel assembly design variables, and sustainability. Thus this set of criteria will constitute requirements that the chosen U/Th configura-tion shall meet;
(3) Identify possible configurations of mixed U/Th fuel to intro-duce in the AP1000 core. To do this we consider two possible assembly configurations: homogenous (U-Th)O2assemblies
and heterogeneous seed-blanket approach with UO2in the
seed region and (U-Th)O2in the blanket region.
(4) Conduct core calculations at beginning of cycle (BOC) condi-tions and burnup calculacondi-tions to verify how the several U/Th core configurations meet the requirements. Choose the best configuration to make the transition core from UO2to mixed
U/Th core. This parametric study can be carried out with simplified core models due to the large amount calculation needed to be performed;
(5) Undertake detailed comparison of the chosen U/Th configu-ration with the AP1000 core in order to verify actual means of controlling the core excess reactivity along the fuel cycle. In the remainder of this section, we detail the above steps.
2.1. The AP1000 core
The AP1000 is an advanced PWR, which contains 157 fuel assemblies with three different enrichments regions as illustrated inFig. 1: region 1 with 2.35 w/o, region 2 with 3.40 w/o and region 3 with 4.45 w/o. This configuration, named in this work as config-uration A1, is taken as the reference AP1000 core configconfig-uration. The fuel assembly is a 1717 lattice containing UO2fuel pins,
guide tubes for the insertion of control rods, instrumentation,
Table 1
Higher estimations of thorium reserves in the word (IThEO, 2014).
Countries Th reserves (kt) Countries Th reserves (kt)
Brazila 1300 Canada 172
Turkey 880 Russia 155
Indiaa 846 South Africa 148
Australia 521 China 100
USAa 434 Greenland 93
Europea 430 Kazakhstan 50
Egypt 380 Rest of the world 1781
Venezuela 300 World 7590
positions for burnable poisons. The design considers two types of burnable poisons namely the Integral Fuel Burnable Absorber (IFBA), occupying fuel rod positions, and the Pyrex burnable poison, occupy-ing typical control rod positions. They are distributed in a complex manner over the three enrichment regions with the purpose of absorbing the excess core reactivity and avoiding high linear power densities along the cycle. Region 1 with lower enrichment bears no burnable poison, region 2 with intermediate enrichment bears a com-bination of IFBA and Pyrex burnable poisons, and region 3 with higher enrichment bears only the IFBA burnable poison.Fig. 2illustrates two of the possible alternatives of burnable poison distribution in the AP1000’s fuel assemblies, and more information can be found else-where (WESTINGHOUSE, 2011; Ames et al., 2009).
2.2. Set of criteria for the parametric study
The set of criteria adopted in this study to ensure minim changes due to the plant with the U/Th fuel is as follows:
(a) Produce the maximum amount of fissile233U at end of cycle
(EOC). This can be done by maximizing the conversion ratio, C;
(b) Generate minimum amount of fissile plutonium in order to reduce long lived waste generation (an important sustain-ability criterion for nuclear power).
(c) Ensure that the maximum center line fuel temperature and maximum linear power density do not exceed the values from the AP1000 reference core;
(d) Ensure that kinetics parameters and temperature coefficient of reactivity do not change significantly in order to maintain similar current AP1000 safety and transient behavior; (e) Ensure that the fuel cycle life is 18 months or longer.
The numerical values for items c and d for the reference AP1000 configuration are obtained out of core calculations detailed in Section3.
2.3. Core calculation
In order to choose a suitable code to perform the neutronics cal-culation, first we compared the calculation of AP 1000 core, using MCNP 6 (LANL, 2016) and SERPENT (Technical Research Centre of Finland, 2016) chosen due to their capability of conducting fuel depletion calculations, versatility and the reliability. The data library used in both codes were extracted from ENDF-B VII-1.
The core of the AP 1000 and the AP-Th1000 was modeled including the burnup poison and a 3D full core calculation was per-formed using SERPENT for BOC, for the main nuclear design param-eters, such as reactivity coefficients, maximum linear power density, fast neutron mean life time, and multiplication factor for several conditions, such as full power, zero power, cold and hot, with and without xenon.
3. Mixed oxide (U-Th)O2core modeling
To carry out the parametric study we utilized a simplified config-uration of the AP1000 core as the reference configconfig-uration. This UO2
core configuration, denoted by A2, is similar to the configuration A1 presented inFig. 1but without any type of burnable poison.
To determine the most appropriate U/Th core configuration, we considered two types of fuel assemblies, a homogeneous and a heterogeneous (seed-blanket) assemblies, as shown in Fig. 3. In the homogenous assembly all fuel positions carry mixed oxide (U-Th)O2fuel rods. In the heterogeneous assembly there are two
fuel regions: the first with a supercritical seed consisting of UO2
fuel rods, and the second with a subcritical blanket with (U-Th) O2 fuel rods. The235U enrichments for both assembly types are
always kept below 20 w/o.
We consider 20 different mass proportions of U and Th for the mixed oxide fuel in the parametric study: 15 heterogeneous and 5 homogenous. The U/Th core is also divided in three different regions with increasing assembly reactivity resembling the AP1000 configuration shown inFig. 1. In this way a similar fuel load pattern can be utilized for the mixed oxide U/Th cores. The reactivity of the U/Th assemblies is defined through235U
enrich-ment, and U and Th mass proportions. These configurations, simi-larly to configuration A2, bear no burnable poison.Tables 2 and 3 present the mass proportions for different isotopes at BOC for the heterogeneous and homogeneous U/Th configurations.
4. Results and discussions
4.1. Verification of the SERPENT model
The purpose of this verification is to infer how well we modeled the AP1000 core with the SERPENT code. When no complete set of published data about the AP1000 core had been found we comple-mented the verification and validation with comparisons against the MCNP6 code. We present inTable 4results for the keffof the
AP1000 reference core, at zero power, zero boron concentration in the coolant and at beginning of cycle, and for the k1of the fuel assembly with 4.45% enrichment at similar conditions. InTable 5 we present results for the Doppler and moderator temperature coefficients of reactivity, prompt generation time, effective delayed neutron fraction, and the maximum linear power density for the
AP1000. All results are compared with results provided by WESTINGHOUSE (2011).
To infer the accuracy of the SERPENT model for burnup calcula-tions we compare the results with those obtained with the MCNP6 code. Fig. 4 presents the keff as a function of burnup time for
450 days representing the first AP1000 operational cycle.
Fig. 3.Homogenous and heterogeneous assembly types considered in the parametric study.
Table 2
Mass proportions for the heterogeneous concept (seed-blanket) studied for the reactor regions.
Configuration Region 1 (w/o) Region 2 (w/o) Region 3 (w/o)
Isotopes 232Th 235U 238U 16O 232Th 235U 238U 16O 232Th 235U 238U 16O
THET-1 Seed – 8.91 79.2 11.7 – 13.5 74.7 11.9 – 17.6 70.5 11.9
Blanket 79.1 1.76 7.05 12.1 79.1 1.76 7.05 12.1 79.1 1.76 7.05 12.1
THET-2 Seed – 7.80 80.3 11.9 – 11.8 76.3 11.9 – 15.4 72.7 11.9
Blanket 79.1 1.76 7.05 12.1 79.1 1.76 7.05 12.1 79.1 1.76 7.05 12.1
THET-3 Seed – 4.46 83.7 11.8 – 6.74 81.4 11.9 – 8.81 79.3 11.9
Blanket 79.1 1.76 7.05 12.1 79.1 1.76 7.05 12.1 79.1 1.76 7.05 12.1
THET-4 Seed – 6.69 81.5 11.8 – 10.1 78.0 11.9 – 13.2 74.9 11.9
Blanket 79.1 1.76 7.05 12.1 79.1 1.76 7.05 12.1 79.1 1.76 7.05 12.1
THET-5 Seed – 5.8 82.3 11.9 – 8.5 79.7 11.9 – 11.0 77.1 11.9
Blanket 79.1 1.76 7.05 12.1 79.1 1.76 7.05 12.1 79.1 1.76 7.05 12.1
THET-6 Seed 17.6 7.13 63.4 11.9 17.6 10.8 59.7 11.9 17.6 14.1 56.4 11.9
Blanket 79.1 1.76 7.05 12.1 79.1 1.76 7.05 12.1 79.1 1.76 7.05 12.1
THET-7 Seed 72.1 3.17 12.6 11.9 65.0 4.58 18.3 11.9 57.1 6.17 24.7 12.0
Blanket 79.1 1.76 7.05 12.1 79.1 1.76 7.05 12.1 79.1 1.76 7.05 12.1
THET-8 Seed 43.9 8.81 35.2 12.0 35.1 10.6 42.3 12.0 26.4 12.3 49.3 11.9
Blanket 79.1 1.76 7.05 12.1 79.1 1.76 7.05 12.1 79.1 1.76 7.05 12.1
THET-9 Seed 8.79 8.02 71.3 11.9 8.79 12.1 67.2 11.9 8.79 15.9 63.5 11.9
Blanket 79.1 1.76 7.05 12.1 79.1 1.76 7.05 12.1 79.1 1.76 7.05 12.1
THET-10 Seed 17.6 7.13 63.4 11.9 17.6 10.8 59.7 11.9 17.6 14.1 56.4 11.9
Blanket 79.1 1.76 7.05 12.1 79.1 1.76 7.05 12.1 79.1 1.76 7.05 12.1
THET-11 Seed 26.4 6.24 55.5 11.9 26.4 9.43 52.3 11.9 26.4 12.3 49.3 11.9
Blanket 79.1 1.76 7.05 12.1 79.1 1.76 7.05 12.1 79.1 1.76 7.05 12.1
THET-12 Seed 43.9 4.46 39.6 12.0 43.9 37.3 6.73 12.0 52.9 7.04 28.1 11.9
Blanket 79.1 1.76 7.05 12.1 79.1 1.76 7.05 12.1 79.1 1.76 7.05 12.1
THET-13 Seed 52.7 3.57 31.7 12.0 52.7 5.39 29.9 12.0 52.7 7.05 28.2 12.0
Blanket 79.1 1.76 7.05 12.1 79.1 1.76 7.05 12.1 79.1 1.76 7.05 12.1
THET-14 Seed 35.1 10.5 42.3 12.0 26.4 12.3 49.3 12.0 17.6 14.1 56.4 11.9
Blanket 79.1 1.76 7.05 12.1 79.1 1.76 7.05 12.1 79.1 1.76 7.05 12.1
THET-15 Seed 43.9 8.81 35.2 12.0 35.1 10.6 42.3 11.9 26.4 12.3 49.3 12.0
The results fromTable 6show very good agreement with the reported Westinghouse results with discrepancies for keffand k1 varying from54 pcm to +79 pcm. The results fromTable 7show
reasonable agreement for the kinetics parameters and reactivity coefficients of temperature. The uncertainty interval in the Monte Carlo calculation regarding the maximum linear power density for configuration A1 at full power is (489, 549 W/cm) which includes the reference result for the AP1000 in the lower limit. The higher value for the maximum linear power density (q0
max) was expected
because the SERPENT calculation does not have thermal-hydraulic feedback and no temperature correction on the cross-sections. Thus the peak linear power density is larger than the reference cal-culation due to no consideration of localized Doppler broadening. Regarding burnup calculations, the kefffrom both MCNP6 and
SERPENT codes calculations presented inFig. 4are almost coinci-dent. Further discussions are presented in Section4.6. With these results we considered that the SERPENT code models for UO2and
mixed U/ThO2cores are sufficiently accurate to carry out the
envis-aged parametric study.
4.2. Reference parameters for the AP1000 core configuration
To perform the parametric study and determine which core configuration will reproduce better the AP1000 core one needs the set of values representative of the AP1000 core. We calculated the core parameters with the SERPENT code for a simplified config-uration of the AP1000, configconfig-uration A2: full power condition without burnable poison, without soluble boron and without con-trol rods.Table 6presents the reference parameters. The maximum fuel centerline temperature was obtained with the STH-MOX-Th code (Santos et al., 2016). Notice that the q0
maxis larger than that
of configuration A1 presented inTable 5due to no burnable poison is present in configuration A2. In Section4.6we further discuss these assumptions.
4.3. Determination of possible configurations to convert the UO2core
into an U/ThO2AP1000 core
The configurations considered for the parametric study were presented in Section3. The desired parameters for the analyses
are those presented inTable 6. For all 20 configurations we used the SERPENT code to perform three-dimensional full core neu-tronic and burnup calculations. The maximum fuel centerline tem-perature was calculated with the STH-MOX-Th code. The results obtained for core reactivity parameters and thermal-hydraulic lim-its are given inTable 7, and those for mass results, inTable 8.
These results were compared with the reference AP1000 config-uration shown inTable 6in order to identify possible configura-tions to convert UO2 AP1000 cores to mixed U/ThO2 cores. To
facilitate the data analysis the results presented in Table 7 are ordered according to EOC keff(largest to smallest), q0max(smallest
to largest) and BOC keff(smallest to largest); and those ofTable 8
are ordered according to BOC235U (smallest to largest), EOC233U
(largest to smallest) and EOC239Pu (smallest to largest).
Table 3
Mass proportion for the homogeneous concept studied for the reactor regions.
Confi-guration Region 1 (w/o) Region 2 (w/o) Region 3 (w/o)
Isotopes 232Th 235U 238U 16O 232Th 235U 238U 16O 232Th 235U 238U 16O
THOM-1 73.8 2.82 11.3 12.1 66.8 4.23 16.9 12.1 59.8 5.64 22.6 12.0
THOM-2 61.5 2.79 23.6 12.0 61.5 4.04 22.4 12.0 61.5 5.28 21.1 12.0
THOM-3 57.1 3.26 27.6 12.0 57.1 4.71 26.1 12.0 57.1 6.17 24.7 12.0
THOM-4 65.9 2.32 19.7 12.0 65.9 3.37 18.7 12.0 65.9 4.41 17.6 12.0
THOM-5 48.3 3.14 36.5 12.0 48.3 4.55 35.1 12.0 48.3 5.95 33.7 12.0
Table 4
Comparison of the effective multiplication factor and infinite multiplication factor for the AP1000, configuration A1, at BOC.
Reference valuea MCNP6 SERPENT
k1for the fuel assembly
a(4.45 w/o)
Value 1.328 1.32797 ± 0.00022 1.32758 ± 0.00062
Uncertainty 2 pcm 24 pcm
kefffor configuration A1 (zero power, cold core)
Value 1.205 1.20450 ± 0.00009 1.20421 ± 0.00051
Uncertainty 34 pcm 54 pcm
kefffor configuration A1 (full power)
Value 1.0 – 1.00079 ± 0.00003
Uncertainty +79 pcm
a Results fromWESTINGHOUSE (2011).
Table 5
Comparison of neutronic parameters at BOC between the AP1000 resultsaand the
SERPENT model.
Parameter AP1000a SERPENT AP1000
Doppler reactivity coefficient,aF (pcm/°F)
3.5 to 1.0
2.87 ± 0.14 to 0.91 ± 0.14 Moderator reactivity coefficient,aM
(pcm/°F)
0 to35 (3.72 ± 0.47) to (25.06 ± 0.53)
Prompt neutron mean generation time
Value (ls) 19.8 25.7 ± 3.8
Discrepancy +5.9ls or +30%
Effective delayed neutron fraction
Value 0.0075 0.00694 ± 0.00124
Discrepancy 0.00056 or7.5%
Maximum linear power density for configuration A1 (full power)
Value (W/cm) 489 519 ± 30
Discrepancy +30 W/cm or +6%
aWESTINGHOUSE (2011).
Analyzing the results given in Table 7, we notice that the heterogeneous configurations, with seed-blanket fuel elements, satisfy the neutronic constraints but do not satisfy the thermal-hydraulic limits. 17 of them have EOC keffgreater than 1.05000,
which indicate that they can potentially meet the end of cycle core reactivity requirement. However, the maximum linear heat gener-ation rates of all heterogeneous configurgener-ations are greater than the reference result, and consequently the fuel centerline temperature. For the homogeneous case, the situation is completely different. All configurations satisfy neutronics and thermal-hydraulic limits with exception of THOM-4, which does not have enough reactivity at the end of life. We choose THOM-1 as the preferred configura-tion to carry out the study because it has the closest EOC keffto
the reference AP1000. We notice that all configurations present conversion ratio greater than that of the AP1000 reference core and the effective delayed neutron fraction similar to it. In Sec-tion4.6we further discuss other alternatives and the final actinide masses presented inTable 8.
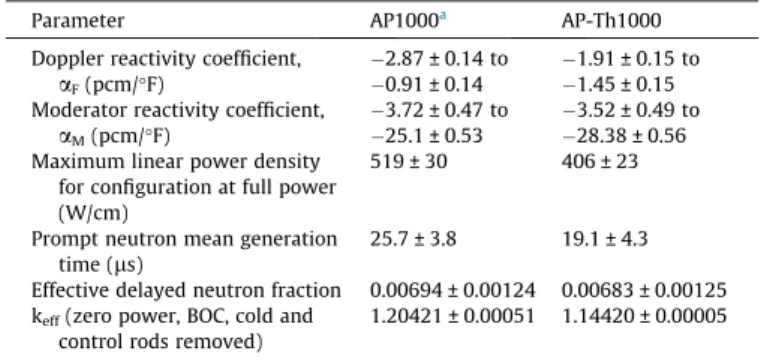
4.4. Comparison between AP-Th1000 and AP1000 at BOC
Once THOM-1 was selected as the feasible configuration, we modeled the AP-Th1000 core to compare its behavior with the actual AP1000 18 month cycle. The purpose here is to define possible means of core reactivity control throughout the cycle,
namely the boron concentration and burnable poison options, and verify results of temperature coefficients of reactivity and kinetics parameters. The AP1000 configuration is A1.
The chosen AP-Th1000 core configuration resembles typical cores with three enrichment zones but substituting enrichment for mass proportion of Th and U. The235U enrichment is 20 w/o
,
and the three mass proportion zones contain the following mix-tures: (32 w/o UO2– 68 w/o ThO2), (24 w/o UO2– 76 w/o ThO2),
and (20 w/o UO2– 80 w/o ThO2). InTables 9 and 10we compare
these results at BOC for the AP1000 and AP-Th1000 obtained with the SERPENT code model. In this way we can observe what differ-ences in core parameters the mixed Th/U fuel introduces without any modeling interference.
The maximum centerline fuel temperature and DNBR was cal-culated with STH-MOX-Th code yielding TCL= 1615°C and
mini-mum DNBR of 2.85 (Santos et al., 2016).
4.5. Core reactivity behavior of the AP-Th1000 as a function of burnup
Fig. 5presents the behavior for the keffas a function of burnup
(in days) for the AP1000 and AP-Th1000. Since the Thorium core has a lower initial keffit does not require as much burnable poison
as the AP1000 core. Thus we kept the same positions for the IFBA burnable poison in the core but considered three different10B
con-centrations in the ZrB2: 50 w/o, 20 w/o and 0 w/o, i.e., without
IFBA. One can observe that the AP-Th1000 core requires less burn-able poison to control the core reactivity throughout the cycle. It is even possible to remove all IFBA burnable poison from the core. We further discuss these issues in Section4.6.
4.6. Discussions
4.6.1. Reference parameters for the AP1000 core configuration
The accuracy of all parameters presented in Tables 4 and 5 depends on the cross-section library, and neutronic details of the calculation. The SERPENT model does not account for thermal-hydraulic feedback on the materials cross sections and the power distribution calculation. The model utilized in this work is based on uniform temperature distribution for the fuel and moderator regions. Thus its results does not account properly for the larger Doppler broadening effect in the high fuel temperature regions of the core nor the variation of neutron moderation due to the coolant
Table 6
Reference parameters for the parametric study. The AP1000 parameters were obtained with the SERPENT code for configuration A2 at full power.
Parameter Value
BOCakeff 1.31954
EOCbkeff 1.05753
Conversion ratio at BOC, C 0.67
beff 0.00694
q0
max(W/cm) 559
Maximum fuel centerline temperature, TCL(°C) 1926
BOCa235U mass (kg) 2866
EOCb235U mass (kg) 1503
EOC239Pu mass (kg) 370
EOC241Pu mass (kg) 48
EOC233U mass (kg) 0.0
aBOC: beginning of cycle. b EOC: end of cycle.
Table 7
Neutronics and thermal-hydraulics results for the several configurations.
Configuration BOCakeff EOCbkeff C beff q0
max(W/cm) Fuel TCL(°C)
THET-1 1.28696 1.17155 0.87 0.00683 868 3169
THET-2 1.27596 1.13116 0.83 0.00682 934 3454
THET-14 1.25263 1.12293 0.84 0.00679 879 2703
THET-9 1.25958 1.1221 0.83 0.0068 809 2432
THET-15 1.2435 1.11734 0.83 0.00679 804 2481
THET-4 1.26282 1.11119 0.81 0.00683 862 3139
THET-10 1.23899 1.10102 0.83 0.00681 806 2418
THET-6 1.23898 1.10072 0.83 0.0068 813 2445
THET-8 1.2323 1.10032 0.83 0.00678 781 2325
THOM-3 1.25712 1.08906 0.80 0.00681 526 1457
THOM-5 1.25808 1.08449 0.80 0.00678 533 1479
THET-11 1.21853 1.07925 0.82 0.00681 794 2370
THOM-1 1.22064 1.05957 0.82 0.00679 537 1490
THET-5 1.24808 1.08949 0.80 0.00681 790 2925
THET-3 1.22475 1.05729 0.78 0.00685 728 2578
THOM-2 1.21581 1.0502 0.79 0.0068 538 1494
THET-12 1.16951 1.02495 0.80 0.0068 713 2071
THOM-4 1.16319 1.00498 0.81 0.00683 589 1651
THET-13 1.13681 0.99744 0.81 0.0068 613 1729
THET-7 1.23232 0.98116 0.76 0.00675 840 2539
temperature change in the axial direction. The impact of this approximation is verified inTables 4 and 5for k1, keff, reactivity coefficients of temperature, kinetics parameters, and maximum linear power density. For k1and kefffor both cold and at power conditions, the comparisons between the MCNP6 and SERPENT codes with the Westinghouse results are very good. Thus, this approximation for integral core parameters does not have impor-tant impact. For the power density distribution, which is a local
parameter largely influenced by the Doppler broadening effect, the discrepancy presented by the SERPENT code (+6%) is mainly due to this model simplification.
The other core parameters are also integral parameters and tend to be less influenced by this uniform temperature distribution approximation. The Doppler and moderator temperature coeffi-cients of reactivity span quite similar intervals. For the prompt neutron generation time the discrepancy is large (+30%). The calcu-lation of this parameter is strongly influenced by the energy dis-cretization utilized since it is primarily dependent on the 1/v (v = neutron speed) weighted integral (Henry, 1958; Moreira and Lee, 1988). The SERPENT code point wise treatment of the energy variable tends to yield good results for the prompt generation time. The discrepancy on the effective delayed neutron fraction pre-sented inTable 5should be due to the physical fractions utilized in the calculations since for large PWRs the neutron leakage in the core is very small (Moreira and Lee, 1984, 1988).
Due to these sufficiently good results obtained with the SERPENT code, to investigate the impact of the introduction
Table 8
Uranium and plutonium mass results for the several configurations.
Configuration BOCa235U EOCb239Pu EOC241Pu EOC235U EOC233U
Mass (kg) Mass (kg) Mass (kg) Mass (kg) Mass (kg)
THET-7 2784 99 21 1394 515
THET-13 3062 126 21 1649 587
THOM-4 3154 136 21 2239 538
THET-12 3353 138 21 1893 543
THET-3 3583 208 26 2118 381
THOM-2 3785 156 21 1687 476
THET-5 4073 205 22 2657 371
THOM-1 3964 132 17 2382 505
THOM-5 4283 210 24 2812 378
THOM-3 4416 175 20 2709 425
THET-11 4626 171 19 3077 469
THET-4 4887 210 21 3321 363
THET-15 5116 154 16 3521 484
THET-6 5148 184 19 3568 436
THET-10 5148 184 19 3569 435
THET-8 5284 155 16 3686 485
THET-2 5539 210 19 3937 357
THET-9 5669 196 18 4064 400
THET-14 5807 167 16 4180 451
THET-1 7895 229 14 6238 348
a BOC: beginning of cycle. b EOC: end of cycle.
Table 9
Comparison of the neutronic core parameters between AP1000 configuration A1 and AP-Th1000 at BOC.
Parameter AP1000a AP-Th1000
Doppler reactivity coefficient, aF(pcm/°F)
2.87 ± 0.14 to 0.91 ± 0.14
1.91 ± 0.15 to 1.45 ± 0.15 Moderator reactivity coefficient,
aM(pcm/°F)
3.72 ± 0.47 to 25.1 ± 0.53
3.52 ± 0.49 to 28.38 ± 0.56 Maximum linear power density
for configuration at full power (W/cm)
519 ± 30 406 ± 23
Prompt neutron mean generation time (ls)
25.7 ± 3.8 19.1 ± 4.3
Effective delayed neutron fraction 0.00694 ± 0.00124 0.00683 ± 0.00125 keff(zero power, BOC, cold and
control rods removed)
1.20421 ± 0.00051 1.14420 ± 0.00005
a FromWESTINHOUSE (2011).
Table 10
Boron concentration at BOC for the AP1000 configuration A1 and AP-Th1000.
Operational condition Boron concentration (ppm)
AP1000a AP-Th1000
Zero power, BOC, hot, without Xe, and control rods removed
1502 1200
Full power, BOC, hot, without Xe, and control rods removed
1184 1000
Full power, BOC, hot, equilibrium Xe, and control rods removed
827 650
Zero power, hot, and control rods removed 1574 1400
a FromWESTINHOUSE (2011).
of U/ThO2in the AP1000 core we took them as base of comparison
with the AP1000 core. In this way we avoid modeling dependent differences in the comparison between the AP-Th1000 and AP1000 cores.
4.6.2. Best configuration for the AP-Th1000 core
The configurations based on the Radkowsky concept present good reactor physics properties but the highest peak linear power densities. They were dismissed simply because of thermal-hydraulic limits, i.e., high maximum centerline fuel temperature. Among the configurations with EOC keffgreater than 1.05000 the
q0
maxwas always larger than the reference AP1000 value (559 W/
cm) by 30–67%.
Among the homogenous configurations studied 4 met the crite-rion of EOC keffgreater than 1.05000. Even the discarded THOM-4
configuration can be considered of interest since it has an EOC keff
slightly lower than the imposed limit. The THOM-3 and THOM-5 present high EOC keff, between 1.08400 and 1.09000, and are
cer-tainly interesting under the point of view of extending the opera-tional cycle beyond 18 months or other in core fuel management criteria. However, such high burnup levels are beyond the current established fuel burnup limits.
The THOM-1 and THOM-2 configurations present EOC keffvery
similar to the AP1000’s which favor keeping the reactivity control parameters as similar as possible to the reference AP1000 refer-ence core. THOM-1 has the largest conversion ratio among the homogenous configurations (C = 0.82) and thus produces more
233U at EOC. Additionally it produces less239Pu, which is
interest-ing under the point of view of reduction of long-lived waste gener-ation and radiotoxicity. Thus, the THOM-1 configurgener-ation was the one chosen to form the mixed U/ThO2AP-Th1000 core.
4.6.3. Use of the Radkowsky concept
The seed-blanket concept present high conversion ratio (13 of the configurations present C > 0.80) and consequently allow extended burnup cycles (9 of the 20 studied configurations present the largest EOC keff). To use this concept and take advantage of its
reactor physics characteristics, some of the thermal-hydraulic design variables or/and fuel materials need to be changed. For example, the mass flow rate would have to be increased to improve coolant heat removal or the thermal-hydraulic channel dimensions and fuel material would have to be changed as it was done in the original Radkowsky concept. They have used U-Zr fuel with smaller fuel rod diameter and larger flow area for the coolant channel dimension (Kasten, 1998) But in this case, any of these solutions would not conform with the purpose of this research because the current fuel assembly design used in the AP1000 would have changed.
4.6.4. Comparison between AP-Th1000 and AP1000
The keffat EOC for the AP-Th1000 core with different IFBA
burn-able poison concentrations are similar to the reference AP1000 (WESTINGHOUSE, 2011) as shown in Fig. 5. The figure shows clearly that the APTh-1000 core may not require the IFBA burnable poison. This would simplify the fuel assembly design and core loading during refueling. On the other hand, if one opts for10B
con-centrations between 50% and 20% in the IFBA, the core excess reac-tivity throughout the cycle will be much lower than the current AP1000. The requirement of soluble boron during the whole cycle will decrease facilitating operational procedures, and reducing radioactive waste generation. This is an important operation advantage of the Th/U cycles.
The maximum linear power density is lower than the AP 1000’s by 22%, which indicates better safety conditions. This lower q0
max
reduces maximum centerline fuel temperature (TCL) and increases
DNBR. The maximum TCL is lowered also because mixed Th/U
oxides have higher thermal conductivity than UO2 (IAEA, 2006).
This lower q0
maxalso indicates that mixed Th/U oxide cores allow
higher nominal thermal powers (around 4000 MWth). This would
approximate it to the advanced PWRs (CAP 1400) operating at 4058 MWth with q0max equal to 470.6 W/cm (Lin Tian, 2013; WNA, 2016a,b).
Moreover, by imposing the criteria of maximizing the produc-tion of fissile233U and minimizing the production of fissile
pluto-nium, as well as the conversion ratio, the AP-Th 1000 could be used in a closed U-Th fuel cycle. Although we just calculated the first operational cycle, with the calculation of the in core fuel man-agement on going, we notice that per cycle we expected to produce around 500 Kg of233U, and an average burn up of discharge of the
order 60 MWD/ kg HM.
Thus, these thermal-hydraulic advantages and operational sim-plifications indicate possible good economics for the AP-Th1000 core.
5. Conclusions
From the results obtained, we may conclude that it is feasible to convert the AP 1000 to use mixed oxide of thorium uranium, with-out changing practically none changes in the core structure and reactivity control systems, only changing the pellet material.
Although, we did not utilize any optimization techniques, we found a mass proportion in the three core regions, the first contain-ing (32% UO2-68%ThO2), the second with (24% UO2-76% ThO2), and
the third with (20% UO2-80% ThO2), using235U LEU(20 w/o), and
corresponding with the 3 enrichment zones of the AP 1000(4.45 w/o; 3.40 w/o; 2.35 w/o) which satisfies all thermal hydraulics constrain, even with advantages such as a lower power density, which favor safety, or could allow to increase the nominal thermal power. Also the reduction of boron soluble and eliminating the IFBA burnup poison is a differential in our concept, since it will favor technological and operational simplifications, with eco-nomics consequences.
Moreover, by imposing the criteria of maximizing the produc-tion of fissile233U and minimizing the production of fissile
pluto-nium, as well as the conversion ratio, the AP-Th 1000 could be used in a closed U-Th fuel cycle. Although we just calculated the first operational cycle, with the calculation of the in core fuel man-agement on going, we notice that per cycle we expected to produce around 500 Kg of233U, and an average burn up of discharge of the
order 60 MWD/ kg HM.
Finally, for Brazil that has a huge reserve of thorium, a con-verted advanced PWR with thorium utilization could be an option for the future, although still needing to make an economic evalua-tion of the concept and define the in core fuel management to demonstrate that the discharge burn up is going to achieve the expected values of 60 MWD/Kg HM.
Also in part II of this work, we intend to present a detailed cal-culation for the AP-Th 1000, and discuss the fuel behavior of mixed (U-Th)O2. Additional work is needed for the implementation of
Thorium in reactor cores, for example, reactivity coefficients in accident conditions, and fuel behavior in case of LOCA (e.g. fuel relocation after ballooning), etc.
Therefore, we recommend that the studies of thorium utiliza-tion in PWR be taken seriously, and at short range be implemented as an option for those countries with significant reserves of thorium.
Acknowledgements
References
Ames, D.E., Tsvetkov, P.V., Rochau, G.E., Rodriguez, S., 2009. High Fidelity Nuclear Energy System Optimization Toward an Environmentally and Secure Energy Source. Sandia National Laboratory, Albuquerque, New Mexico and Livermore, California.
Ashley, S.F., Lindley, B.A., Parks, G.T., Nuttall, W.J., Gregg, R., Hesketh, K.W., Kannan, U., Krishnani, P.D., Singh, B., Thakur, A.M., Cowper, M., Talamo, A., 2014. Fuel cycle modelling of open cycle thorium-fueled nuclear energy systems. Ann. Nucl. Energy 69, 314–330.
Baldova, D., Fridman, E., Shwageraus, E., 2014a. High conversion Th-U233 fuel for current generation of PWRs: Part I – Assembly level analysis. Ann. Nucl. Energy 73, 552–559.
Baldova, D., Fridman, E., Shwageraus, E., 2014b. High conversion Th-U233 fuel for current generation of PWRs: Part II – 3D full core analysis. Ann. Nucl. Energy 73, 560–566.
Baldova, D., Fridman, E., Shwageraus, E., 2016. High conversion Th-U233 fuel for current generation of PWRs: Part III – Fuel availability and utilization considerations. Ann. Nucl. Energy 87, 517–526.
EPE – EMPRESA DE PESQUISA ENERGÉTICA, 2007. Plano Nacional de Energia 2030 v7-Geração Termonuclear, EPE/MME, Brasilia, pp. 1–144.
Gentile, E., 1996. Radioactive minerals diagnosis. In: Brazilian Association of Metallurgy and Materials, in Portuguese.
Henry, A.F., 1958. The application of reactor kinetics to the analysis of experiments. Nucl. Sci. Eng. 3, 52–70.
Herring, J.S., MacDonald, P.H., Weaver, K.D., Kullberg, G., 2001. Low cost, proliferation resistant, uranium thorium dioxide fuels for light water reactors. Nucl. Eng. Des. 203, 65–85.
IAEA, 2005. Thorium Fuel Cycle – Potential Benefits and Challenges. IAEA-TECDOC-1450. IAEA, Vienna.
IAEA, 2006. Thermophysical Properties Database of Material for Light Water Reactors and Heavy Water Reactors. IAEA-TECDOC-1496. IAEA, Vienna. IThEO, International Thorium Energy Organization, 2014. Thorium Resources
Available at:<http://www.itheo.org/thoriumresources>.
Kasten, P.R., 1998. Review of the Radkowsky thorium reactor concept. Sci. Glob. Secur. 7, 237–269.
LANL, 2016. A General Monte Carlo N-Particle (MCNP) Transport Code [Online] Available at: <https://mcnp.lanl.gov/>.
Lin Tian, CAP1400 Design &Construction. <https://www.iaea.org/NuclearPower/ Downloadable/Meetings/2013/2013-06-24-06-28-TM-NPTD/14-snerdi.pdf>. Lindley, B.A., Ali Ahmad, N., Zainuddin, Zara, Franceschini, Fausto, Parks, Geoffrey T.,
2014a. Steady-state and transient core feasibility analysis for a thorium-fueled
reduced-moderation PWR performing full transuranic recycle. Ann. Nucl. Energy 72, 320–337.
Lindley, B.A., Franceschini, Fausto, Parks, Geoffrey T., 2014b. The closed thorium– transuranic fuel cycle in reduced-moderation PWRs and BWRs. Ann. Nucl. Energy 63, 241–254.
Lindley, B.A., Fiorina, C., Franceschini, F., Lahoda, E.J., Parks, G.T., 2014c. Thorium breeder and burner fuel cycles in reduced-moderation LWRs compared to fast reactors. Prog. Nucl. Energy 77, 107–123.
Maiorino, J.R., Carluccio, T., 2004. A review of thorium utilization as an option for advanced fuel cycles – potential option for Brazil in the future. In: ANES 2004: Americas Nuclear Energy Symposium, Miami Beach, Florida, USA.
Maiorino, J.R., Moreira, J.M.L., Laranjo, S.G., Busse, A., Santos, T., 2014. Thorium as a new primary source of nuclear energy. In: IX Congresso Brasileiro de Planejamento Energético (CBPE), SBPE, Florianópolis, Brasil.
Moreira, J., Lee, J.C., 1988. Accuracy of the modal-local method for reactivity determination. Nucl. Sci. Eng. 98, 244–254.
Moreira, J., Lee, J.C., 1984. Space-time analysis of reactor control-rod worh measurements. Nucl. Sci. Eng. 86, 91–105.
NUCLEBRAS/KFA, 1988. Program of Research and Development on the Thorium Utilization in PWR – Final Report. JUL-SPEZ 488/NUCLEBRAS-CDTN 600-88/ Jülich-KFA.
OECD Nuclear Energy Agency, 2015, Introduction of Thorium in the Nuclear Fuel Cycle: Short- to Long-term Considerations, NEA No. 7224.
Pinheiro, R.B., 2002. Brazilian experience on thorium fuel cycle investigations. In: IAEA Thorium Fuel Utilization: Options and Trends, TECDOC-1319. International Atomic Energy Agency (IAEA), Vienna, pp. 13–24.
Santos, T.A., Maiorino, J.R., Laranjo, S.G., 2016. On the thermal limits for PWR calculation in operational conditions using a mono channel, mono phasic model for mixed thorium-uranium oxide fuel. In: 16th Brazilian Congress of Thermal Sciences and Engineering – Proceedings of ENCIT 2016, ABCM, Vitoria, E.S. Brazil.
Technical Research Centre of Finland, 2016. SERPENT a Continuous-energy Monte Carlo Reactor Physics Burnup Calculation Code Available at:<http://montecarlo. vtt>.
WESTINGHOUSE, 2011, Westinghouse AP1000 Design Control Document Rev. 19. Westinghouse Electric Corporation. Available at: <http://pbadupws. nrc.gov/docs/ML1117/ML11171A500.html>.
WNA, World Nuclear Association, 2016a. Advanced Nuclear Power Reactors Available at: <http://www.world-nuclear.org/information-library/nuclear-fuel-cycle/nuclear-power-reactors/advanced-nuclear-power-reactors.aspx>. WNA, World Nuclear Association, 2016b. Nuclear Power in China Available at: