CASE STUDY: COMPANY VALUATION OF HAITONG
BANK S.A.
Zhang Rui
Projectsubmitted as partial requirement for the conferral of Master in Finance
Supervisor:
Prof. Pedro Leite Inácio, ISCTE Business School, Finance Department
CA
SE
S
T
U
D
Y
: CO
M
PA
N
Y
V
A
L
U
A
T
IO
N
O
F
H
A
IT
O
N
G
BA
N
K
S
.A
.
ZH
A
N
G
R
U
I
Abstract
In the past year, Chinese companies were more and more positive to participate in the international business activity. For instance, in global cross-border Mergers & Acquisitions, China became the second largest global investor behind the United States with US$ 140 billion in completed M&A transactions in 2016. The popular targets for Chinese buyers in 2016 were industrial, high tech, financials, and entertainment. Hence it is interesting to select a Chinese company, Haitong Bank S.A., and understand its performance after-acquisition. The analysis of Haitong Bank, which included estimating its equity value and comparing it with its peers, could be a reference for the investors in Haitong Bank S.A., making them consider whether they should continue to invest in Haitong Bank S.A.
In the valuation process, the change of business model of Haitong Bank and the cost reduction strategy had a significant impact on the final outcomes.
In this study, the final recommendation for the investor is to continue investing.
Keywords:
Equity Value, Free Cash Flow Model, Multiples;Resumo
Nos últimos tempos, as empresas chinesas participaram mais nos negócios a nível internacional. Por exemplo, a nível das fusões e aquisições internacionais a China foi o segundo maior investidor logo depois dos Estados Unidos, tendo atingido um volume global de US$ 140 biliões de transações realizadas. Os alvos mais habituais para os compradores Chineses em 2016 foram empresas industriais, de alta tecnologia, instituições financeiras e empresas de entertinimento. Daí que seja interessante escolher uma empresa chinesa, Haitong Bank S.A., e analisar a sua performance após a sua aquisição. A análise do Haitong Bank, que inclui a estimative do seu valor e a sua comparação com outras empresas do sector, pode ser uma referência para ajudar os investidores a decider se devem ou não continuar a investir naquela instituição financeira.
No processo de avaliação a mudança do modelo de negócio do Banco e a estratégia de redução de custos têm um impacto significativo nos resultados obtidos.
Neste estudo a recomendação final para os imvestidores é que devem continuar a investir na empresa.
Palavras Chave:
Valor dos Capitais Próprios, Cash Flow Livre para os Acionistas.Múltiplos.
Acknowledgements
This study could not be finished without the support and help of some people. At the first, I would like to thank my supervisor Prof. Pedro Inácio for his guidance and help during the whole writing process of my study. Meanwhile, I also would like to thank my sister and parents, encouraging and supporting me throughout the entire study. At last, I also would like to thank my friends, who inspired me when I was confused and understood that I could not be with them as often as usual.
Index of Content
Abstract ... i
Resumo ... ii
Acknowledgements ... iii
1. Introduction ... 1
2. The acquisition of Haitong Securities for BESI and its development ... 3
2.1. Haitong Securities ... 3
2.2. Banco Espirito Santo de Investimento (BESI) ... 5
2.3. Development after the Acquisition ... 8
3. Literature Review ... 12
3.1. Corporate Valuation ... 13
3.1.1. Discounted Cash Flow Valuation ... 13
3.1.2. Relative Valuation (Multiples) ... 16
3.2. Valuating Financial Institutions ... 17
3.2.1. Discounted Cash Flow Valuation ... 17
3.2.2. Relative Valuation (Multiples) ... 20
3.3. Valuating Distressed Companies ... 21
4. Equity Valuation ... 23
4.1. The M&A Sector ... 23
4.2. Introduction of Haitong Bank S.A. ... 28
4.3. Financial Analysis ... 30
4.4. Valuation of Haitong Bank S.A. ... 37
4.4.1. Forecast for the Next Five Years ... 37
4.4.2. Required Rate of Return of the Investors (Cost of Equity) ... 41
4.4.3. Discounted Cash Flow to Equity ... 44
4.4.4. Relative Valuation (Multiples) ... 44
4.4.5. Comparison Between Methods ... 47
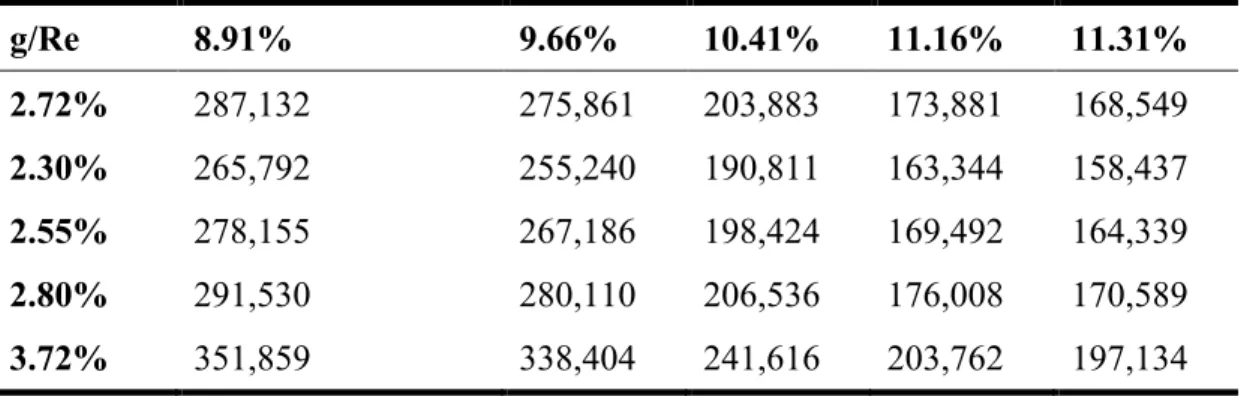
4.4.6. Sensitivity Analysis ... 47
5. Future of Haitong Bank S.A. ... 49
7. Bibliography ... 54 8. Appendix ... 56
Index of Table Content
Table 2-1 - Acquisition Process of Haitong Securities for Banco Espirito Santo de Investimento
Table 4-1 – Important Ratios
Table 4-2 - The Growth Rates of some Important Items Table 4-3 - The Rate of Return of Investors
Table 4-4 - Discounted Cash Flow to Equity Table 4-5 - Multiples
Table 4-6 - Comparison of Methods Table 4-7 – Sensitivity Analysis
Index of Figure Content
Figure 2-1 - the Relationship between Haitong Securities and BESI. Figure 2-2 - Business model of Haitong Bank S.A
Figure 4-1 - M&A Deals by Volume and Value Figure 4-2 - The Volume and Value of China M&A
1. Introduction
The main objective of this study is to estimate the performance of Haitong Bank S.A. after the acquisition and to evaluate whether the acquisition of Haitong Securities for Banco Espirito Santo de Investimento (BESI) is valuable or not. Using different valuation methods, we will be able to find out if the investor should continue to invest in this company?
The reasons for valuating Haitong Bank S.A. are, as follows:
1) This is the first case in which a Chinese Securities firm purchased an investment bank headquartered in Europe. Therefore, it sets the precedent for Chinese Securities firms entering in the European and American investment banking sector. The acquisition has great strategic importance for both Haitong Securities and BESI. 2) The acquisition price was lower than the net asset value. In 8th, December 2014,
Haitong Bank announced to acquire BESI with 379 million euros. However, at the end of June 2014, the net asset value of BESI was 618 million euros. The acquisition price provided by Haitong Securities was around 60% of the net assets of BESI. Seemingly, the acquisition price undervalued the real value of BESI.
3) The finance crisis of Banco Espirito Santo (BES). The parent company Banco Espirito Santo, entered in a financial crisis when it delayed the payment of interest of the group’s short-term debt and then triggered its debt default. This financial
crisis also affected its subsidiary BESI, causing a loss 3.58 billion euros, in 2014. This negative impact of the financial crisis could have continued in the following years after the acquisition by Haitong Bank S.A..
4) Availability of data. Before the acquisition, BESI was a listed company in Lisbon Stock Exchange, which means it is possible to find the historical data of BESI. In terms of Haitong Securities, it listed on the Shanghai Stock Exchange and Hong Kong Stock Exchange, its data is available too. After acquisition, the financial data of Haitong Bank S.A. may also be found on its website.
The case study can be a reference for the investors in Haitong Bank S.A., making them consider if they should continue to invest in Haitong Bank S.A.
2. The acquisition of Haitong Securities for BESI and its
development
In this part, we are going to review the acquisition process in more detail and present the development of Haitong Bank after the acquisition.
2.1. Haitong Securities
Haitong Securities was established in 1988 and completed the share reform in 2001. In 2007, Haitong Securities was listed in the Shanghai Stock Exchange through backdoor listing. After that, it started to trade on the Hong Kong Stock Exchange in 2012. In short, the equity capital structure of Haitong Securities is as follows: 70.36% class A shares and the remaining 29.64% class H shares. While A shares are traded on the Shanghai Stock Exchange H shares are traded on the Hong Kong Stock Exchange. In this study, we are going to analyze just the H shares of Haitong Securities.
Currently, Haitong Securities is the second largest Chinese securities company. It provides a comprehensive service for its clients in 14 countries, including, for instance, brokerage, investment banking, asset management services.
The net income of Haitong Securities reached 7,710 million RMB in 2014, 15,838 million RMB in 2015 and 8,043 million RMB in 2016. Besides, the total assets of Haitong Securities were 352 billion RMB in 2014 and increased to 560 billion RMB in 2015 and 576 billion RMB in 2016.
Considering BESI’s acquisition, Haitong Securities had several strong motivations: 1) Conformation to the internationalization strategy. In order to develop Haitong
Securities’ international strategy, it acquired Dafu Securities to hold Hong Kong’s business. Following that, Haitong Securities acquired Hong Kong Hengxin to strengthen its position in Hong Kong market in 2013. And then Haitong Securities bought Japan Invest to operate business in the Japanese Market. But it still had a lack of opportunity to explore European and North American Market. Additionally, the overseas revenue increased dramatically from 1,006 million RMB in 2012 to 2,528 million RMB in 2014, and 6,002 million RMB in 2015 and 7,813 million RMB in 2016. The growth of overseas revenue promoted Haitong Securities to accelerate its international process.
2) The recovery of the economy. Due to the global and euro crisis, Portugal accepted the financial support From Europe Unit, the European Central Bank and International Monetary Fund in 2011. And it had dropped out from the program since the economy was recovering. At the same time, Moody’s enhanced the rating of Portugal from Ba2 to Ba1. The positive macroeconomic environment was a good sign
3) Investment Businesses of BESI. As it is known, BESI is a full-licensed investment bank. Over 50% of its operating revenues come from the investment bank business. Besides, it had been awarded “the best investment bank in Portugal” for years. BESI had a professional and excellent investment banking team and sufficient
resources, which could quickly improve the overseas investment banking business of Haitong Securities. After BESI’s acquisition, Haitong Securities could rapidly obtain European and American customer resource and expand its business scope to increase its market position.
In general, the financial problem of BES provided an opportunity for Haitong Securities to purchase BESI.
2.2. Banco Espirito Santo de Investimento (BESI)
BESI was founded in February 1983, its headquarters were located in Lisbon, Portugal. The original name was FINC-Sociedade Portuguesa Promotora de Investimentos, S.A.R.L... In 1986, it was integrated in Esiprito Samto Group and changed its name to Espirito Santo-Sociedade de Investimentos, S.A. In 2000, BES hold BESI stake completely. Until 2014, BESI was split from BES, and was operated under the Novo Banco due to BES’s financial crisis.
BESI had branches in Madrid, London, Warsaw, and New York, while setting subsidiaries and the representative offices in Britain, Brazil, Portugal, Ireland, Mexico and Germany. BESI depended on its strengths and comprehensive business capacity providing professional services for their clients, especially in the Merger & Acquisition, Equity Market, and Fixed Income Market areas.
In terms of the operating performance, the operating indicators of BESI remained stable with a gradual increasing trend. The return on equity of BESI was around 10% during
the period from 2007 to 2013. BESI had enjoyed a high reputation in the business and won “Best Investment Bank of Portugal” of “Global Finance” and “World Finance”. Although BESI was a regional investment bank, it was a leader in the Portuguese and Spanish Investment banking sector with its strength and ability.
The acquisition Process and Price
According to the announcement of Haitong Securities, it took ten months from Haitong Securities involvement in the acquisition to completing the acquisition process. And we present a short summary of the whole process according to the timeline, which is the following:
Table 2-1 - Acquisition Process of Haitong Securities for Banco Espirito Santo de Investimento Time BESI and BES Haitong Securities
7.2014 The parent company of BES broke out in financial crisis since BES did not comply with regulation and increased the exposure to other entities of the Grupo Espirito Santo. 9.2014 The Central Bank of Portugal took
over BES and separated the company into "good bank" and "bad bank" according to the quality of assets. BESI was included in the part called "good bank".
Haitong Securities, Anbang Insurance Group, Fuxin Group Banco Santander Banco BPI S/A and other Financial Institutions were interested in the takeover of BESI.
8.12.2014 BESI resumed trading. Haitong Securities announced its bid for BESI at 379 million euros. In the announcement of Haitong Securities, it mentioned that Haitong International would pay in cash. And 56.85 million would be paid before December 19, the rest of amount would be paid when the transaction would be settled.
7.9.2015 The transaction was concluded. BESI was acquired completely and changed its name to Haitong Bank S.A.
The transaction was concluded. Haitong Securities held the 100% stake of BESI.
10.2015 Haitong Bank S.A. gradually completed the regulatory approval from China, Portugal, UK, US and other countries' antitrust authorities.
Result Haitong Securities acquired BESI, and changed its name to Haitong Bank S.A. Source: Summarized from the announcements of Haitong Securities Group.
It should be noticed that the acquisition happened in the global crisis and euro crisis environment. Due to that situation, the banking system and whole country’s economy had a significant negative impact. If a company was involved in a financial dilemma, other related companies could also be affected.
At the beginning, the parent company BES, Banco Espirito Santo, delayed paying its interest expense of short-term debt, which raised investors’ attention. After investigation, it was found out that BES had increased its exposure to other entities, Espírito Santo Group companies, illegally. The financial crisis of BES also caused its subsidiary BESI a loss of 3.58 billion euros.
The central bank of Portugal was worried that the bankruptcy of BES could cause more trouble. It provided the financial resume to BES and reorganized the assets of BES based on the quality of assets. After the reorganization, Novo Banco hold BESI stake completely. However, BESI still could not completely recover its operating activities without sufficient capital support. Novo Banco decided to sell BESI. In this auction, Haitong Securities, Anbang Insurance Group, Fuxin Group and other financial institutions bided together. At last, Haitong Securities outbid other institutions with a final price 379 million euros.
2.3. Development after the Acquisition
After concluding the transaction, the relation between Haitong Securities and BESI become as follows:
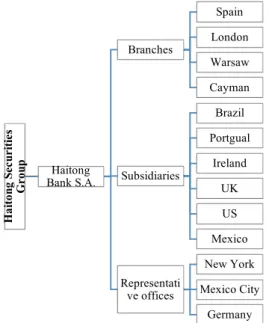
Figure 2-1 - the Relationship between Haitong Securities and BESI.
Source: Haiotng Bank 2016 Annual report
Ha it on g Se cur it ie s Gr ou p Haitong Bank S.A. Branches Spain London Warsaw Cayman Subsidiaries Brazil Portgual Ireland UK US Mexico Representati ve offices New York Mexico City Germany
BESI became a whole-owned subsidiary of Haitong’s Securities Group. And it can foster investment and capture cross-border flows between Asia, Europe, Latin America and Africa. It should be mentioned that the international platform can support its parent company’s international strategy.
In fact, Haitong Bank faces several integration issues, one of the most critical issues being its business overlap.
Since Haitong Securities and BESI are fully-licensed financial companies. The business area of the two companies could be overlapped. How to integrate the business model is critical for both companies. It could affect the development of Haitong Bank and determine if Haitong Bank S.A. is going to create value in the future.
In order to operate Haitong Bank S.A.’s business successfully and enhance its profitability, Haitong Bank S.A. had to make some adjustments in its business model and promote a strategy of which was called “Haitong Bank 2025”.
This new strategy is based on two strategic pillars, China Angle and Emerging Markets. Simultaneously, it mentions that the new business structure of Haitong Bank will focus on three main business areas, Investment Banking, Markets (focused on Fixed Income), and Interactive Products. According to the past five years records, the revenues from these three areas roughly accounted for a third on average, which make it significant to focus on the three areas in the future years.
Data from: 2012-2014 annual report of BESI and 2015-2016 annual report of Haitong Bank
S.A.
Moreover, the new business model would be operated chiefly in the core domestic markets – Iberia, Poland and Brazil, but also the distribution hubs – New York and London. Haitong Bank planned to complete the business restructure in 2017, accompanying with a cost reduction plan.
The previous cost structure of Haitong Bank had a great impact on net profit, the previous cost structure was connected with the former strategy and the need to establish a new banking infrastructure. The inappropriate cost structure could fundamentally affect the further development of Haitong Bank. In the cost reduction plan: Haitong Bank had a significant staff reduction in London and Sao Paulo offices which immediately affected the operating costs.
Besides, in order to better integrate with the business of Haitong Bank, the parent company Haitong Securities provided both operational and financial support for
37.52%
31.82% 30.66%
Business Model of Haitong Bank S.A.
Haitong Bank. in the following years, Haitong Securities plans to further strengthen the Haitong Bank’s position through:
1) The conversion of EUR 80 million subordinated additional Tier 1 instruments into Common Equity Tier 1 capital;
2) A further EUR 139 million capital increase in Haitong Bank, S.A. through the conversion of the Shareholder loan into capital.
3) An additional EUR 200 million capital injection.
Apparently, those changes and reorganization of Haitong Bank will influence the estimation of its equity value.
In short, Haitong Bank is expected to continue its positive and constructive efforts towards the integration process with the support from its investors.
3. Literature Review
In this chapter, we are going to review several topics about corporate valuation from most outstanding scholars, while it also intends to present some common valuation models.
First, we have the definition of value. From an economics perspective, it can be expressed like, “value is a kind of potential capability of a thing that can satisfy people’s needs or demands”.
However, from the financial perspective, according to the International Glossary of Business Valuation Terms (2001), it is stated that “The value that, an investor considers on the basis of an evaluation of available facts, to be the true or real value that will become the market value when other investors reach the same conclusion.”
To some extent, value in finance refers to the potential capability of a company or financial instruments meeting investors required returns. In order to know the amount of value, some calculation should be involved. This process called valuation. Currently, there are two directions related to valuation. One is to calculate the enterprise value, another is to calculate the equity value. On the other hand, the equity value can be computed by enterprise value deducting from it financial debt and adding to it non-business related assets also held by the company.
3.1. Corporate Valuation
Most researchers indicate that the target of companies is to maximize companies’ or shareholder’s value during its entire operating life, while valuating a company is a simple way to know the current value of a company and how to increase it. This means valuation is a way to examine value creation from a managerial perspective, such as, creating value through mergers and acquisitions and divestitures, and adjusting capital structure to support value creation. (Koller, Goedhart and Wessels; 2005)
Apparently, there are numerous methods in valuation. At this point, we are going to introduce mainly two of them: Discounted Cash Flow Method and the Relative Method (Multiples).
3.1.1. Discounted Cash Flow Valuation
The logic of discount cash flow is that the intrinsic value of an asset is equal to the present value of cash flow generated by the asset in the future. (Damodaran, 2002) The basic formula of discounted cash flow method is as follows:
!"#$% = ()* (1 + .)* *01 *02 1 where,
CFt: expected cash flow generated from the asset. t: specific year
N: life of the asset
r: discount rate (Damodaran, 2002)
Typically, the general formula can be detailed into three different categories. The first is to compute the present value of a firm available to the equity. The second one is to compute the present value of the entire firm, which means it includes equity but also other stakeholders, like creditors. The third one is to compute the present value of firm in parts..It means it starts valuing a firm with operations, then adding value of debt and other value from non-equity and non-debt items. Obviously, the three approaches have their own different cash flows and also different discount rates. (Damodaran, 2002) The first one is about valuing directly the equity. The numerator is the expected free cash flow to equity while the denominator changes to the required return rate by investors. In terms of the free cash flow to equity, it means the remaining free cash flow available to equity. It could be computed by free cash flow excluding debt part and other non-equity part. The formula for discounting free cash flow to equity method is as follows: Equity value = ).%% =">ℎ @#AB CA %D$ECF* (1 + .G)* *01 *02 (2) Where,
Free cash flow to equityt: expected free cash flow to equity in period t re: required rate of return by investors. (Damodaran, 2002)
The second one is to compute the entire firm’s value. Regarding this approach, the numerator is the expected free cash flow to firm. It includes the free cash flow available to the firm after deducting all operating expenses, reinvestment and tax requirements. The denominator is the cost of capital computed by the weighted average of the cost of debt and the cost of equity. The detailed formula is as follows:
Enterprise value = ).%% =">ℎ @#AB CA @E.L* (1 + MN((G)* *01 *02 (3) Where,
Free cash flow to firmt: expected free cash flow to firm in period t WACC: Weighted average cost of capital (Damodaran, 2002)
The third approach is still about the value of entire firm, but by using a different method. It is also called adjusted present value (APV). It computes the value of the firm by evaluating the value of each claim. it could be present as follows:
Enterprise value = Value of all equity financed firm + Present values of tax benefits − Expected Bankruptcy Costs (4) (Damodaran, 2002)
As we can see, the principle of discounted cash flow is quite simple. However, when practicing this method in a real company, numerous factors should be taken into
consideration, such as how to predict cash flow accurately and discount rates objectively. In other words, there is always a bias between theory and practice.
3.1.2. Relative Valuation (Multiples)
There is no doubt a lot of research related to the discounted cash flow method. Nevertheless, the most common valuation in practice is relative valuation, also named multiples. Relative valuation is to estimate “the value of an asset by looking at the pricing of ‘comparable’ assets relative to a common variable such as earnings, cash flows, book value or sales” (Damodaran, 2002). Namely, valuating an asset can be conducted from similar assets in the market via intermediate ratios.
Through intermediate ratios, the value of a company may be computed directly. In terms of the process of relative valuation, the peer group should be built according to the definition of multiples. In practice, sometimes it could be replaced by the industry average.
In terms of categories of multiples, Femandez (2015) proposed three groups. The first one is based on equity value, for instance price earnings ratio (PER), price to book value (P/BV). The second one is based on company’s value, like enterprise value to EBITDA (EV/EBITDA) and enterprise value to sales (EV/Sales). The last one being growth reference multiples, for instance PER to EPS growth and Enterprise value to EBITDA growth.
Nevertheless, multiples still have some shortcomings. First, it is subjective when choosing ‘comparable’ firms. It means it is difficult to find a group of firms with similar capital structure and with a completely similar business model. (Damodaran, 2012) Second, the relative valuation requires market efficiency, which means share price must reflect the company’s value correctly. And it is known that market efficiency exists only in theory. On the other hand, the simple operation and understandability of relative valuation makes it popular in practice.
3.2. Valuating Financial Institutions
Since this research is going to focus on financial institutions, we must make some adjustments in the general equity valuation methods to match the characteristics of the financial institution sector. Obviously, with those changes, more accurate results may be achieved.
3.2.1. Discounted Cash Flow Valuation
The most noticeable difference between financial companies and non-financial companies is that in the first it is hard to separate the operating activities from the financial activities completely. It means, to some degree, that net interest income should be included in the operating revenues. (Koller, Goedhart, and Wessels; 2005) At the same time, it is difficult to estimate capital expenditures and the variation of working capital, which are quite important items in the free cash flow to firm. (Damodaran, 2002) Thus, this research chooses discounted free cash flow to equity valuation method.
Inputs to the model
Ø Free Cash Flow to Equity:
The general formula of computing free cash flow to equity is based upon free cash flow to firm, then add variation of debt and interest cost. However, it is hard to estimate financial institution’s net capital expenditure and working capital. Thus, Tim Koller, Marc Goedhart and David Wessels (2005) raised two relatively simple approaches to estimating free cash flow to equity.
The formula of first approach is as following:
Free cash flow to Equity
= Net income − Increase in Equity + Other Comprehensive income
(5)
Theoretically speaking, net income is currently available to shareholders. However, it is noticeable that net income is not cash flow. In order to keep stable capital structure, there is a need to increase equity, which causes free cash flow to equity to decrease. Then the relatively accurate result of free cash flow to equity can be presented by adjusting other comprehensive income related to equity. (Koller, Goedhart, and Wessels; 2005). To some extent, the last two parts of the formula can be expressed as the change in equity value. From the financing source viewpoint, the change in assets is equal to change in debt and equity. In other words, the change in the equity value can
be computed by the change in assets deducted by the change in debt. Thus, the first approach’s formula is equal to:
Free cash flow to Equity
= Net income − (Changes in Assets − Changes in Liabilities)
(6)
The formula of the second approach is directly the sum of all cash flows related to shareholder that they either receive or pay. (Koller, Goedhart, and Wessels; 2005) Ø Discount Rate
In terms of discounted cash flow to equity valuation, the discount rate is the required rate of return by investors. In this research, the required rate of return is computed by the capital asset pricing model (CAPM). It means the required rate of return by investor is determined as follows:
.G = .e+ f ∗ (.h− .e) (7)
where,
re: required rate of return by investors rf: risk free rate
f: stock’s sensitivity to the market .h: expected return of the market
The risk-free rate represents a return rate of an asset without any risk, such as default risk or reinvestment risk (Damodaran, 2008). In practice, the risk-free rate can be replaced by the return rate of a long-term government bond. For instance, US treasury bonds and Germany ten-year bonds.
Beta can be estimated by the regression analysis based on some historical data.
The market premium is the market return over the risk-free return rate. It can be the estimated return of a market index excluding the risk-free rate. Normally, the market risk premium is around 4.5% to 5.5%. (Koller, Goedhart, and Wessels; 2005)
3.2.2. Relative Valuation (Multiples)
Aforementioned, there are numerous multiples used to value companies. Nevertheless, not all of them are appropriate for valuating financial companies. For instance, multiples, like enterprise value to EBITDA or enterprise value to EBIT, are not suitable for financial institution. Since it is not easy to identify operating income completely for financial companies (EBITDA or EBIT being both operating results). In order to evaluate financial companies accurately, the research considers calculating the equity value of financial companies directly. The general equity multiples are price to earnings ratio, and price to book value ratio. (Damodaran, 2002)
Ø Price earnings ratios (PE ratios)
Price to Earnings Ratio = j.E=% k%. >ℎ".% l".mEmn> j%. >ℎ".%
(8)
(Damodaran, 2002)
Ø Price to Book Value Ratio
The formula of price to book value ratio for financial companies is equal to price per share divided by the book value of equity per share.
Price to Book Value Ratio = j.E=% k%. >ℎ".%
oAAp !"#$% A@ %D$ECF k%. >ℎ".%
(9)
(Damodaran, 2002)
3.3. Valuating Distressed Companies
When valuating distressed companies, the complicate point is the negative earnings. In other words, the key point to valuating distressed companies is to focus on how to deal with negative earnings.
It is noticed that predicting earnings should be paid more attention when evaluating a firm that currently has negative earnings. The general approaches of a directly applying a growth rate are not appropriate for those company. Since the earnings will still be negative if using a general growth rate. It means that predicting earnings with those usual approaches is meaningless.
The negative earnings should be treated objectively. It means that the negative earnings can be caused by companies’ temporary issues, or long-term problems, like sluggish state economic. The normal valuation methods are not suitable for those companies
with long-term problems. Some specific adjustments should be taken into consideration in order to valuating them accurately. For instance, changing the projected growth rate with economic status, and then normalize earnings. (Damodaran, 2002)
With respect to those companies with temporary problems or problems just occurred one-time, the valuation can concentrate on the normalization of earnings. It means that those temporary events should not affect operation of companies in the long-term. Therefore, the process of normalizing earnings is about excluding the expenses and benefits related to those events from that year’s earnings. To some extent, the simplest and most direct method for normalizing earnings is to compare each current account of firms with the account of the previous years. If the account is an extreme value compared to the previous year, the account can be estimated based on an average of historical data in the projected period. (Damodaran, 2002)
Other adjustments related to firms’ earnings should be taken into account if the firms made acquisitions or strategic actions. “…, Since the accounting statements in these years will be skewed by large items that are generally non-recurring and related to the acquisition.” (Damodaran, 2002)
4. Equity Valuation
In this chapter, we are going to introduce the information about the M&A sector from Global, North America and European perspectives. Moreover, we are also going to present Haitong Bank S.A. and the valuation models we are going to apply in this research.
4.1. The M&A Sector
GlobalGenerally speaking, a lot of companies went bankrupt in the financial crisis occurred in 2008 and a great number of people lost their jobs. On the other hand, based on the economic cycle theory knowledge, the global economic should follow with recovery and then reach a new peak. Lots of leading companies want to seize larger and/or newer market shares through this economic reshuffle opportunity. There is no doubt M&A is the quickest method to enter a new market and get a larger market share. Thus, M&A became more popular since 2008.
It is worth to mention that the amount of global M&A transactions kept an upwards trend and reached a peak, 107,182 deals and 6,011,581 million USD, in the past six years both in volume and in value.
In addition, the volume and value of global M&A deals in 2016 reduced slightly compared to 2015’s. The volume of global M&A transactions decreased from 107,182 in 2015 to 96,665 in 2016, which means a 9.81% decrease, while the value of global
M&A transactions also dropped from 6,011,581 million USD in 2015 to 4,734,165 million USD in 2016, a 21.25% reduction.
Simultaneously, the volume of global M&A transactions in Banking declined to 1,911 operations in 2015 from 1,941 in 2014, and then raising up to 2,118 units in 2016. However, in terms of the value of global M&A deals in Banking, it presented a continuous decreasing trend, which dropped from 352,297 million USD in 2014 to 203,884 million USD in 2016.
Furthermore, most of M&A transactions happening after 2008 are strategic acquisitions rather than the leveraged acquisitions conducted by private funds. This means that companies are now paying more attention to operating their business after acquisitions.
North America and Europe
It is known that the economies of US and Europe were hit hard because of the financial crisis in 2008. On the other hand, it also provided opportunity for large companies seizing market shares. Those companies with sufficient capital could take this advantage to acquire or invest in other companies that underperformed in the financial crisis to enhance their global market position.
The volume of North American M&A transactions accounted for about 30% of the total volume during the past six years, while the value of North American M&A transactions had a growth trend since 2011, and reached a peak of 2,139,657 million USD in 2015, and then followed a slight drop in 2016. In general, the M&A market of North America
kept a relatively active status, which accounted for a quarter of global M&A transactions.
In Western European M&A market, the volume and value generally maintained an upward trend since 2011. The number of M&A deals in Europe was 27,454 in 2016 while the total value was 1,199,313 million USD. Compared with 2015’s, the volume increased in 2016 while the value of M&A transaction in European market slightly decreased.
Those operations benefited from the relatively low interest rate, the economy’s recovery, and led investors to regain confidence in the market. Additionally, Basel Committee raised Basel III in 2010, which mentioned that the Tier 1 Capital of bank institutions must be at least 6.0% of risk-weighted assets at all times while Total Capital (Tier 1 Capital plus Tier 2 Capital) of banks must be at least 8.0% of risk-weighted assets at all times. It is out of question that those changes in the policies could reduce the investment opportunities in the relative sectors.
Source: BUREAU VAN DIJK, M&A Review global, full year 2016.
Asia
When western countries’ economies slowed down, emerging countries’ economies developed quickly compared to the Western countries, especially in the case of China. Therefore, benefiting from the growth in their economy, Chinese investors managed to accumulate abundant capital. And they continued looking for valuable programs to invest at home and abroad.
In general, the total volume and value of M&A transaction involving in Chinese companies (including China Mainland and Hong Kong Companies) were 11,409 units and 770.1 billion USD in 2016, respectively, and could be following a growing trend. Additionally, the number of oversea merger and acquisition transactions increased dramatically from 357 in 2012 to 1204 in 2016, increasing by as much as 237%, almost 3.5 times as much as in 2015. Among them, 51 oversea investment transactions amounted to over 1 billion U.S. dollars, which was almost twice the value registered in
0 20,000 40,000 60,000 80,000 100,000 120,000 0 1,000,000 2,000,000 3,000,000 4,000,000 5,000,000 6,000,000 7,000,000 2011 2012 2013 2014 2015 2016 mi l U SD
M&A Deals By Volume and Value
Total deal value (mil USD) - Global Total deal value (mil USD) - Western Europe Total deal value (mil USD) - North Amercia No. of deals - Global
2015. Furthermore, the deals of M&A that Chinese companies operated in Europe grew from 110 in 2015 to 300 in 2016.
Figure 4-2 - The Volume and Value of China´s M&A
Source: Edited by author; data from: Thomson Reuters, China Venture and PWC analysis
In addition, there were 81 oversea M&A transactions in the Financial services sector in 2015 while the number of oversea M&A transactions in the same sector in 2016 was 32, which was a great reduction (Source: PwC, M&A 2016 review and 2017 outlook). The most relevant deals involving Chinese companies occurred in the European market, including the acquisition by Haitong group of Banco Espirito Santo de Investimento (BESI) through its wholly owned subsidiary, Haitong International Securities, as well as the acquisition by Anbang Insurance of Delta Lloyd Bank Belgium. In this research, we are going to analyze the acquisition of BESI by Haitong Securities in more detail.
357 362 486 581 1204 4116 4446 6899 9421 11409 0 2000 4000 6000 8000 10000 12000 0 200 400 600 800 1000 2012 2013 2014 2015 2016 US $ bn
The Volume and Value of China M&A
Total China Outbound-Value (US$bn) Total China-Value (US$bn) Total China Outbound-Deal count Total China-Deal count
4.2. Introduction of Haitong Bank S.A.
Before introducing Haitong Bank S.A, we must point out that BESI is the predecessor of Haitong Bank S.A. and as Haitong Securities acquired BESI in 2015, we decided to introduce Haitong Securities and BESI before presenting Haitong Bank S.A...
Haitong Securities – The Acquirer
Haitong Securities is one of the earliest and second large-scale brokers in China. It was founded in 1988, then named Shanghai Haitong Corporation. In 1994, it changed its name to Haitong Securities after National Transformation.
Currently, Haitong Securities is a listed company on the Shanghai Stock Exchange and Hong Kong Stock Exchange. The main businesses of Haitong Securities are Brokerages, Investment Bank, Mergers and Acquisitions, Asset Management, Self-management, Derivative, Alternative Investment, International Business, Private Equity Investments, Financial Leasing, etc. Generally speaking, Haitong Securities operates numerous businesses in domestic and abroad markets.
To some degree, Haitong Securities explores abroad markets chiefly through Merger and Acquisitions. In 2010, Haitong Securities acquired Dafu Securities to deal with Business in the Hong Kong market. Following that, Haitong Securities acquired Hong Kong Hengxin to manage business in China and Hong Kong market in 2013. Then in 2014 Haitong Securities acquired Japan Invest to handle business in the Japanese market. Recently, Haitong Securities acquired BESI to explore European and Latin
America markets. It can be said that this acquisition is a strategic action of Haitong Securities.
Banco Espirito Santo de Investimento (BESI) – The Acquiree
BESI was a subsidiary of BES before 2014. However. In 2014 its parent company - Banco Espirito Santo (BES), which at that time was one of the largest listed banks in Portugal – entered into a liquidity crisis, as BES was unable to repay its short-term debt and related expense. This caused a huge loss to BESI, close to 3.58 billion euros. In order to avoid greater damages the Portuguese Central Bank took over BES and then separated it into two different parts: “Good Bank” and “Bad Bank” based on the quality of the assets included in each part. After that, the “Good Bank”, Novo Banco, held the whole shares of BESI.
BESI had already more than 25 years history and it was a leading investment bank in Portugal and Spain, while it ran business in 12 countries and 4 continents. The headquarter of BESI was located in Lisbon, Portugal. And BESI had set up branches in Spain, London, Warsaw and Cayman while its subsidiaries covered in Brazil, Portugal, Ireland, United Kingdom, the United Stated of America, and Mexico. In addition, BESI also had representative offices in New York, Mexico City and Germany.
In terms of business model, BESI provided a lot of financial service in numerous areas. Such as, Investment Banking business, Capital Market, Equities, Fixed Income, Corporate Finance, Mid-Cap Financial Advisory, Project Finance and Securitization,
Acquisition Finance and Other Lending, Treasury, Asset Management and Private Banking. In fact, BESI was a leader in this sector in Portugal, and in Iberia. The impressive performance of BESI gained reputation. At the same time, it was awarded “Best Investment Bank of Portugal” of “Global Finance” and “Portugal’s Best Investment Bank” of “European Currency”.
We may consider that for Haitong Securities the acquisition of BESI was a strategic acquisition. This operation may assist them in quickly exploring western markets as well as in getting access to those African markets where Portuguese is spoken.
4.3. Financial Analysis
Before evaluating Haitong Bank S.A., it is important to know the historical financial situations of Haitong Securities and BESI, such as profitability, liquidity, and solvency. After that, we are going to analyze the financial situation of Haitong Bank S.A. after the acquisition. Some key ratios are summarized, as follows:
Table 4-1 – Important Ratios 2012 2013 2014 2015 2016 Haitong S. thousand RMB Haitong S. thousand euro(8.1058:1) BESI thousand euros Haitong S. thousand RMB Haitong S. thousand euros (8.1648:1) BESI thousand euros Haitong S. thousand RMB Haitong S. thousand euros (8.1857:1) BESI thousand euros Haitong B. thousand euros Haitong B. thousand euros Income Statement
Fees and commission income 4,954,145 611,185 101,110 6,416,692 785,897 102,274 9,088,673 1,110,311 98,322 82,471 45,187 Net interest income 2,172,331 267,997 94,539 2,186,595 267,808 82,267 3,359,782 410,445 65,945 44,444 57,110 Market Result 2,653,247 327,327 65,521 2,380,581 291,566 61,984 6,450,725 788,048 85,779 7,123 6,573 Total operating income 9,779,723 1,206,509 261,170 10,983,868 1,345,271 246,525 18,899,180 2,308,804 250,046 134,038 108,870 Operating costs 3,028,438 373,614 176,053 3,442,992 421,687 171,976 5,283,634 645,471 160,959 141,089 155,939 Net operating income before impairments 6,751,285 832,896 85,117 7,540,876 923,584 74,549 13,615,546 1,663,333 89,087 (7,051) (47,069)
Income before tax 4,109,472 506,979 39,013 5,454,748 668,081 15,426 10,420,394 1,273,000 (167,347) (112,446) (104,563)
Net income 3,234,492 399,034 20,542 4,280,994 524,323 7,363 8,119,023 991,854 (137,631) (92,540) (94,792) Balance sheet
Total assets 126,482,104 15,603,901 6,481,863 169,123,603 20,713,747 5,961,799 352,622,149 43,077,825 4,441,419 4,104,783 4,754,747 Total liabilities 66,051,508 8,148,672 5,775,858 105,018,445 12,862,341 5,342,304 280,357,946 34,249,722 4,003,816 3,744,006 4,404,224 Shareholder's equity 60,430,596 7,455,229 706,005 64,105,158 7,851,406 619,495 72,264,203 8,828,103 437,603 360,777 350,523
Profit and efficiency ratios
Gross return on Equity - ROE 11.17% 12.06% 11.76% 12.03% 18.84% 20.36% -1.95% -13.43%
Net return on equity - ROE 5.35% 2.91% 6.68% 1.19% 11.24% -31.45% -25.65% -27.04%
Gross return on assets - ROA 5.34% 1.31% 4.46% 1.25% 3.86% 2.01% -0.17% -0.99%
Net return on assets - ROA 2.56% 0.32% 2.53% 0.12% 2.30% -3.10% -2.25% -1.99%
Cost-to-income 0.31 0.67 0.31 0.70 0.28 0.64 1.05 1.43
Total operating income / Average assets 7.73% 4.03% 6.49% 4.14% 5.36% 5.63% 3.27% 2.29%
Capital Structure
Debt / Assets 52.22% 89.11% 62.10% 89.61% 79.51% 90.15% 91.21% 92.63%
Equity / Assets 47.78% 10.89% 37.90% 10.39% 20.49% 9.85% 8.79% 7.37%
Debt / Equity 1.09 8.18 1.64 8.62 3.88 9.15 10.38 12.56
Solvency ratios
Net capital/total of risk capital reserves 1428.52% N/A 1241.14% N/A 819.66% N/A N/A N/A
Tier 1 Ratio N/A 11.60% N/A 11.03% N/A 9.44% 10.50% 9.60%
CET 1 Ratio (common equity Tier 1 ratio) N/A 11.60% N/A 11.00% N/A 9.40% 10.50% 7.10%
Solvency ratio 91.49% 12.22% 61.04% 11.60% 25.78% 11.58% 9.64% 7.96%
Leverage and liquidity raito
Current ratio 1.77 2.53 1.80 2.58 1.37 2.58 2.19 2.05
Quick ratio 1.01 1.84 0.77 2.06 0.50 1.75 1.65 1.69
TIE 5.74 0.16 3.60 0.06 2.36 -0.65 -0.54 -0.49
Ratings
In terms of the income statement, the net income of Haitong securities (for H shares) kept an upward trend from 2012 to 2014, while the net income of BESI had a constant decrease in the same period and it had negative earnings in 2014. However, it must be stressed that the net income before impairments of BESI in 2014 was positive. In the balance sheet, it can be observed that the total assets of Haitong Securities increased dramatically, but BESI had an opposite situation. And the increasing assets of Haitong Securities were mainly from the liabilities resources.
As it is mentioned earlier, the return on equity (ROE) represents the profitability of the equity capital of company’s shareholder. In this study, the ROE of Haitong securities maintained a relatively high level compared to the ROE of BESI. The average ROE of Haitong Securities in the period from 2012 to 2014 was 7.76% while the average of ROE of BESI in the same period was a negative value, -9.12%.
Return on assets (ROA) means the profitability of a company based on its total assets. The ROA of Haitong Securities was around 2% in the time from 2012 to 2014. And the ROA of BESI was below 1% and got a negative value in 2014.
The cost to income ratio is using the operating expense divided by the total operating income. In the study, the operating expenses include the general and administrative expenses, staff cost and depreciation and amortization expenses. The cost to income ratio of Haitong securities was generally below 0.5 while the cost to income ratio of BESI was above 0.5, which indicated that the operating expenses of BESI were higher
than Haitong Securities. The cost structure of BESI had a constant impact for Haitong Bank S.A.. As it is seen, the cost to income of Haitong Bank S.A. was over 1, which means operating costs was over its operating income.
The capital structure can present the financial resources of the company. For both companies, the financial leverage (D/E ratio) was higher than 1, therefore over fifty percent of assets were financed through debt. Furthermore, the leverage of BESI was obviously higher than Haitong Securities, since the D/E ratio of BESI was around 8 or 9, while the D/E ratio of Haitong Securities was not over 4.
In terms of solvency, Haitong Securities follows the risk management regulations of China Securities Regulatory Commission (CSRC), while BESI followed the Basel Committee’s regulation. In general terms, Haitong Securities met the requirements of CSRC, for instance, the net capital to the total of risk capital reserves of Haitong Securities in the period from 2012 to 2014 was far more than 1, which complied to the requirement of CSRC.
At the same time, the Tier 1 of BESI met the requirement of Basel Committee, 4.5%, but with a decreasing trend. Normally, the investors require 10% Tier 1 of the bank. However, the Tier 1 of BESI was 9.4% in 2014. And Tier 1 is the percentage of a banking firm’s core capital to its total risk weighted capital, where the core capital mainly includes the common stock and retained earnings.
The solvency ratio is one of the indicators to measure if a company is able to meet its long-term debt. In our study, we simplified the ratio as the comparison of total equity to total liabilities. Apparently, the solvency ratio of BESI in the period from 2012 to 2014 was lower than the value for Haitong Securities.
Current ratio and quick ratio both are the indicators of a company’s liquidity. The average current ratio from 2012 to 2014 of Haitong Securities was 1.67 while the average current ratio of BESI was 2.57. Furthermore, the Quick ratios of BESI were around 2 from 2012 to 2014, while the quick ratios of Haitong Securities were roughly 0.7. Generally speaking, BESI and Haitong Securities can repay their current liabilities on time. On the other hand, the liquidity of BESI was relatively better than Haitong Securities.
The Time Interests Earned (TIE) ratio is an indicator that measures if the earnings of a company can afford its interest expenses. The TIE of BESI was really low. It means that it is quite hard for BESI to pay the interest expense using its earnings. On the other hand, the average TIE in the period from 2012 to 2014 of Haitong Securities was around 3.
Based on Standard & Poor’s (S&P) Rating, the short-term and long-term rating of Haitong Securities basically maintained at BBB and A- respectively in the years from 2012 to 2014. In the same years, the BESI’s short-term and long-term ratings were B and BB-, which was mainly impacted by Portugal’s Country Rating.
In general, the financial situation of Haitong Securities was better than BESI’s. In general, the financial situation of BESI was relatively good before 2014, due to the financial crisis of BESI’s parent company, the situation deteriorated, which provided the opportunity for Haitong Securities Group’s acquisition.
After the acquisition, it is critical to know the financial situation of Haitong bank S.A., which could help us to know the performance in the more two recent years and is also beneficial to the valuation process.
Apparently, because of the huge loss of BESI in 2014, the negative impact still continued in the past two years for Haitong Bank S.A..
The net income of Haitong Bank in 2015 and 2016 were still negative due to the changes in the business model and cost structure. And the net operating incomes before impairment were positive, which meant the impairment, especially the credit impairment still had a great impact on the final results of Haitong Bank S.A..
In the balance sheet, the total assets were 4,755 million euros, increasing 15.83% compared to the assets in 2015, which mainly resulted from the increase of the securities portfolio and particularly in Loans and Advances to Banks. At the same time, the total liabilities increased 17.63% in 2016 which resulted from significantly increasing of the financial liabilities held for trading. However, the total equity decreased 2.84% compared to the equity of 2015.
Since Haitong Bank S.A. had negative earnings in 2015 and in 2016, the return on asset (ROA) and Return on Equity (ROE), both of them were negative values.
The cost to income ratios were 1.05 and 1.43 in 2015 and 2016, respectively. It means that the cost of Haitong Bank S.A. was higher than its income, which was not normal. The high-cost structure was related to the former strategy and the need to set up a new banking infrastructure after severing ties with Novo Banco.
The financial leverage of Haitong Bank S.A. continued to maintain a really high level. The D/E ratio was 10.38 and 12.56 in 2015 and 2016, respectively.
According to Basel III regulations, the Common Equity Tier 1 (CET1) must be at least 4.5% of risk weighted assets. Tier 1 cannot be below 6.0% of risk weighted assets. And the total capital cannot be below 8.0% of risk weighted assets. The CET1 and Tier 1 of Haitong Bank S.A. were 7.1% and 9.6% respectively in 2016, which met the minimum capital requirements of Basel III. However, both of them decreased compared to the value of 2015. Another indicator, solvency ratio, still exhibited a relatively low level, 9.64% in 2015 and 7.96% in 2016.
Meanwhile, the current ratio and quick ratio, which represent the ability of the company to repay its short-term obligations, maintained at a relatively high level. The current ratios were 2.19 and 2.05 in 2015 and 2016, respectively. Meanwhile, the quick ratios were 1.65 and 1.69 in 2015 and 2016, respectively.
Both Time Interest Earned (TIE) had negative values, -0.54 in 2015 and -0.49 in 2016, because of the negative earnings.
Currently, S&P put Haitong Bank S.A. at BB- and B in the short-term and long-term with a positive outlook.
4.4. Valuation of Haitong Bank S.A.
This part is going to present the valuation of Haitong Bank S.A. based in detail on the historical performance of Haitong Bank S.A. and BESI for predicting the future performance of Haitong Bank S.A.. Since currently Haitong Bank S.A. shares are suspended, the share price of Haitong Bank S.A. is not available, therefore we are going to compare the final estimated results with the book equity value. Consequently, the aim is to find out: whether investors should continue to invest or not?
4.4.1. Forecast for the Next Five Years
Since currently, Haitong Bank S.A. has negative earnings, this part is going to normalize the negative earnings based on the historical performance of BESI. As mentioned before, normalizing the abnormal accounts is mainly done through excluding the expense and benefits related with the acquisition and the previous financial crisis of BESI, and then using a recent average change rate and gradually back to the average growth rate of Investment & Asset management sector.
Table 4-2 - The Growth Rates of some Important Items
Source: Author
Since Haitong Bank S.A. is a relatively new post-acquired company, the growth rate of some accounts can be abnormal. In this part, we make some adjustments and assumptions for the growth rates of some important items.
Items from Income Statement:
The growth rate of the fees and commission income in 2016 was negative, -45.21%, which was due to the change in the business model that has affected revenue generation and also the existing disproportionate cost structure. The change in business model could be beneficial to improving Haitong Bank’s profitability. Thus, we assume that the growth rate of fees and commission income will turn to a positive value, 10%, following the estimated growth rate of revenues of Investment bank sector in the following two years presented in Damodaran’s database, and then grow with a rate also taken from Damodaran´s estimation in the next five years and then stabilize in line with the permanent growth rate.
Growth Rate 2016 FY2017 FY2018 FY2019 FY2020 FY2021 FY2022
Growth Rate of Fees and Commission Income -45.21% 10.00% 10.00% 12.90% 12.90% 12.90% Growth Rate of Net Interest Income 28.50% 24.33% 24.33% 18.81% 18.81% 18.81% Growth Rate of Market Result 12.69% 24.33% 24.33% 18.81% 18.81% 18.81% Growth Rate of Staff Costs (Expected Inflation rate) 0.64% -5.00% 2.01% 2.10% 2.20% 1.93% Growth Rate of General and Administative Expense 5.35% -5.00% 2.01% 2.10% 2.20% 1.93% Growth Rate of D&A -2.95% -1.84% -0.73% 0.38% 1.50% 2.61%
Permanent Growth Rate 3.72%
Growth Rate of Impairment and Provision -44.69% -37.86% -31.03% -24.21% -17.38% -10.55% -3.72% Tax Rate 9.34% 13.52% 13.52% 23.00% 23.00% 23.00% 23.00% Growth Rate of Financial asset held for trading 11.02% 1.50% 2.50% 2.58% 2.65% 2.73% 2.80% Growth Rate of avaiable for financial assets 72.87% 1.50% 2.50% 2.58% 2.65% 2.73% 2.80% Growth rate of loans and advance to banks 229.87% 1.50% 2.50% 2.58% 2.65% 2.73% 2.80% Growth rate of loans and advance to customers -18.75% 1.50% 2.50% 2.58% 2.65% 2.73% 2.80% Growth rate of other assets -23.08% 1.50% 2.50% 2.58% 2.65% 2.73% 2.80% Growth rate of financial liabilities held for trading 107.56% 1.35% 2.25% 2.32% 2.39% 2.45% 2.52% Growth Rate of loans and advance to banks 20.93% 1.35% 2.25% 2.32% 2.39% 2.45% 2.52% Growth Rate of customers accounts 29.75% 1.35% 2.25% 2.32% 2.39% 2.45% 2.52% Growth Rate of debt securities issued -37.59% 1.35% 2.25% 2.32% 2.39% 2.45% 2.52% Growth Rate of other liabilities -37.33% 1.35% 2.25% 2.32% 2.39% 2.45% 2.52%
The growth rate of net interest income of Haitong Bank S.A. was 28.50% in 2016. Since the global economies are recovering, the interest rate is relatively stable. We assume that the following two years’ growth rate of net interest income will be the expected growth rate of Damodaran’s in the next two years in the Investment & Assets Management Sector, and then the growth rate of net interest income will change to the estimated growth rate by Damodaran in the following five years in the Investment & Assets sector.
With respect to the growth rate of the market result, we assume that the growth rate will follow the same trend as of net interest income.
Given its inappropriate cost structure, Haitong Bank S.A. is going to revise the cost structure as stated in “Haitong Bank 2025”. Accordingly, the total operating expense of Haitong Bank S.A. should decrease in the following years. Therefore, we make some assumptions about relative operating expense items.
The growth rate of staff cost will decrease 5% since Haitong Bank had a staff reduction in London and Sao Paulo offices and will then keep consistent with the expected inflation rate of Portugal.
The growth rate of general and administrative expense of Haitong Bank S.A. will move like the growth rate of staff cost item.
The growth rates of depreciation and amortization, and impairment and provision will increase gradually from -2.95% and -44.69% respectively in 2016 to the permanent growth rate.
The permanent growth rate is equal to the estimated growth rate of Earning before Interests and Taxes (EBIT) of Investment & Assets Management Sector, 3.72% on the Damodaran’s Website.
In terms of tax rate, since the net earnings of Haitong Bank S.A. is currently negative, we assume that the tax rate of Haitong Bank is equal to the average tax rate of 2015 (restatement) and 2016 in the projected period if the predicted EBIT is negative. On the other hand, the tax rate is 23% in the projected period if the predicted EBIT is positive.
Items from Balance Sheet:
Since Haitong Bank S.A. is in a reorganization process, the important items, such as loans and advance to banks, can change a lot due to one-time activities, such as, Haitong Bank S.A. concluded the winding up of its New York Branch and Haitong & Company (UK) Limited. But from a long-term operating perspective, it cannot produce long-term impact. Therefore, when estimating the growth rate of assets, it should be taken into account.
At the same time, Haitong Bank S.A. mentioned that it will adjust the company’s size and cost structure in “Haitong Bank 2015”. Therefore, we deduce that Haitong Bank S.A. will slow down the growth rate of total assets and liabilities to prepare for the
adjustments that are going to be made in the following year, after that it can follow the growth rat rate of country economies. In our study, we assume that the growth rates of assets of Haitong Bank S.A. will move following the expected growth rate of Portugal GDP on the Trading Economics Website.
The growth rate of assets items will be 1.5% and 2.5% in 2017 and 2018, respectively, and then they will decrease gradually from 2.58% to the permanent growth rate 2.8%. The growth rate of liabilities items will be 1.35% and 2.25%, which are following the average capital structure of Haitong Bank S.A., and then they will decrease gradually from 2.52% to the permanent growth rate.
4.4.2. Required Rate of Return of the Investors (Cost of Equity)
The required rate of return of the investors is the discount rate of discounted free cash flow to equity method. As it was mentioned before, the required rate of return by the investors is estimated by the CAPM model. Based on the formula of CAPM, it is important to estimate the risk-free rate, the market premium and the beta of Haitong Bank S.A..
Risk-free rate
As mentioned before, the risk-free rate can be replaced by the rate of the return of a long-term government bond in practice.
However, it is not accurate to use the rate of return of 10-year Portuguese Government Bonds as the risk-free rate. Since Portuguese Government Debt has default risk according to the rating of S&P, Moody’s, and Fitch. Currently, the rating of Portugal is BBB for S&P, Ba1 for Moody’s and BBB for Fitch.
Therefore, the rate of return of US 10-year government bond is recognized as the risk-free rate in this study. At the same time, the country risk should be taken into consideration because of the existing of default risk. Therefore, the real risk-free rate is equal to the rate of return of US 10-year government band plus the country risk premium, which can be found on the Damodaran’s website.
Market Risk Premium
According to the definition of market risk premium, it is the part that the market return is over the risk-free rate. Therefore, it is important to define the market and estimate the market return.
However, it should be noticed that the stock market of Portugal is not quite stable, which means it is not the best choice using the return of Portugal stock market as a market return to compute the market risk premium.
In this study, we estimate the market risk premium through computing the risk premium of US market.
The beta indicates that the return of an individual asset is more or less volatile than the entire market in general.
Since Haitong Bank S.A. is a relatively new company, we are going to use the average beta of Investment & Asset Management sector as the estimated beta. The average beta of Investment & Asset Management sector can be found from the website of Damodaran, which is equal to 0.9. And we assume that the beta can be constant in the following years.
Estimate of Rate of Return of Investors
Table 4-3 - The Rate of Return of Investors
Risk-free Rate of US 4.24%
Country Risk premium of Portugal 2.88%
Risk-free Rate of Portugal 7.12%
Market Return of US 8.89%
Market Risk Premium 4.65%
Beta 0.9
Rate of Return by the investors 11.31%
Source: Author based on Damodaran’s Website
Based on some assumptions and calculations, the rate of Return of the investors of Haitong Bank S.A. is 11.31%.
4.4.3. Discounted Cash Flow to Equity
In order to apply the discounted cash flow to equity method, we are going to estimate free cash flow to equity firstly.
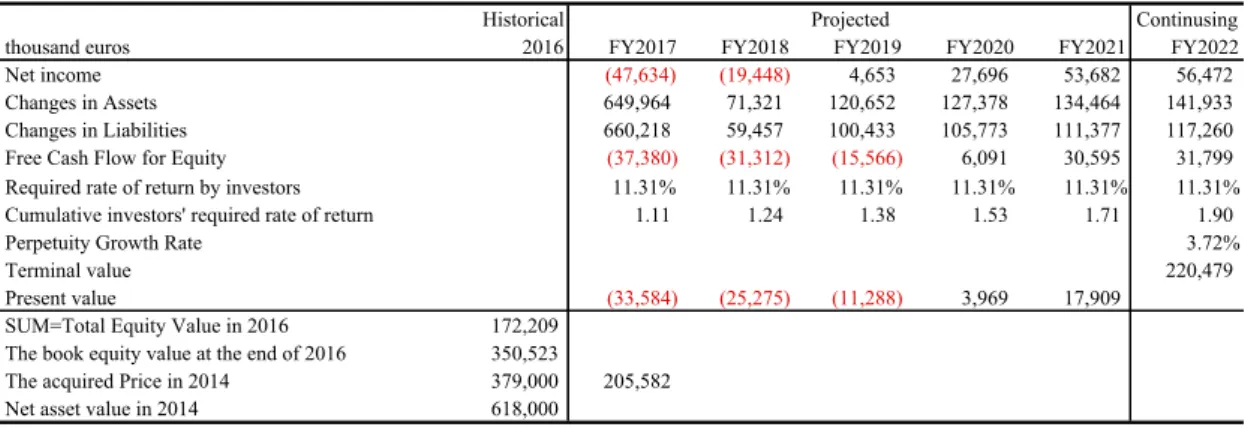
Table 4-4 - Discounted Cash Flow to Equity
Source: Author
As the table is presented, the estimated free cash flows to equity of Haitong Bank S.A. are negative in the following three years. After that, the free cash flows to equity are increasing through time.
In this valuation method, the estimated equity value of Haitong Bank S.A. is actually lower than the book equity value in 2016.
4.4.4. Relative Valuation (Multiples)
As mentioned before, the principle of multiples is to estimate the target company’s value via intermediate ratios of peer companies.
Historical Continusing
thousand euros 2016 FY2017 FY2018 FY2019 FY2020 FY2021 FY2022
Net income (47,634) (19,448) 4,653 27,696 53,682 56,472
Changes in Assets 649,964 71,321 120,652 127,378 134,464 141,933
Changes in Liabilities 660,218 59,457 100,433 105,773 111,377 117,260 Free Cash Flow for Equity (37,380) (31,312) (15,566) 6,091 30,595 31,799 Required rate of return by investors 11.31% 11.31% 11.31% 11.31% 11.31% 11.31% Cumulative investors' required rate of return 1.11 1.24 1.38 1.53 1.71 1.90
Perpetuity Growth Rate 3.72%
Terminal value 220,479
Present value (33,584) (25,275) (11,288) 3,969 17,909
SUM=Total Equity Value in 2016 172,209 The book equity value at the end of 2016 350,523
The acquired Price in 2014 379,000 205,582 Net asset value in 2014 618,000
Since the stock of Haitong Bank S.A. is not traded on the market, we are unable find the real equity value of Haitong Bank S.A. directly from the market. Thus, we are going to estimate the real equity value of Haitong Bank S.A. from its ‘comparable’ companies. The following table presents the ratios we decided to include as well as the composition of the peer group.
Table 4-5 - Multiples
Source: Author
The price to book value ratio compares the market value of the company with its book value. It can be seen that the average price to Book value of Haitong Bank S.A.’s competitors is lower than 1, from which can be deducted that those companies’ performance in the market is lower than their shareholders expectations.
The estimated equity value of Haitong Bank S.A. through PBV ratio is 274,018 thousand euros.
To some degree, the price earnings ratio is to compare the market value of the company with its net earnings. In 2016, the net income of Haitong Banks S.A. is negative, it
Haitong Bank S.A. Banco Comercial Portuguese S.A.
Banco BPI S.A. Caixa Geral de Depositos S.A.
Price to Book Value 0.41 0.26 0.56 NA
Price to Earnings Ratio (current) 7.35 9.47 5.23 NA
ROE (%) -27.04% 0.03 0.11 -47.89%
Debt/Equity (unadjusted) 12.56 12.54 12.16 23.09
Beta 0.9 1.9949 1.6848
-Net earnings of Haitong Bank S.A. in 2016 (thousand euros) (94,792)
Book equity value of Haitong Bank S.A. (thousand euros) 350,523 Estimated equity value of haitong Bank S.A.
in 2016 (through PBV) (thousand euros) 144,716 Estimated equity value of haitong Bank S.A.
makes no sense if we consider the positive average PER, because we then would get a negative equity value. We estimate the equity value of Haitong Bank via the average PER of BCP and BPI (i.e. 7.35), we then multiply this ratio by the expected earnings for 2022 (56.472*7.35 = 415.069) and then we discount this value to 2016 (using our 11.31% discount rate for the six years period), we then get an equity value of 218,364 thousand euros.
At the same time, we compare the return on equity (ROE) and D/E of Haitong Bank S.A. with its peers.
The Return on Equity (ROE) is the net profits of a company compared to its total equity value. Since Haitong Bank S.A. had a negative income in 2016, the ROE of Haitong Bank S.A. is negative.
The Debt to Equity ratio indicates the financial leverage of the company. In this study, the D/E ratios of these companies, except for Caixa Geral de Depositos S.A., are almost equal.
The estimated equity values of Haitong Bank S.A. through PBV and PER are 144,716 and 218,364 thousand euros respectively, those values are quite different. On the other hand, both are below the book value of equity, and the estimated value using PBV method is above our estimated value based on FCFE while the estimated value based on PER is opposite.