Analysis of the performance of the 3-PG Model
for Scots pine in Turkey
Deniz Çolak
Dissertation to obtain the degree of Master of
Mediterranean Forestry and Natural Resources Management
Coordinator: Professora Catedrática Maria Margarida Branco de Brito Tavares Tomé
Co-Coordinator: Doutora Ana Paula Soares Marques de Carvalho
Jury:
President: Doutor António Manuel Dorotêa Fabião, Professor Associado do Instituto Superior de Agronomia da Universidade Técnica de Lisboa
Vogais : Doutora Maria Margarida Branco de Brito Tavares Tomé, Professora Catedrática do Instituto Superior de Agronomia da Universidade de Lisboa
Doutor Luis Mendes Godinho Milheirico Fontes, Investigador do Instituto Superior de Agronomia da Universidade Tecnica de Lisboa
II ACKNOWLEDGEMENTS
I would like to thank those who were an influence and a moral support on some of the most exciting and sometimes difficult days of my life. To all of them my sincere thanks.
First of all, I would like to express my most sincere thanks to my supervisor, Professor Margarida Tomé, who was a real and true support throughout the development of this thesis. Despite she passed through a very difficult time period, she always kept her pecker up and enliven us with her energy.
Secondly, I would like to express my thanks to my second supervisor, Paula Soares, who supported me with a great patience and good humour. As without her, any progress of the thesis would be almost impossible.
I would also like to thank Professor Doğanay Tolunay for providing me the data from Turkey with the expertise on the parameters of 3-PG and detailed explanations about the study via e-mail. My most sincere thanks to him for answering all my endless questions with a great patience.
A special thanks to Aydın Çömez who allowed me to use all the data in his PhD thesis and provided me the meteorological data from the station.
To my family who always trust on me and support my choices.
To my friends, Araceli Ruiz Guillamon and Iris Rodrigues who supported me with their companionship in the most difficult days of my life.
And especially, I would like to thank to my love, Ünsal Özcan, who was facing these difficult days with me with a great patience but always with a huge smile on his face.
III ABSTRACT
The 3-PG (Physiological Principles in Predicting Growth) is a dynamic, process-based model of forest growth developed in order to bridge the gap between empirical models and very detailed physiological models. The aim of this thesis is to analyse the performance of the model 3-PG for Scots pine (Pinus sylvestris L.) with data from Turkey. A first step was to identify and organise data for this purpose. Two important data sets were found in Turkey, the first containing 68 trees that were destructively sampled for biomass assessment, the second from 135 temporary plots. The absence of data from permanent plots lead to the use of existing yield tables, that were complemented in order to provide foliage and stem biomass, as growth data. The first runs of 3-PG were based on parameters available from the literature, followed by the calibration of as many parameters as possible with the data available, namely the age-related and the allometric and partitioning parameters. The model showed quite reasonable results in predicting the above-ground biomass and stand density, but some problems with the prediction of leaves biomass whose estimations in the yield table were also questionable. The results are promising and point out for research lines that must be pursued in order to improve the performance of 3-PG for Scots pine in Turkey.
Key-words: Forest models, process-based models, 3-PG model, Scots pine (Pinus sylvestris L.), Turkey
IV RESUMO
ANÁLISE DA PRESTAÇÃO DO MODELO 3-PG PARA PINHEIRO SILVESTRE NA TURQUIA
O modelo 3-PG (Physiological Principles in Predicting Growth) é um modelo dinâmico de base fisiológica que foi desevolvido para fazer a ponte entre os modelos empíricos e os modelos de base fisiológica. O objetivo desta tese é analisar a prestação do modelo 3-PG para o Pinheiro silvestre (Pinus sylvestris L.) com dados da Turquia. Uma primeira etapa consistiu na identificação e organização de dados. Foram identificados dois conjuntos de dados, o primeiro de 68 árvores abatidas com determinação de biomassa, o segundo de 135 parcelas temporárias. A ausência de dados de parcelas permanentes levou à utilização, como dados de crescimento, de tabelas de produção que foram complementadas para incluir biomassa de tronco e folhas. As primeiras aplicações do modelo 3-PG basearam-se em calibrações disponíveis na literatura, seguidas da calibração de tantos parâmetros quanto possível com os dados disponíveis, nomeadamente os parâmetros alométricos, de partição e relacionados com a idade. O modelo mostrou resultados promissores para a biomassa aérea, mostrando algumas dificuldades para a biomassa de folhas, cujas estimativas na tabela de produção também apresentaram problemas. Foram apontadas linhas de investigação para melhorar a prestação do modelo para o pinheiro silvestre na Turquia.
Palavras-chave: Modelos de produção florestal, modelos de base fisiológica, modelo 3-PG, Pinheiro silvestre (Pinus sylvestris L.), Turquia
V RESUMO ALARGADO
Prever os efeitos das mudanças ambientais no crescimento das florestas é hoje em dia fundamental para a silvicultura e gestão sustentável dos recursos florestais. Tais previsões podem ser obtidas com base em modelos e simuladores do crescimento da floresta, nomeadamente com os designados por modelos processuais ou de base fisiológica. A modelação da floresta enfrenta, assim, o novo desafio de apoiar a gestão florestal no contexto das mudanças ambientais. Os modelos de crescimento tradicionais, geralmente designados por modelos empíricos (MEs), foram desenvolvidos usando técnicas estatísticas aplicadas a conjuntos de dados abrangentes. Estes modelos baseiam-se principalmente no pressuposto clássico da estacionaridade de condições do local, e as suas predições são muitas vezes inadequados sob condições de um ambiente em mudança. Os modelos baseados em processos (PBMs), também conhecidos como modelos mecanísticos, modelos de processos ou modelos biogeoquímicos, têm sido utilizados para a modelação da dinâmica das florestas considerando explicitamente os processos que se acredita influenciarem a dinâmica florestal de longo prazo (ou seja, os controlos abióticos e bióticos que operam no estabelecimento, crescimento e mortalidade de árvores). Estes modelos são representações matemáticas de sistemas biológicos que incorporam o nosso conhecimento dos mecanismos fisiológicos e ecológicos em algoritmos de previsão.
O 3-PG é um modelo dinâmico de crescimento florestal, baseado em processos, que foi desenvolvido a fim de preencher a lacuna existentes entre os modelos empíricos e os modelos fisiológicos muito detalhados. É um modelo simples, com base nos processos fisiológicos selecionados por Landsberg e Waring, em 1997. Uma implementação popular do modelo 3-PG é o 3PGPJS desenvolvido por Sands (2004). A interface é fácil de usar, e com base numa folha do Microsoft Excel, que fornece todos os dados de entrada para o 3-PG e na qual são escritos os resultados, e de um suplemento do Excel que contém o código 3PGPJS e 3-PG escrito em Visual Basic for Applications. A interface permite executar o modelo de várias maneiras, como sejam: uma corrida para uma única estação, uma corrida para várias estações, uma análise de sensibilidade. Os dados mínimos necessários para correr o 3-PG são dados climáticos (temperatura média mensal, radiação solar, precipitação, déficit de pressão de vapor, dias de geada), fatores da estação (latitude da estação, capacidade máxima de água disponível armazenada no solo, classificação da fertilidade do solo numa escala de 0 a 1), condições iniciais num determinado momento (biomassa de caule, raiz e folhagem, densidade do povoamento e água no solo). Os principle outputs do 3-PG são as variáveis de estado e outras variáveis como sejam a evapotranspiração, a produtividade primária líquida (NPP), a área foliar específica (SLA), o índice de área foliar
VI
(IAF). O modelo também oferece outputs de variáveis frequentemente utilizados para apoio à gestão florestal. As saídas do 3-PG podem ser valores mensais ou anuais. O 3-PG pode ser aplicado às plantações ou a florestas relativamente homogêneas e equiénias. É um modelo de suporte genérico pois a sua estrutura não é nem local nem específico de uma determinada espécie, mas deve ser parametrizado para espécies individuais.
O objetivo desta tese é analisar a prestação do modelo 3-PG para o pinheiro silvestre (Pinus sylvestris L.) com dados da Turquia. Uma primeira etapa consistiu na identificação e organização dos dados. Foram identificados dois conjuntos de dados, o primeiro de 68 árvores abatidas com determinação de biomassa, o segundo de 135 parcelas temporárias. A ausência de dados de parcelas permanentes levou à utilização, como dados de crescimento, de tabelas de produção que foram complementadas para incluir biomassa de tronco e folhas. Para tal foi preciso ajustar, com os dados de amostragem destrutiva para biomassa, equações para as biomassas total aérea, lenhosa (lenho, casca e ramos) e de folhas. A propriedade da aditividade foi conseguida utilizando equações alométricas para as biomassas lenhosa e de folhas e a soma destas duas para a biomassa total aérea. A estimativa dos parâmetros foi obtida por ajustamento simulatâneo das três equações, usando técnicas de seemingly unrelated regression. As primeiras aplicações do modelo 3-PG basearam-se em calibrações disponíveis na literatura, seguidas da calibração de tantos parâmetros quanto possível com os dados disponíveis. Substituiram-se primeiro os parâmetros da relação alométrica para a biomassa lenhosa, assim como os parâmetros relacionados com o desbaste, estes últimos obtidos por ajustamento da linha de auto-desbaste com base nos dados das tabelas de produção. Calibraram-se depois, de forma sequencial, os parâmetros associados com o modificador da idade e os parâmetros da alocação de biomassa entre componentes da planta. O modelo mostrou resultados promissores para a biomassa aérea, mostrando algumas dificuldades para a biomassa de folhas, cujas estimativas nas tabelas de produção também pareceram questionáveis. Foram apontadas linhas de investigação para melhorar a prestação do modelo para o pinheiro silvestre na Turquia.
Palavras-chave: Modelos de produção florestal, modelos de base fisiológica, modelo 3-PG, Pinheiro silvestre (Pinus sylvestris L.), Turquia
1
CONTENTS
ACKNOWLEDGEMENTS ... II ABSTRACT ...III RESUMO ... IV RESUMO ALARGADO ... V CONTENTS ... 1 LIST OF FIGURES ... 3 LIST OF TABLES ... 4 1 INTRODUCTION ... 51.1 The study species: Scots pine ... 7
1.2 Scots pine in Turkey ... 8
2 MATERIALS AND METHODS ...12
2.1 The 3-PG Model ...12
2.1.1 Brief description of 3-PG modules ...13
2.1.2 Data required to parameterise 3-PG ...15
2.1.3 Literature review on applications of 3-PG to Scots pine ...16
2.2 Data and other information used in this thesis ...17
2.3 Calibrating 3-PG ...21
2.3.1 Allometric equation for woody biomass ...21
2.3.2 Growth data used ...22
2.3.2.1 Alemdağ’s yield tables ...22
2.3.2.2 British yield tables ...24
2.3.3 Self-thinning rule ...24
2.3.4 Climate data ...25
2.3.5 Site factor data ...26
2.3.6 Finding the 3-PG parameters for Turkey ...28
2.4 Evaluation of the 3-PG calibration ...29
2
3.1 Allometric equations for the woody, leaf and above-ground biomass ...30
3.2 Growth data ...30
3.2.1 Estimated biomass ...30
3.2.2 Comparison between Alemdağ's yield tables and British yield tables ...33
3.3 The self-thinning line ...34
3.4 Correction of the climatic data ...35
3.5 Calibration of 3-PG ...36
3.6 Simulation of thinned stands ...43
3.7 Evaluation of the 3-PG calibration ...44
4 DISCUSSION ...45
5 CONCLUSION AND FINAL REMARKS ...48
6 REFERENCES ...49
3 LIST OF FIGURES
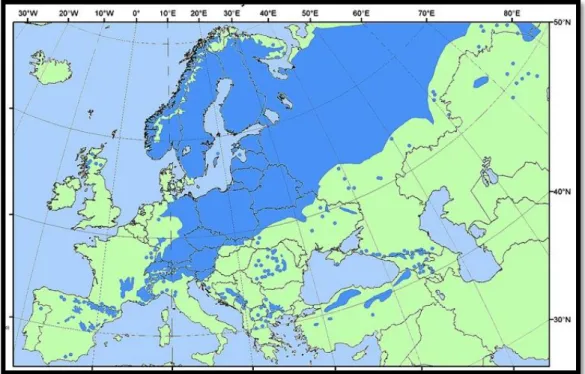
Figure 1: Pinus sylvestris L. distribution map in Europe ... 7
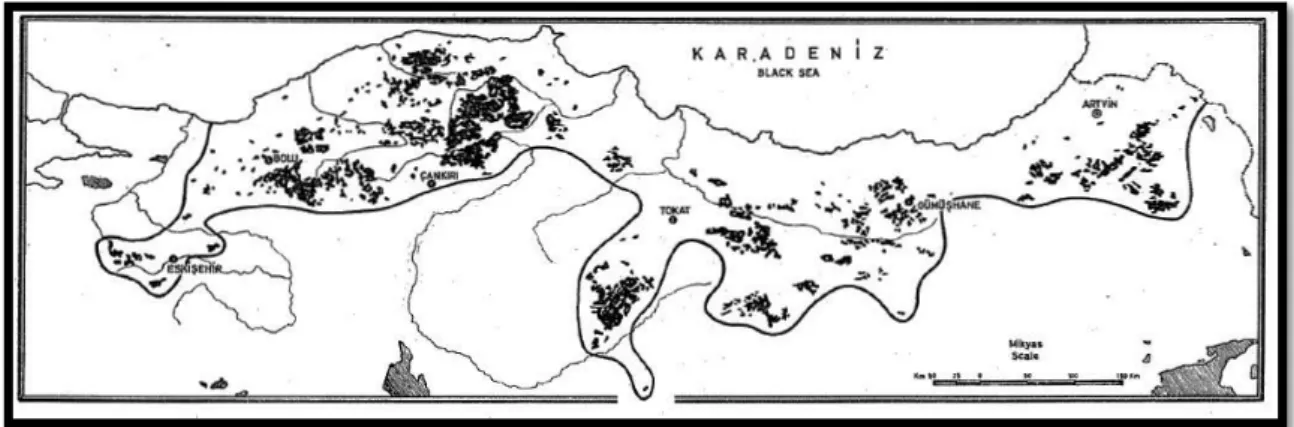
Figure 2: Natural occurrence of Scots pine in Turkey ... 8
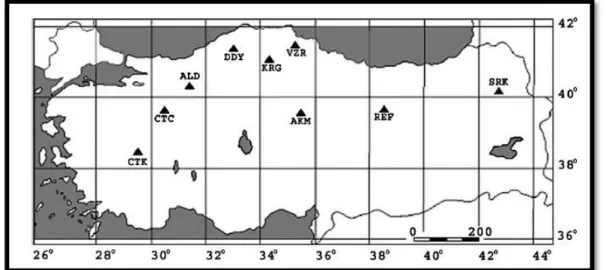
Figure 3: Seed transfer regions of Scots pine forests in Turkey ... 9
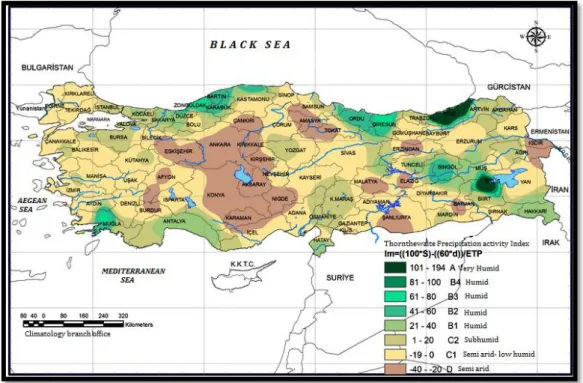
Figure 4: Illustration of climates in Turkey using the Thornthwaite climate classification ...10
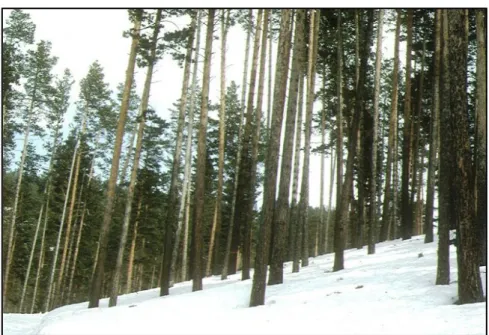
Figure 5: Seed stand of Scots pine in Kars, Sarıkamış ...11
Figure 6: Basic structure of 3-PG and the casual influences of its variables and processes 14 Figure 7: Sündiken massif and the Scots pine zone ...18
Figure 8: Biomass proportions of each components in each site ...32
Figure 9: Volume and top height comparison between the yield tables ...33
Figure 10: Self-thinning line fitted with the data from the yield tables ...34
Figure 11: Growth curves obtained for above-ground and leaf biomass and for the evolution of number of trees per ha in good sites ...38
Figure 12: Growth curves obtained for above-ground and leaf biomass and for the evolution of number of trees per ha in medium sites ...39
Figure 13: Growth curves obtained for above-ground and leaf biomass and for the evolution of number of trees per ha in poor sites ...40
Figure 14: 3-PG Simulations with a thinning regime ...43
Figure 15: Estimated leaf biomass in different site indices ...46
Figure 16: The comparison of 3-PG predictions of leaves biomass between Xenakis and our results after thinning ...46
Figure 17: The leaf biomass comparison between the one we fitted and the other with the equation from Xenakis ...47
Figure 18: Comparison of leaf biomass in tree level with several equations from different studies ...47
4 LIST OF TABLES
Table 1:The source of data required to test or parameterise 3-PG ...15
Table 2: The estimation classes to assign the parameters ...16
Table 3: The sensitivity classes to assign the parameters ...16
Table 4: Data used in this thesis ...19
Table 5: Soil classes and corresponding parameter assignments ...27
Table 6: Summary of the residual errors from the simultaneous fitting of the tree level allometric equations ...30
Table 7: Above-ground biomass in each site ...31
Table 8: Leaves and woody biomass in each site ...32
Table 9: Corrected climatic data ...36
Table 10: Tuned and fitted parameters ...37
5 1 INTRODUCTION
Forests are the most widely distributed vegetation types on earth. The world’s total forest area is over 4 billion hectares (ha), which corresponds to 31% of the Earth's land surface (FAO, 2010). In this structure, coniferous tree species are the most widely distributed gymnosperms.
Forests are one of the most important natural resources on earth but deforestation due to land-use change has reduced their extension. Around 13 million hectares of forest were converted to other uses or lost through natural causes each year in the last decade (FAO, 2010). Several important changes have been occurring in the last decades. Anthropogenic and natural gas emissions contributing to the greenhouse effect, urbanization and land-use change (Kalnay and Cai, 2003), have resulted into a change in the earth’s climate (Moore et al., 2002) with increasing air temperatures (Huang et al., 2000). Normally these have a great impact on the ecology of many ecosystems, not only in terms of carbon accumulation (Cao and Woodward, 1998) but also with an effect on ecosystem structure hierarchies in species and vegetation community levels (Walther et al., 2002) and soil carbon accumulation and decomposition (Davidson and Janssens, 2006). These are the undesirable consequences that the Kyoto protocol (UNFCCC, 1997) tries to mitigate by redefining the role of forests in the global carbon cycle and turning them into a tool for reducing national emissions (Xenakis, 2007).
In this framework, predicting the effects of environmental changes on forest growth are keystone components of sustainable forestry and management of natural resources. Such predictions rely on models and modelling chains. Forest modelling thus faces the new challenge of supporting forest management in the context of environmental change (Fontes et al., 2010). Ågren and Bosatta (1996) supported that: ”A theory is a set of concepts (the language) linked by mathematics (the tool) and used to analyse specific problems by being translated through models”.
Empirical forest growth and yield models (EMs) were developed to predict growth and yield using statistical techniques and calibrated for comprehensive data-sets (URL-1). These models primarily rely on the classical assumption of the stationarity of site conditions (Skovsgaard and Vanclay, 2008), and are often inadequate under conditions of a changing environment (Fontes et al., 2010).
Process-based models (PBMs), also known as mechanistic models, process models, or biogeochemical models, have been used for modelling forest dynamics by explicitly considering the processes that are believed to influence long-term forest dynamics (i.e., the abiotic and biotic controls operating on establishment, growth and mortality of trees). They
6
are mathematical representations of biological systems that incorporate our understanding of physiological and ecological mechanisms into predictive algorithms (URL-1). Rather than being based on empirical relationships between productivity and environmental-stand variables at small or large spatial scales, they rely on physiological processes such as photosynthesis and respiration, carbon allocation, nutrient cycles and climate effects (Fontes et al., 2010).
The 3-PG is a dynamic, process based model of forest growth developed in order to bridge the gap between empirical models and very detailed physiological models. It is a simple model based on the physiological processes selected by Landsberg and Waring in 1997.
In Australia, the process-based models PROMOD (Battaglia and Sands, 1997), CABALA (Battaglia et al., 2004) and 3-PG (Landsberg and Waring, 1997) are widely used as an adjunct to traditional forest management tools by various agencies (research, government, commercial forestry and private consultants) for diagnostic services, decision making and economic analysis (Sands, 2004). In Brazil, Aracruz Cellulose is using 3-PG as the central component of a new GIS-based management system (Almeida et al., 2003; Almeida et al., 2004b), and in South Africa 3-PG is also being used as a forest management tool both through a project funded by the South African Government Innovation Fund (National Research Foundation, 2002) and the Institute for Commercial Forestry Research (ICFR). In Portugal, 3-PG has been calibrated for Eucalyptus globulus (Fontes et al., 2006) and Pinus pinaster (Malico, 2009).
Some growth studies can be found in a literature review for forest growth models in Turkey: for Ash plantations in Adapazarı/Turkey, growth and yield prediction models developed by Carus et al. in 2007; for pure Scots pine stands, stand yield tables have been developed and are usually used, such as in the studies of Alemdağ (1967), Erdemir (1974), and a stand growth model developed by Ercanlı et al. (2007); for pure Oriental beech stands, stand yield tables developed by Kalıpsız (1962) and growth related studies have conducted by Carus (1998) and Atıcı (1998). There is growing interest worldwide in the use of the process-based model 3-PG as a tool for forest management. In spite of the importance of the use of these models to project forest growth under environmental changes, the practice of using process growth models is still not sufficiently developed in Turkish Forestry.
The objective of this thesis is to make a first application of the use of the 3-PG model for Scots pine in Turkey. The idea was to choose a species which ranges all over Turkey, has an economical value and comprehensive data readily available. Based on this approach, Scots pine was chosen to run the 3-PG because throughout much of its native range in
7
Turkey, Scots pine is an important commercial forest tree species in Turkish Forestry and widely planted for industrial and conservation activities such as protecting soil erosion and living snow fences (Turna and Güney, 2009).
The aim of this thesis is to test previous calibrations of the model 3-PG for Scots pine with data from Turkey and propose some modifications to those in order to find a set of values of the parameters of the model adapted to the country. We expect that this study will open the doors in terms of utilisation of PBMs in Turkish Forestry.
1.1 The study species: Scots pine
P. sylvestris (L.) is one of the most extensively distributed pine species in the world (Boratynski, 1991) (Figure 1). The longitudinal range of Scots pine covers over 14.000km and extends from 8°W in Spain to 141°E in Siberia. The latitudinal range of Scots pine covers over 3.700km and extends from 37°N in Turkey to 70°N in Norway, Sweden, and Finland (Critchfieldt, 1966; Pravdin, 1969; Boratynski, 1991; Morgenstern, 1996; Turna, 2003). Scots pine along with spruce (Picea alba Link.) are the most important boreal zone species in Northern and Central Europe. Especially in arid areas, Scots pine takes place instead of spruce (Çepel et al., 1978). P. sylvestris var. hamata Steven is native to the Balkan Peninsula, the northwest of Turkey, and the southwest of Transcaucasia (Davis, 1988), at altitudes of 500-2600m (Mirov, 1967), USDA hardiness zone 6 (Yılmaz and Tolunay, 2012).
8
Pinus sylvestris (L.) has several sub-species, varieties and forms which can grow in very different climatic and edaphic conditions. The species covers a diverse array of physiographic regions. For this reason, the species is noted for its immense phenotypic variability and its systematic division is still unclear (Molotkov and Patlah, 1991). It is thought that this species occurred primarily in Eastern Asia, then later spread to Europe (Molotkov and Patlah, 1991).
P. sylvestris growing up to 35m in height and 1m in trunk diameter when mature (Rushforth, 1986). The trunk is normally straight or slightly bent, while the crown has a shape varying from conical to broadly pyramidal or umbrella-like. The bark is thick, scaly dark-grey at the base while in the upper parts it is thin, flaky and orange and peels off in thin scales. The leafs are in a fascicle of two, approximately 4-7cm long bluish-green or grey-green and persistence varies from 2-4 years in warmer climates. The flowers appear during May and June, and the seed is ovate, dark-brown or grey. Shoots are grey-brown, whereas buds have 6-12mm long, with a reddish-brown colour and are normally not resinous (Vidakovic, 1991). 1.2 Scots pine in Turkey
In Turkey, Scots pine thrives between 38°34' (Kayseri-Pınarbaşı)-41°48' (Sinop-Ayancık) N latitudes and 28°00' (Bursa-Orhaneli)-43°05' (Kağızman) E longitudes (Figure 2). Scots pine area is 6,8% of total forests of Turkey and covers an area of 1.479.647ha in Turkey. 1.291.881ha of it are high forests and 187.766ha of it are commercial plantations. 751.059ha of it are well protected and 728.587ha are degraded Scots pine forests (OGM, 2013). Scots pine often forms forests of pure or mixed type, in the higher mountainous areas of North Anatolia. However, it also extends to inner and southern regions in the form of small patches (Ercanlı et al., 2013).
Figure 2: Natural occurrence of Scots pine in Turkey (Saatçioğlu, 1976 )
9
High quality Scots pine forests occur especially around Kastamonu-Elekdağı, Bolu-Aladağı, Eskişehir-Çatacık-Oltu-Göle, Sarıkamış, Dumanlı and Köse mountains. The altitudinal distribution area of the species generally ranges between 1.000-2.500m with the exceptions in Sürmene and Of where the altitude falls down to 10-15m (Gücel et al., 2008). In Sarıkamış, it is found at 2.700m above sea level. The distribution generally begins from 1.000m on the northern slopes and 1.400-1.500m on the southern slopes in Central Anatolia. Temperature and soil depth are the main factors limiting vertical and horizontal distribution of Scots pine (Tosun, 1999; Tosun and Karadağ, 2003). One of the most southern populations of the species in the world is near Çatak (Uşak) province (Semiz et al., 2007) (Figure 3).
Although Turkey is situated in a geographical location where climatic conditions are quite temperate, the diverse nature of the landscape, and the existence in particular of the mountains that run parallel to the coasts, result in significant differences in climatic conditions from one region to the other. While the coastal areas enjoy milder climates, the inland Anatolian plateau experiences extremes of hot summers and cold winters with limited rainfall (Şensoy et al., 2008).
Figure 3: Seed transfer regions of Scots pine forests in Turkey, Abbreviations: CTK= Çatak, CTC= Çatacık, ALD= Aladağ, DDY= Daday, KRG= Kargı, AKM= Akdağ madeni, VZR= Vezirköprü, REF= Refahiye, SRK= Sarıkamış.
Scale bar is 200km (Semiz et al.)
Turkey's diverse regions have different climate because of the irregularity of the topography. The Aegean and Mediterranean coasts have cool, rainy winters and hot, moderately dry summers. Annual precipitation in those areas varies from 580 to 1.300mm, depending on location (Şensoy et al., 2008). The Black Sea coast receives the greatest amount of rainfall. The eastern part of that receives 2.200mm annually and is the only region of Turkey that receives rainfall throughout the year.
10
Scots pine grows in cold-humid, semi-humid and semi-arid areas in Turkey, mainly in the Black Sea coastal mountains on warm southern slopes, where the climate is humid (Figure 4). In the inner mountains further south, which are also parallel to the Black Sea coast, the tree species grows primarily on humid northern slopes.
Three main macro climatic types occur in the distribution range of Scots pine. The climate of the Anatolian Plateau (Central Anatolia) is a steppe climate where there is a great temperature difference between day and night. Rainfall is low and there is more snow. The average temperature is 23°C in summer and -2°C in winter. The Black Sea region is wet, warm and humid with an average temperature of 23°C in summer and 7°C in winter. In Eastern Anatolia and South-Eastern Anatolia, there is a long hard winter, where year after year snow lies on the ground from November until the end of April. The average temperature is 17°C in summer and -13°C in winter (Şensoy et al., 2008).
Figure 4: Illustrates climates in Turkey using the Thornthwaite climate classification (URL-3,2014)
In the distribution area of Scots pine, the mean annual precipitation is around 400mm in arid areas and more than 1.000mm in humid areas (Atalay, 2008). Atalay (2008) stated that the most important factor for the growth of Scots pine is the direct solar radiation in the vegetation period. Scots pine is not able to vegetate in misty-foggy areas; therefore the species cannot stand dry summers with low relative humidity where evaporation is high. The mean annual temperature is around 3–4°C in the optimal sites of Scots pine in Turkey and the vegetation period is around 2-9 months (Aksoy, 2001). According to Lyr and Garbe (1994), P. sylvestris has a maximal total mass increment at 15°C root temperature.
11
In Turkey, and also in the world, it is known that Scots pine is tolerant to extreme temperatures. It can resist extreme temperature reductions especially in the winter period up to -80°C (Repo et al., 2001). In Turkey, the lowest temperature observed for Scots pine is -37°C in Kars, Sarıkamış (Aksoy, 2001) (Figure 5).
Within its distribution range, Scots pine can grow under diverse ecological conditions. Such a wide range of ecological conditions could favour the formation of a variety of ecotypes (Turna, 2003). Within its altitudinal and horizontal distribution range, P. sylvestris exhibits considerable variation in various shapes and growth characteristics (Eliçin, 1971; Turna, 2003).
Figure 5: Seed stand of Scots pine in Kars, Sarıkamış (Aksoy, 2001)
Scots pine prefers full sun, moist to dry conditions that are well drained, and an acidic sandy soil, although it also adapts to other kinds of soil. The tree species gains frost resistance beginning from autumn when the mean daily temperature reaches around 5°C in north latitudes (Repo, 1992).
Throughout much of its native range in Turkey, Scots pine is an important commercial forest tree species, widely planted for industrial and conservation activities such as protecting soil erosion and living snow fences (Turna and Güney, 2009).
12 2 MATERIALS AND METHODS
2.1 The 3-PG Model
The model called 3-PG (Physiological Principles Predicting Growth) is a simple, process-based, stand-level model of forest growth developed by Landsberg and Waring (1997). It was a deliberate attempt to bridge the gap between mensuration-based growth and yield models and process-based, carbon-balance models. It requires few parameters and only readily available site and climatic data as inputs. The 3-PG model predicts the time-course of stand development, water use and available soil water (Sands and Landsberg, 2002).
Its primary output variables are net primary production, the standing biomass in foliage, stem (above-ground woody tissue) and roots, stem number, available soil water, and transpiration. However, it also infers variables familiar to the forest manager or of use as inputs into management programs, e.g. leaf area index, mean stem diameter at breast height, main stem volume, and mean annual increment (Sands and Landsberg, 2002).
3-PG can be applied to plantations or to even-aged, relatively homogeneous forests. It is a generic stand model since its structure is neither site nor species-specific, but it must be parameterised for individual species.
The model has found numerous applications for various species (Coops et al., 2000; Landsberg et al., 2001; Sands and Landsberg, 2002; Waring, 2000; Sands, 2004; Almeida et al., 2004a; Dye et al., 2004; Esprey et al., 2004). A modified version, 3-PG Spatial, has been applied to study forest productivity across landscapes (Coops et al., 1998a, 1998b; Xenakis, 2007).
A popular implementation of 3-PG is 3PGPJS (Sands, 2004). The interface is user-friendly, based on a Microsoft Excel workbook that supplies all 3-PG input data and to which results are written, and an excel add-in containing the 3PGPJS and 3-PG code written in "Visual Basic" for applications. The input spreadsheets facilitate easy modification of site and climatic data, parameter values and run-time options. The use of normal spreadsheet operations for analysing and graphing 3-PG output gives added flexibility (Sands, 2004).
Data inputs
The inputs of the model are the climatic data and the factors describing the site: site latitude, a site fertility rating (FR), maximum available soil water (ASW), and soil texture. The nutritional status indicated by fertility rating (FR) and the values of this parameter ranges between 0 and 1, with zero it indicates an infertile site.
13
The weather inputs to run 3-PG can be long-term monthly averages or monthly averages of daily total solar radiation, mean air temperature and daytime atmospheric vapour pressure deficit (VPD), monthly rainfall and irrigation, and frost days.
3-PG outputs
The primary outputs of 3-PG are the state variables (foliage, stem and root biomass,
stem numbers and stocking, available soil water) and variables such as stand evapo-transpiration, net primary production (NPP), specific leaf area (SLA), and canopy leaf
area index (LAI).
The stand-level outputs provided by 3-PG are often used as inputs into management systems familiar to the forest managers, e.g. main-stem volume, mean annual volume increment (MAI), and mean diameter at breast height (dbh). Outputs from 3-PG can be either monthly or annual values.
The 3-PG consists of five simple submodels: biomass production; allocation of biomass between foliage, roots and stems (bark and branches included); stem mortality; soil water balance (Figure 6); a module to convert stem biomass into variables of interest to forest managers. Its state variables are the foliage, stem and root biomass pools, stem numbers or stocking, available soil water.
A brief description of each module is given (Sands, 2004) in the following.
2.1.1 Brief description of 3-PG modules Biomass production
Radiation intercepted by the canopy is determined from total incoming solar radiation and LAI through Beer’s law. Gross primary production (GPP) is proportional to intercepted photosynthetically active radiation. The proportionality factor which is called canopy quantum efficiency, takes into account environmental effects through multiplicative modifiers based on atmospheric VPD, available soil water (ASW), mean air temperature, frost days per month, site nutrition, and stand age. NPP is a constant fraction of GPP.
Biomass/Carbon allocation
Allocation of NPP to roots is determined by growing conditions as expressed by ASW, VPD and site FR. If the ASW and/or nutritional status are low, the proportion of NPP allocated to roots increases. Biomass allocation to foliage and stems depends on average tree size (i.e. dbh) in such a manner that allocation to foliage declines and that to stems increases as stands age. Dbh is determined from the mean single-tree stem mass through an allometric relationship.
14
Figure 6: Basic structure of 3-PG and the casual influences of its variables and processes
15 Stem mortality
Tree mortality can be either independent (i.e. stress-induced), or density-dependent (i.e. through self-thinning). In this thesis, the version of 3-PG in which the mortality rate is only age-related is used. Changes in stocking are also calculated using the self-thinning law (usually 3/2) to estimate an upper limit to the mean single-tree stem mass for the current stocking. If the current mean stem mass is greater than this limit, the population is reduced to a level consistent with the limit. Because suppressed trees die first, it is assumed that each tree removed has only a fraction of the biomass of the average tree.
Soil water balance
3-PG includes a single-layer soil-water-balance model working on a monthly time step. In 3-PG, rainfall (including irrigation) is balanced against evapo-transpiration computed using the Penman-Monteith equation. Canopy rainfall interception is a fraction of rainfall, and depends on canopy LAI. Soil water in excess of the intrinsic soil-water holding capacity for the site is lost as run-off (or deep drainage). Canopy conductance is determined from canopy LAI and stomatal conductance. It increases with increasing LAI up to a maximum conductance, and is affected by VPD, ASW and stand age.
2.1.2 Data required to parameterise 3-PG
In this section, the type of data required to develop and test 3-PG (i.e. to estimate species-specific parameters) are described in detail. It is necessary to give some definitions in advance in order to describe the parameters according to the processes of 3-PG. The parameters can be classified into 'data source classes', 'estimation classes' and 'sensitivity classes' for assigning values and to define the impact on the model results (Table 1, 2, 3, respectively). The classifications have been applied in Appendix 1 for 3-PG species-specific parameters.
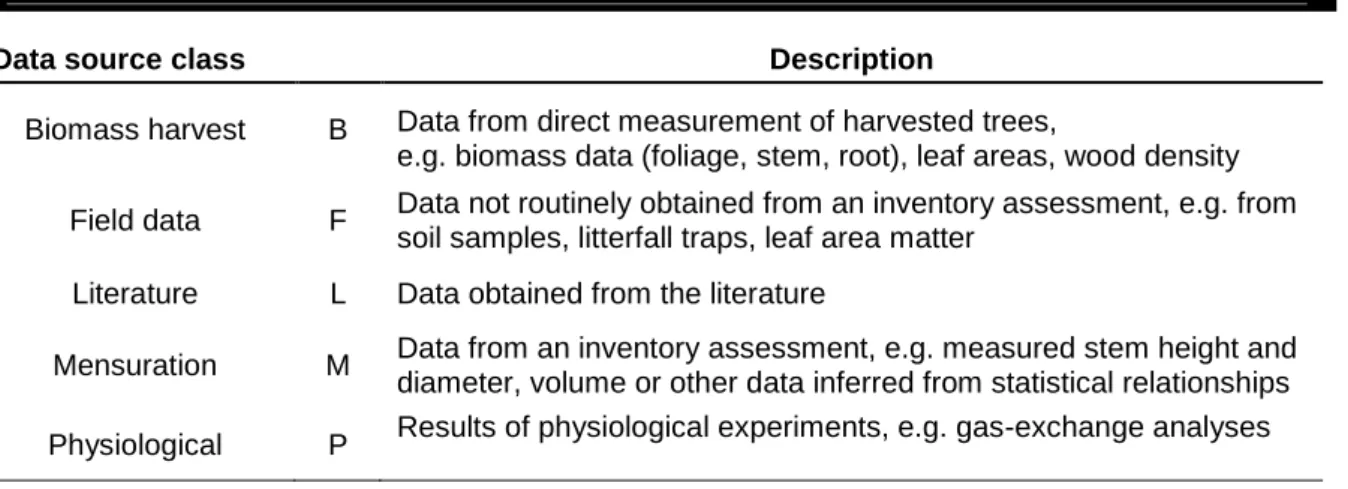
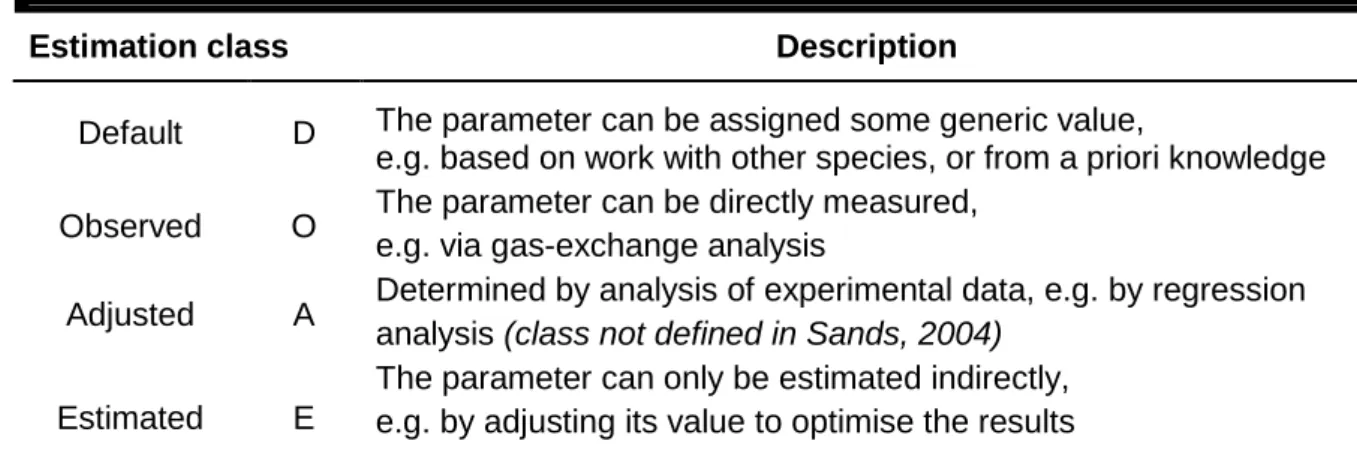
Table 1:The source of data required to test or parameterise 3-PG (Sands, 2004)
Data source class Description
Biomass harvest B Data from direct measurement of harvested trees, e.g. biomass data (foliage, stem, root), leaf areas, wood density
Field data F Data not routinely obtained from an inventory assessment, e.g. from soil samples, litterfall traps, leaf area matter
Literature L Data obtained from the literature
Mensuration M Data from an inventory assessment, e.g. measured stem height and diameter, volume or other data inferred from statistical relationships Physiological P Results of physiological experiments, e.g. gas-exchange analyses
16
Table 2: The estimation classes to assign the parameters (adapted from Sands, 2004)
Estimation class Description
Default D The parameter can be assigned some generic value,
e.g. based on work with other species, or from a priori knowledge Observed O The parameter can be directly measured,
e.g. via gas-exchange analysis
Adjusted A Determined by analysis of experimental data, e.g. by regression analysis (class not defined in Sands, 2004)
Estimated E
The parameter can only be estimated indirectly, e.g. by adjusting its value to optimise the results
Table 3: The sensitivity classes to assign the parameters (Sands, 2004)
Sensitivity class Description
Low L Outputs are essentially independent of the parameter value Medium M Outputs depend on moderately on the parameter value
High H Outputs depend strongly on the parameter value
Although these classifications are very simple, they can be used as a guideline to how the parameters might be assigned values for new species. A list of all 3-PG parameters with names, symbols and classifications can be found in Appendix 1, while a more detailed description of the model is given by Landsberg and Waring (1997) and Sands and Landsberg (2002). This table classifies the parameters, mentioning whether the parameter values are default values, or specifically taken from the station or a location, or obtained by direct observations, or by fitting a curve to the data which is already available.
2.1.3 Literature review on applications of 3-PG to Scots pine
As it is already mentioned in the introduction, the objective of this thesis is to make the first application of the 3-PG model to some forest species from Turkey. The idea was to choose a species which ranges all over Turkey, has an economical value and comprehensive data readily available. Based on this approach, Scots pine was chosen to run the 3-PG.
In this framework, a literature review identified two studies conducted with Scots pine. One of them was performed by Landsberg at al. (2005). They tested the performance of 3-PG in relation to long-term mensuration data on Scots pine (Pinus sylvestris L.) from two sites in Finland. The other one, which is the latest application of 3-PG model, was performed
17
by Xenakis (2007) for Pinus sylvestris L. in Scotland. He integrated the 3-PG model to ICBM/2N to develop a simple process and physiologically based model for forest management under a spatial framework. The model was calibrated using the Bayesian calibration framework and validated for Scots pine in Scotland.
In this thesis most of the parameters were taken from Xenakis, 2007. The primary reason is that the research from Xenakis is more recent and the secondary reason is that the landscape and the weather of Scotland is more similar to the Turkish case than Finland. Additionally, Landsberg et al. (2005) used a different allocation method.
A list of the 3-PG parameters can be found in Table 11 with the comparison of the parameters between these two studies and the parameters that were proposed for Turkey in the present thesis.
2.2 Data and other information used in this thesis
3-PG requires few parameters and only readily available site and climatic data as inputs. The model predicts the time-course of stand development, water use and available soil water (Sands and Landsberg, 2002).
In our case, the data needed to run and calibrate the 3-PG was not readily available. For this reason, we needed to gather a lot of data from different studies. The data used in this thesis is summarized in Table 4 while more detailed explanation is given below.
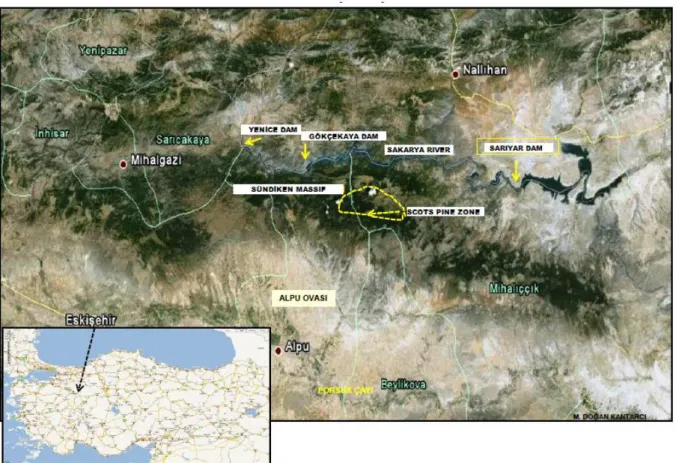
The sample plots, biomass data, and the BCEF used in this thesis are taken from the PhD thesis of Çömez (2010). Therefore the study area mentioned in this thesis refers to the study area of Çömez. The map of the study area is given in Figure 7 while more detailed description of the study area can be found in section 2.3.
Alemdağ (1967)
In this study, Alemdağ (1967) attempted to define the yield, development and management methods for Scots pine in Turkey. The study is based on 135 once-measured sample plots taken along the distribution area of the species. Site classifications were made and site index tables were arranged for Scots pine according to these classifications.
By using the data from 390 trees, a standard volume table was constructed and the increment and growth characteristics of the species were studied. The yield table applied to normal stands, therefore it is a normal yield table for untreated stands. The rotation ages were determined and appropriate management rules were explained in this study. The yield tables developed by Alemdağ are still in use in Turkish forestry.
18
Figure 7: The study area of Çömez (2010), Sündiken massif and the Scots pine zone
Çömez (2010)
In this study Çömez (2010) investigated the carbon stocks of tree biomass, understory, dead wood, forest floor, and soil, as well as carbon sequestration by trees in various Scots pine (P. sylvestris L.) stand types which are different in terms of canopy closure and development stages.
They developed equations for estimating biomass of tree compartments including stem, bark, dead branches, live branches, needles, cones, and roots. The equations enabled the calculation of the stand biomass of each stand. Besides that, they determined the basic wood density, BEF (biomass expansion factor), BCEF (biomass conversion and expansion factor) and root/shoot ratio in order to use in stand biomass estimations.
19
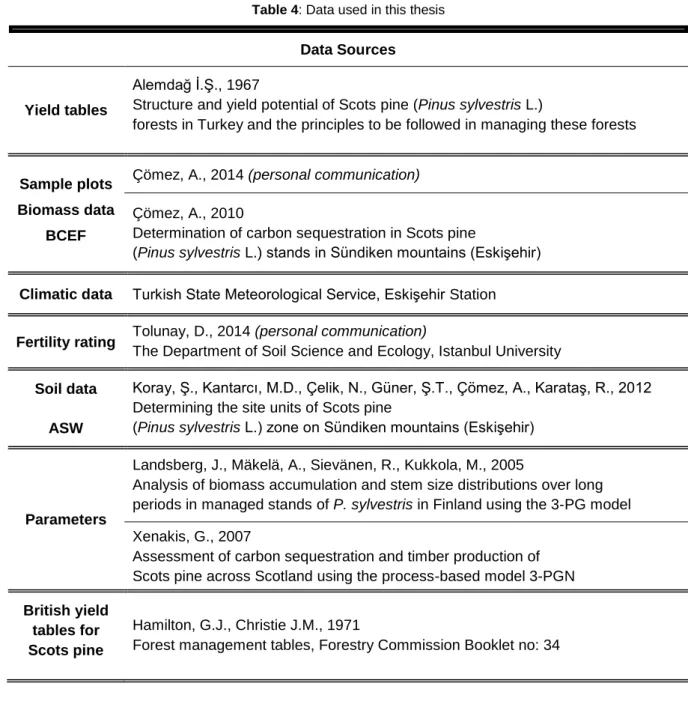
Table 4: Data used in this thesis
Data Sources
Yield tables
Alemdağ İ.Ş., 1967
Structure and yield potential of Scots pine (Pinus sylvestris L.)
forests in Turkey and the principles to be followed in managing these forests
Sample plots Biomass data
BCEF
Çömez, A., 2014 (personal communication) Çömez, A., 2010
Determination of carbon sequestration in Scots pine
(Pinus sylvestris L.) stands in Sündiken mountains (Eskişehir)
Climatic data Turkish State Meteorological Service, Eskişehir Station Fertility rating Tolunay, D., 2014 (personal communication)
The Department of Soil Science and Ecology, Istanbul University
Soil data Koray, Ş., Kantarcı, M.D., Çelik, N., Güner, Ş.T., Çömez, A., Karataş, R., 2012
Determining the site units of Scots pine
(Pinus sylvestris L.) zone on Sündiken mountains (Eskişehir)
ASW
Parameters
Landsberg, J., Mäkelä, A., Sievänen, R., Kukkola, M., 2005
Analysis of biomass accumulation and stem size distributions over long periods in managed stands of P. sylvestris in Finland using the 3-PG model Xenakis, G., 2007
Assessment of carbon sequestration and timber production of Scots pine across Scotland using the process-based model 3-PGN
British yield tables for Scots pine
Hamilton, G.J., Christie J.M., 1971
Forest management tables, Forestry Commission Booklet no: 34
Turkish State Meteorological Service (TSMS)
The Turkish State Meteorological Service, TSMS, was founded in 1937. It is the only legal organization which provides all meteorological information in Turkey. The main objectives of TSMS are: to make observations, to provide forecasts, to provide climatic data, archive data and other information, to communicate these to the public, to provide meteorological needs of army and civil aviation.
The climatic data we got from TSMS, was collected in 4 different meteorological stations. From these stations, the main station in the city center of Eskişehir, so-called "Eskişehir-Anadolu Meteorological station", was chosen because only this station has all the variables that are needed to run the 3-PG, including solar radiation, rainy days and frost days. Since the station is situated in the city center, not on the mountains where the sample
20
plots are located, we had to make corrections to convert the temperature, precipitation, frost and rainy days into values for the altitudes in which the sample plots are located. The correction is explained in the section 2.3.4.
Doğanay Tolunay (personal communication)
Doğanay Tolunay is a professor in Istanbul University specialised in soil science, forest ecology, site ecology, environmental pollution, global climate change and map compilation of sites.
He supervised Çömez in his research and in this study he gave opinion as an expert on parameters and fertility rating used to run 3-PG.
Koray et al. (2012), Eskişehir Research Institute for Forest Soil and Ecology
The study (Koray et al., 2012) was carried out in the same area that Çömez's research in 610 plots in nearly 4000 ha in total. Besides that, Çömez is one of the authors also in this research.
This study is a two-step research series which started in 2001. The aim of the study is to determine the ecological structure of the forests that constitute the Scots pine zone on Sündiken massif and to propose the silvicultural methods that should be applied on this structure.
Landsberg et al. (2005)
Landsberg et al. (2005) tested the performance of 3-PG in relation to long-term mensuration data on Scots pine (Pinus sylvestris L.) from two sites in Finland where the stands were up to 90 years old and had been thinned at approximately 5-year intervals over the last 50 years. 3-PG was used with modifications in the biomass allocation routine, for which they used data and calculations by Vanninen (2003) to estimate the allocation coefficients and turnover rates. Site fertility was estimated in terms of known site-type characteristics. The model was evaluated in terms of stand development and its ability to simulate responses to thinning.
Xenakis (2007)
Xenakis (2007) made a very comprehensive research with two main objectives. The first was to investigate the environmental factors affecting growth and carbon sequestration of Scots pine (Pinus sylvestris L.) across Scotland, by developing a knowledge base through a statistical analysis of old and novel field data sets. They developed a process-based ecosystem model 3-PGN, by coupling the existing models 3-PG and ICBM. 3-PGN was calibrated using a Bayesian approach based on Monte Carlo Markov Chain simulations and it was validated for plantations.
21
The second objective was to help close the gap between environmental research and forest management, by setting a strategic framework for a process-based tool for sustainable ecosystem management. The thesis demonstrated the procedures for a site classification scheme based on modelling results and a yield table validation procedure, which can provide a way forward in supporting policies for forest management and ensuring their continued existence in the face of the present and future challenges.
British yield tables
The yield tables by Hamilton and Christie (1971) were among the first yield tables based on a large data set. They include yield tables for most of the species in Great Britain and Scots pine is one of them. Those tables were used to compare the yield tables from Turkey which built by Alemdağ.
2.3 Calibrating 3-PG
2.3.1 Allometric equation for woody biomass
One of the components of the 3-PG model is an allometric equation for the prediction of tree woody biomass ( ) as a function of dbh. Data on the 68 trees sampled by Çömez (2010) for biomass per components determination were available to fit this equation.
As will be mentioned on section 2.3.2 (Growth data used), no data from permanent plots were available for the calibration of 3-PG, therefore growth data had to be taken from existing yield tables. This implied the need to estimate above-ground, woody and leaf biomass over time for the yield tables used. For that, (see section 2.3.2 for details) implied the use of tree level equations for above-ground, woody and leaf biomass prediction ( ,
and , respectively).
As above-ground biomass is equal to the sum of woody and leaf biomass, it is important to fit the 3 equations in a way that the aditivity property is guaranteed. This implied the fit of the following system of equations, using seemingly unrelated regression:
(1)
(2)
(3)
Where d is tree dbh and , , and are parameters estimated by seemingly unrelated regression.
The regression assumptions of normality and homoscedasticity of the model errors, were checked on each one of the models. The heteroscedasticity of the errors was assessed
22
through the analysis of the plots of the studentized residuals versus the predicted values. In case of non-homogeneous variance of the errors, weighted regression was used. The normality of the residuals was analyzed with the help of the normal QQ plots and corrected, when necessary, with robust regression using the Huber function (Myers, 1986).
The weights found when fitting the equations individually were used for each equation in the simultaneous fitting.
2.3.2 Growth data used 2.3.2.1 Alemdağ’s yield tables
In order to calibrate or validate 3-PG, it is convenient to use permanent plots in which the data comes from repeated observations at the same plot. Obtaining data from remeasured plots is time consuming and expensive, but provides highly useful data (Burkhart and Tomé, 2012). On the other hand, it is important to study the increment in a time step. The sample plots from Çömez (2010) were temporary plots which were measured only once.
As no data from permanent plots is available in Turkey, the calibration was based on the growth data from Alemdağ’s yield tables. These yield tables apply to untreated stands and include 3 site index classes. As mentioned in Landsberg et. al (2005), the model dynamically follows four independent state variables: foliage, fine root and stem mass of the stand and stocking density. Stem mass in 3-PG refers to all woody parts (stem wood, stem bark and branches), therefore we use the designation woody biomass instead. It was therefore important that the yield tables included information about those variables. As root biomass is always difficult to obtain and estimations include a lot of uncertainty, our study concentrated on leaf and woody biomass (designated respectively by and ) and, to a certain extent, on stand density.
Alemdağ's yield tables do not include nor that had to be estimated. Two methods, described below, were considered.
Method 1: Estimation based on BCEF
First, standing volume was converted to total above-ground biomass using the BCEF available from Çömez (2010). In Çömez’s research, the mean value of BCEF which can be used to calculate the above-ground biomass was 0,551 ( ⁄ ) for all stand types. According to IPCC, BCEF ranges between 0,4-1,0 and the value which is estimated by Çömez (2010) takes place in this range.
23
According to IPCC (AFOLU, 2006), transformation factors are used to convert merchantable or total volume to derive above-ground biomass and its changes. There are two types of transformation factors:
Biomass Expansion Factors (BEF) that expand the dry weight of the merchantable volume of growing stock, net annual increment, or wood removals, to account for non-merchantable components of the tree, stand, and forest. Before applying such BEFs, merchantable volume ( ) must be converted to dry-weight (t, tonne) by multiplying by basic wood density (D) in ( ⁄ ). BEFs are dimensionless since they convert between units of weight.
This method gives best results, when the BEFs have actually been determined based on dry weights, and when locally applicable basic wood densities are well known.
Biomass Conversion and Expansion Factors (BCEF) combine conversion and expansion. They have the dimension ( ⁄ ) and transform in one single multiplication growing stock, net annual increment, or wood removals ( ) directly into above-ground biomass, above-above-ground biomass growth, or biomass removals (t). Most times, BCEFs are more convenient. They can be applied directly to volume-based forest inventory data and operational records without the need of having to resort to basic wood densities. They provide best results, when they have been derived locally, based directly on merchantable volume. Mathematically, BCEF and BEF are related by (Equation 4):
BCEF = BEF
D (4)
In our work, the following equation was used to calculate the biomass as a function of volume and BCEF:
= BCEF
principal volume (5)
Where is above-ground biomass including wood, bark, branches and leaves. A second step implied the estimation of two components of , woody biomass and leaf biomass. Several methods were tested to estimate woody and leaf biomass at stand level and finally it has been decided to base this estimation on the tree level allometric equation for woody biomass. This equation was applied, for each age in the yield table, to the average tree (with the diameter equal to the quadratic mean dbh) and multiplied by stand density (N). Stand leaf biomass was then obtained by the difference between above-ground biomass and woody biomass:
24
(7)
Method 2: Estimation based on allometric equations applied to the average tree In method 2, each one of the biomass components, , and were estimated on the basis of the average tree of the stand. Equations (1), (2) and (3) were applied, for each age in the yield table, to the average tree (with the diameter equal to the quadratic mean dbh) and multiplied by stand density (N).
2.3.2.2 British yield tables
The British yield tables for Scots pine were used for a comparison with the Alemdağ’s yield tables. We thought that, even if it is developed for a different country, the comparison with the British is useful because the differences found may be used as a support for the discussion of some properties shown by the Alemdağ’s tables that seem slightly unrealistic.
The British yield tables were built for managed stands, therefore the variables that are comparable with the Alemdağ’s tables are the dominant height growth according to the Eichorn’s law (Assmann, 1970) and the total volume.
2.3.3 Self-thinning rule
As individual trees grow in size, their demands on site resources and growing space increase. When resources are no longer adequate to support the number of trees per unit area that is present, this number will decrease, this phenomena being know as self-thinning. Quantifying self-thinning relationships is important for prescribing silvicultural treatments such as thinning and for predicting forest stand development. Consequently, a number of indices have been developed to study the influence of density on self-thinning; the indices combine an expression of the size of the average tree (diameter, height, volume or biomass) with the number of trees per unit area. The best known and most commonly employed of these self-thinning or maximum size density relationships are those of Reineke (1933), Yoda et al. (1963), and Hart (1926). Reineke's stand density index is based on the relationship between numbers of trees per unit area and the quadratic mean diameter of stands.
In 3-PG, the 3/2 power law equation expresses the relationship between the woody biomass of the average tree and stand density in a logarithmic scale. This relationship is needed to obtain two of the 3-PG parameters. In order to obtain this relationship we used the data from the 3 yield tables. The following equation was fitted using linear regression:
25
The slope of this line is the thinPower (power in self-thinning rule) parameter in the 3-PG and the wSx1000 parameter (Max. stem mass per tree @ 1000 trees/hectare) can be obtained from equation (8) by making N=1000.
2.3.4 Climate data
The required climatic input data to run the 3-PG includes the following variables: daily total solar radiation (Q MJ ), mean air temperature ( °C), day-time atmospheric VPD
(D mbar), monthly rainfall (R mm ) and frost days ( ). 3-PG can use either
actual monthly weather data or long-term monthly averages. In our case, the use of yield tables as growth data, instead of real data from permanent plots, implied the use of long-term monthly averages.
The climatic data was taken from the Turkish State Meteorological Service. There were several meteorological stations around the study area, but these stations are located in the center of districts and not on the mountains. A new meteorological station, so-called "Sündiken Meteorological Station" was established two years ago in the study area on the mountains but it is still under test and two years are not enough to represent the variation in climate. Under these circumstances, one meteorological station was chosen among 4 meteorological stations located around the study area which is situated downtown of Eskişehir. The station, so-called "Eskişehir-Anadolu Meteorological Station", was able to provide all the required data to run 3-PG including solar radiation. The altitude of the meteorological station is 789m while the altitudes of the study area varies around 1.400m and 1.800m. Since there is such big difference between the altitudes of the meteorological station and the study area, it was necessary to correct the data provided from the station.
Temperature normally decreases with elevation, mainly because the source of heat is the solar energy absorbed by the soil and re-radiated into the atmosphere as thermal radiation. The lower temperatures are thus a direct consequence of the decreasing atmospheric pressure. According to Gommes (URL-4, 2002), the change in temperature as a function of elevation is normally about 0.6ºC per 100m, but it may vary significantly as a function of moisture, temperature, etc. It is relatively low (0,5ºC per 100m) for "wet" air (i.e. air saturated with water, as in clouds) and 1ºC for "dry" air (below 100% moisture).
In Çömez's thesis, they assumed that the change in temperature as a function of elevation is normally about -0,5ºC per 100m and the change in rainfall as a function of altitude is about +50mm per 100m.
Based on this approach, the temperature and precipitation values from "Eskişehir-Anadolu Meteorological Station" were corrected by applying a correction of -0,5ºC per 100m to the temperature and of 50mm per 100m for precipitation. The main problem with the
26
correction is that the calculated results can vary from the ones in reality due to the irregularities in topography.
The temperature decreases and precipitation increases as a function of elevation, therefore the frost days have to increase as a result. A method provided by Sands (3-PG workshop and course, 2004, URL-5) was followed in order to calculate the frost days:
⁄ (-2,00) 11,6 ; if <0, then 0 days of frost (9) The values obtained can be found in section 3.4, while the real data provided by meteorological station can be found in Appendix 3. Vapour pressure deficit (VPD) is also a required input which 3-PG derives it from maximum and minimum values of temperature.
There was no scientific indication or study related to the correction of the number of rainy days. So, no correction has been implemented to rainy days.
In this framework, the climatic data assigned to the file "PSP Climate" in order to run 3-PG is presented in Table 9.
2.3.5 Site factor data
The site is identified by the following site-factor keywords (Sands, 2010); latitude, fertility rating, soil class, maximum ASW and minimum ASW, which are described below with the data from the study area.
Latitude
Site latitude; the latitude of the study area varies around 39°56′-39°59′, a value of 39º. Fertility rating
3-PG requires an indication of nutritional status, which is provided through the fertility rating parameter (FR), having values between 0 and 1, with zero indicating an infertile site and with 1 indicating highly fertile site.
Nutrition is obviously an important variable but unfortunately, despite many years of research effort all over the world, our ability to describe soil nutrient status in terms usable in quantitative models of plant growth is extremely limited (Landsberg et al., 2003). Nutrient availability depends on biochemical cycling (Waring and Schlesinger, 1985; Landsberg, and Gower 1997), particularly in relation to nitrogen, so although chemical analyses may provide a guide to fertility rating (FR), a degree of expert knowledge will often be useful (Landsberg et al., 2003).
27
In this thesis, the FR of the study area was provided by Prof. Doğanay Tolunay who is an expert, specialised in soil science and forest ecology. Based on his expertise, the value of FR should be equal to 0,8 for good sites, 0,6 for medium sites and 0,3 for poor sites. Soil class
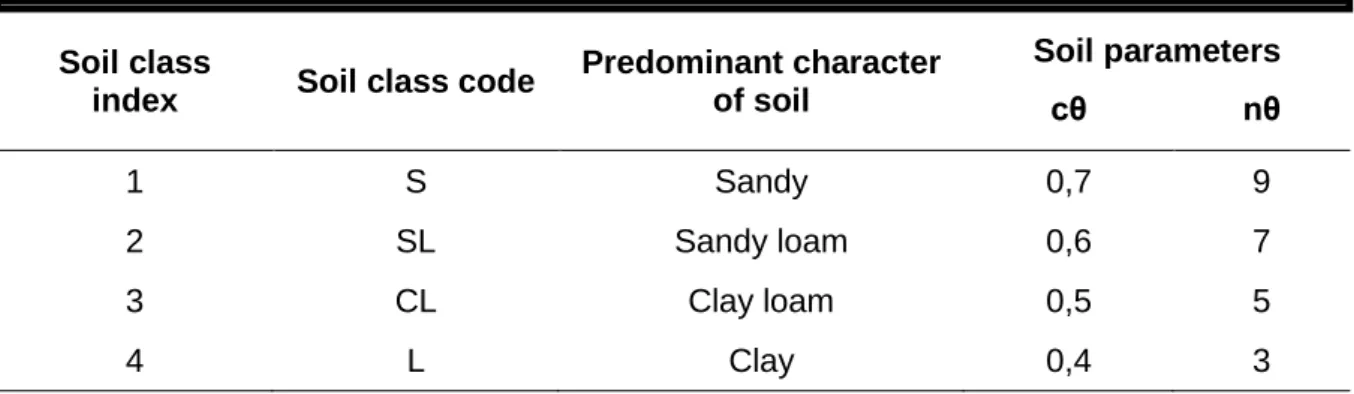
Soil classes used to specify the parameters and are based on texture: sand, sandy loam, clay loam or clay as follows.
Table 5: Soil classes and corresponding parameter assignments (Sands, 2010)
Soil class
index Soil class code
Predominant character of soil Soil parameters cθ nθ 1 S Sandy 0,7 9 2 SL Sandy loam 0,6 7 3 CL Clay loam 0,5 5 4 L Clay 0,4 3
Soil data is taken from a study, "Determining the site units of Scots pine (Pinus sylvestris L.) zone on Sündiken mountains (Eskişehir)" by Koray et al. (2012), carried out in the same area that was used for Çömez's research with 610 plots in nearly 4000 hectares
According to this research, 4 types of soil occur in the study area which are sandy loam, sandy clay loam, clay loam and loam. Sandy loam (sl) is the most widely distributed soil type in the study area, therefore this soil type was used as input when running the 3-PG. Max ASW and Min ASW
Maximum ASW can be described as the maximum available water stored in the soil (mm) (Sands, 2010). It is based on soil texture and soil water holding capacity. Minimum ASW can be described as the minimum allowed available soil water (mm) (Sands, 2010). This value is usually zero, so the value assigned for min ASW was 0.
Max ASW data was taken from the same research as soil classes (Koray et al., 2012). Water balance of the sandy loam soil on the 1.600m altitude belt of Sündiken massif with northern/ southern aspect according to the root-growth depth is given and the obtained values for max ASW are: 170mm/ ,128mm/ , 85mm/ , 43mm/ .
Based on these data, max ASW was set equal to 170mm/ for good sites and 43mm/ for poor sites. For medium sites, a value of 100mm/ , between these two values, was used.
28 2.3.6 Finding the 3-PG parameters for Turkey
Individual species in 3-PG are characterised by a set of species-specific parameters. Although 3-PG has been applied to a wide range of species, including conifers and hardwoods, in only a few cases have the species-specific parameters been rigorously determined (Sands and Landsberg, 2002).
The calibration of 3-PG was made in several steps. In a first step, the model was run for the three site qualities (good, medium and poor), using the Xenakis (2007) parameters.
As a first general rule given by Sands (2004), the parameter values should always be assigned by direct measurement, or by analogy with other species. In this framework, the second step was to analyse the impact of using the parameters that were obtained with the tree biomass data from Çömez (2010). These parameters are (Table 10) “constant in the stem mass v. diam. relationship” (aS) and “power in the stem mass v. diam. relationship” (nS).
The third step was using the thinning parameters obtained by fitting the self-thinning line with the data from the Alemdağ's yield table.
After these 3 steps, some differences between the 3-PG simulations and the growth data from the yield tables were still present. The next step was to tune the age modifier and the biomass partitioning parameters to obtain a good agreement between the 3-PG simulations and the growth data from the yield tables. The parameters involved in the tuning were (Table 10):
Age modifier: “maximum stand age used in age modifier” (MaxAge); “power of relative age in function for fAge” (nAge); “relative age to give fAge = 0.5” (rAge)
Biomass partitioning: “foliage: stem partitioning ratio @ D=2 cm” (pFS2); “foliage: stem partitioning ratio @ D=20 cm” (pFS20)
After obtaining the agreement between simulated and “observed” values of total above-ground biomass, the parameters related to volume estimation were also tuned. Here we had the problem that the volume data in the yield tables refer to over bark volume and the output from 3-PG is under bark volume and, at this moment, no information on percentage of bark was available. The following values of the parameters were obtained from the tuning, still to be confirmed with data from the percentage of bark:
Wood and stand properties: “branch and bark fraction at age 0” (fracBB0); “branch and bark fraction for mature stands” (fracBB1); “Age at which fracBB=fracBB0+fracBB1)/2” (tBB); “minimum basic density for young trees” (rhoMin); “maximum basic density for older trees” (rhoMax)
29 2.4 Evaluation of the 3-PG calibration
As mentioned before, there are no data from permanent plots established in Scots pine stands in Turkey, that would have been very useful for an evaluation of the 3-PG calibration presented in this thesis.
After finishing the calibration with the growth data from the yield tables for untreated stands, the 3-PG was used to simulate thinned stands using a thinning regimes close to the one presented in the British yield tables. First thinning was considered at 20 years in good and medium sites with 5 years interval and after 25 years the thinning periodicity was set to 10 years till 85 years, the last thinning applied to stands is in 100 years. For poor sites the first thinning was considered at 30 years with 5 years interval and after 35 years the thinning periodicity was set to 10 years till the stand reaches 85 years of age and the last thinning applied to poor sites is when the stand reaches 100 years of age. At any thinning the number of trees per ha of the residual stand was set to the number presented in the British yield tables (according to yield class 10, 8, 4, respectively). The value of the F, R and S parameters that define the relationship between the average thinned tree to the average tree of the stand were adjusted for each site along stand age as the stands gets more homogenous with age (Figure 13).
The evaluation was mainly based on the analysis of the outputs obtained for untreated stands (Alemdağ’s yield tables) and also for stands thinned as suggested in the British yield tables. In both cases, data from temporary plots with a similar site index and stand density were compared with the 3-PG simulations. Of course that the past silvicultural treatments that occurred in temporary plots are unknown but nevertheless, this plots can be useful as they show the general agreement of the model with measured plots.