1Universidade Federal de São Paulo, Departamento de Políticas Públicas e Saúde Coletiva, Programa de Pós-Graduação
Interdisciplinar em Ciências da Saúde. Campus Baixada Santista, Av. Ana Costa, 95, Vila Mathias, 11060-001, Santos, SP, Brasil. Correspondência para/Correspondence to: SB MESCOLOTO. E-mail: <[email protected]>.
Evaluation of a mobile application
for estimation of food intake
Avaliação de um aplicativo móvel para
a estimativa de ingestão alimentar
Samantha Bittencourt MESCOLOTO1
Simone CAIVANO1
Semíramis Martins Álvares DOMENE1
A B S T R A C T
Objective
Evaluate the use of the Nutrabem (São Paulo, Brasil) mobile application as a tool for measurement of food intake among university students.
Methods
Cross-sectional study of a random sample of 40 undergraduate students at the Universidade Federal de São Paulo, Campus Baixada Santista. Food intake data were estimated using the Nutrabem app and the 24-hour dietary recall. Intakes of energy, carbohydrates, proteins, lipids, calcium, iron, and vitamin C were calculated. The intake of food groups and diet quality were evaluated by the Diet Quality Index associated with the Digital Food Guide. The agreement between the methods was assessed using the Pearson’s correlation coefficient and the Student’t-test.
Results
Strong correlations were observed between energy (0.77), carbohydrates (0.82) and protein (0.83). The groups: poultry, fish, and eggs; beef and pork; refined grains and breads; and fruits and legumes showed strong correlations (between 0.76 and 0.85). There were moderate correlations (0.59 and 0.71) between the groups sugars and sweets; whole grains, tubers and roots, milk and dairy products, animal fats, and the Diet Quality Index associated with the Digital Food Guide scores. Vegetables and leafy greens, nuts, and vegetable oils showed weak correlations (0.31 and 0.43). Homogeneity assessment revealed similarity between the results obtained by both methods (p>0.05).
Conclusion
The Nutrabem app can be used as a tool to assess dietary intake among university students since it produces results similar to those obtained by the 24-hour dietary recall method.
R E S U M O
Objetivo
Avaliar a utilização do aplicativo Nutrabem (São Paulo) como recurso para a medida da ingestão alimentar entre universitários.
Métodos
Estudo transversal conduzido em uma amostra aleatória com 40 universitários adultos da Universidade Federal de São Paulo, Campus Baixada Santista. Os dados de ingestão alimentar foram estimados por meio do aplicativo Nutrabem e pelo Recordatório de 24 horas; foram calculados os valores de ingestão de energia, carboidratos, proteínas, lipídeos, cálcio, ferro e vitamina C; avaliou-se ainda a ingestão segundo grupos alimentares e qualidade da dieta conforme o Índice de Qualidade da Dieta associado ao Guia Alimentar Digital. A concordância entre os métodos foi estimada pelo coeficiente de correlação linear Pearson e Teste-t.
Resultados
Foram observadas correlações fortes para energia (0,77), carboidratos (0,82) e proteínas (0,83). Os grupos aves, pescados e ovos, carnes bovina e suína, cereais e pães refinados, frutas e leguminosas apresentaram correlações fortes (entre 0,76 e 0,85); açúcares e doces, cereais integrais, tubérculos e raízes, leite e derivados, gorduras de origem animal e a pontuação do Índice de Qualidade da Dieta associado ao Guia Alimentar Digital apresentam correlações moderadas (0,59 e 0,71); hortaliças, oleaginosas e os óleos vegetais apresentam correlações fracas (valores entre 0,31 e 0,43). A avaliação de homogeneidade dos dados mostrou haver semelhança entre os resultados obtidos por ambos os métodos (p>0,05).
Conclusão
O aplicativo Nutrabem pode ser mais uma ferramenta no estudo de ingestão alimentar de jovens universitários, uma vez que produz resultados semelhantes aos obtidos pelo Recordatório de 24 horas.
Palavras-chave: Dieta. Inquéritos sobre dieta. Vigilância nutricional.
I N T R O D U C T I O N
Eating habits have positive and negative effects on human health. It has been shown that
an adequate intake of in natura and minimally
processed foods is associated with prevention of
chronic diseases1-3. On the other hand, excessive
intake of refined grains, fats, and added sugars is one of the main factors causing the obesity
epidemic4. Thus, the knowledge about the
population food intake pattern is of great
importance5,6.
Food intake can be estimated using different methods, and the most commonly used are the Food Frequency Questionnaire (FFQ), the food diary, and the 24-hour (24hr) dietary recall interview. The 24hr is the most widely used method for quantitative assessment of the intake of energy and nutrients. However, it requires the availability of the respondent, the presence of a trained interviewer, and its data collection and processing require a considerable amount of
time7. In order to increase the reliability of the
results, the 24hr method is usually administered three times to reduce errors arising from
intraindividual variability8-10. Moreover, it is
suggested that an interview protocol is used to reduce interviewer and recall bias, common in
retrospective methods11,12.
There have been significant changes in the food intake assessment in terms of data collection and analysis due to the advances in mobile
technology, reducing the complexity of these
tasks7. Over the past few years, several Internet
and mobile telephony applications have been developed to promote self-care aiming at motivating users to adopt a healthy lifestyle. The advances and diffusion of this technology also contribute to the usability of mobile platforms for
apps that promote good health and wellbeing13.
In Brazil, the Guia Alimentar Digital (GAD, Digital
Food Guide), built in the Nutrabem (NutraBem
the first tool offered for this purpose. Nutrabem, an innovative product that was launched in April 2009, results from the scientific cooperation
between the Nutrabem Company and
Univer-sidade Federal de São Paulo (Unifesp) researchers.
Another benefit of this technology is that mobile apps help professionals assess dietary
intake9,14. It has been shown that the use of digital
media to collect data on dietary intake is more effective and less time consuming for the interviewer since gathering and analyzing food
intake data is a complex task7,14,15. Therefore,
methods that use information and communication technology contribute to the quality and accuracy
of dietary intake data16, promoting the interaction
between the patient and the healthcare
professional13 and supporting dietary intake
studies11 .
To our knowledge, in Brazil, there is no study on the use of mobile apps as a tool to assess food intake.
The main purpose of this study is to evaluate the use of the Nutrabem mobile app as a tool for measurement of food intake among university students by comparing its data with those obtained using the 24hr method.
M E T H O D S
Cross-sectional study of a random sample of 40 undergraduate students at the
Unifesp – Campus Baixada Santista of both sexes
and aged 20-24 years. Exclusion criteria were: students who did not agree to sign the consent form; be an undergraduate student in Nutrition; be undergoing dietary intervention treatment; not
owing a smartphone; had used the Nutrabem app
prior to the start of the study.
A preliminary experiment was conducted on a random sample of ten university students with the same characteristics of the study subjects in order to assess the intrapersonal and interpersonal variability within the group. This experiment indicated that a sample of 40
individuals would be able to produce results accurate enough to identify significant differences in the variables of interest in this study with the power of 0.8.
Students’ dietary intake was estimated
using the Nutrabem mobile application and the
24hr method. Data were collected over three days (with a time interval), including 1 weekend day, using the two methods to estimate the usual intake of each subject calculating the average of these results. The 24hr interviews were always conducted on the day after the app was used in order to consider the same food record added to the app by the student. There was a maximum interval of two weeks between the first and third day of data collection.
Dietetic variables analyzed and compared by the 2 methods were: energy, carbohydrates, proteins, lipids, calcium, iron, and vitamin C. Energy and the macronutrients were assessed to determine the sensitivity of the method proposed to variables that are important in dietary assessment. Calcium and iron were assessed due to the high prevalence of inadequate intake of these micronutrients, and vitamin C was
considered as the diet quality indicator of in natura
food intake17.
The Diet Quality Index associated with
GAD developed and validated by Caivano &
Domene10 was adopted. It was also used in the
conversion of food intake data into the following food groups: sugars and sweets; poultry, fish, and eggs; beef and pork; refined grains and breads; whole grains; tubers and roots; fruits, animal fats; vegetables and leafy greens; legumes; nuts; milk
and dairy products; and vegetable oils. The Diet
Quality Index associated with the GADwas used to determine the final diet quality result.
The research participants were introduced
to the Nutrabem app and were given instructions
on how to use it. The apphas an intuitive design,
it is easy to use and provide objective information
about its operation and functions13. Its functions
informing the amounts in common household measures or according to weight for each one of the meals (breakfast, mid-morning snack, lunch, mid-afternoon snack, dinner, and late-evening snack). To start using the app, the user has to enter his/her personal and anthropometric data (weight and height). Then, information is entered in a linear way, and the foods consumed are added according to the date and meal by typing the information of each item. The user then
checks the Nutrabem app household measures
list and enters the amount of each food or drink consumed. At the end of each day, user sends the data added to the app to the researcher by e-mail from the mobile app.
The interviews were conducted by trained researchers to reduce interviewer bias. The method was applied using the Multiple-Pass
Method18.
Dietary intake data obtained through the two instruments were analyzed to obtain the
nutrition information using the Nutrabem Pro
food composition database19, created based on
the Tabela Brasileira de Composição dos
Alimen-tos (Taco, Brazilian Table of Food Composition)20
and the Food Composition Table (United States
Department of Agriculture)21. Intakes of energy,
macronutrients, calcium, iron, and vitamin C obtained by the two methods were entered and processed into the Statistical Package for Social
Sciences (SPSS, Chicago, Illinois, United States of America). The agreement between the data collected by the 24hr interviews and the app concerning each variable of interest was assessed
using the Pearson’s correlation coefficient and the
Student’s t-test. Additionally, the correlation
between the mean values of the portion sizes of food groups consumed (poultry, fish, and eggs; beef and pork; refined grains and breads; fruits and legumes; sugars and sweets, whole grains, tubers and roots; milk and dairy products; animal fats; vegetables and leafy greens; nuts; and
vegetable oils) and the Diet Quality Index (GAD)6
scores obtained by both methods were assessed.
This study followed the recommendations of the National Council on Ethics in Human Research and was approved by the Research Ethics Committee of the Unifesp (Protocol nº 921.257), on December 16, 2014.
R E S U L T S
The sample of 40 subjects was composed of 34 women (85%); the average age of the respondents was 21 years (Standard Deviation [SD]=1.22).
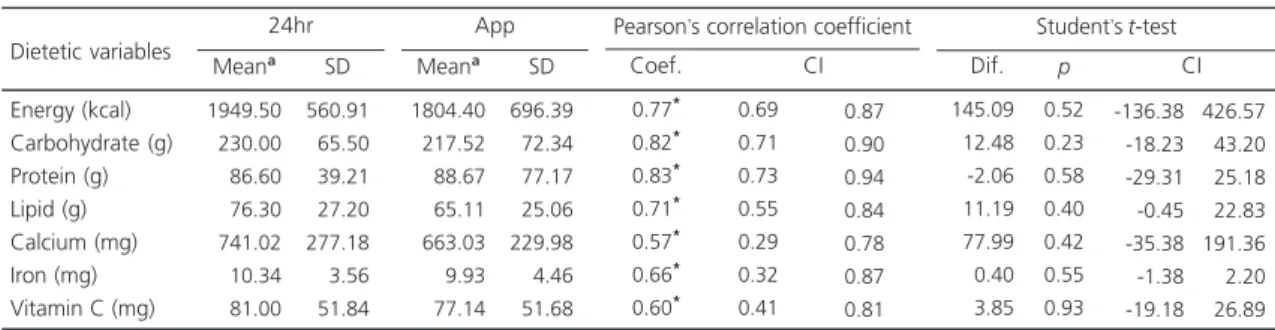
The mean and standard deviations of energy and nutrient intake estimated by the two methods are shown in Table 1.
There were no statistically significant differences between the energy nutrient intakes
Table 1. Means and Standard Deviation (SD) of energy and nutrient intake of university students and assessment of agreement
between dietary intakes estimated by the 24-hour dietary recall (24hr) and the Nutrabem app. Brazil, 2015.
Energy (kcal) Carbohydrate (g) Protein (g) Lipid (g) Calcium (mg) Iron (mg) Vitamin C (mg)
1949.50 0230.00 0086.60 0076.30 0741.02 0010.34 0081.00 560.91 065.50 039.21 027.20 277.18 003.56 051.84
Note:*p<0.01. aMean values of three assessments.
SD: Standard Deviation; Coef.: Coefficient; CI: Confidence Interval; Dif.:Difference.
Dietetic variables
Meana SD
24hr 1804.40 0217.52 0088.67 0065.11 0663.03 0009.93 0077.14 696.39 072.34 077.17 025.06 229.98 004.46 051.68
Meana SD
App 0.77* 0.82* 0.83* 0.71* 0.57* 0.66* 0.60* 0.69 0.71 0.73 0.55 0.29 0.32 0.41 Coef. CI
Pearson’s correlation coefficient
0.87 0.90 0.94 0.84 0.78 0.87 0.81 -145.09 -012.48 00-2.06 -011.19 -077.99 -000.40 -003.85 0.52 0.23 0.58 0.40 0.42 0.55 0.93 Dif. CI
Student’s t-test
(p<0.05), indicating agreement between the methods for all variables assessed.
There was a strong correlation between the methods for energy (0.77, Confidence Interval [CI]=0.69-0.87), carbohydrates (0.82, CI=0.71-0.90) and protein (0.83, CI=0.73-0.94) intakes. There were moderate correlations between the values of lipids, iron, calcium, and vitamin C (0.71, 0.66, 0.57, and 0.60, respectively).
Table 2 shows the mean values of the portion sizes of food groups consumed, the IQD-GAD scores estimated based on the data obtained by both methods, and the correlation coefficients. Strong correlations were observed for the groups: poultry, fish, and eggs; beef and pork; refined grains and breads; fruits and legumes (between 0.76 and 0.85). The groups: sugars and sweets; whole grains; tubers and roots; milk and dairy products; animal fats and the Diet
Quality Index – GAD scores showed moderate
correlations (0.59 and 0.71). Finally, the groups: Vegetables and leafy greens; nuts; and vegetable oils showed weak correlations (0.31 and 0.43).
A quantitative analysis was carried out for each food item evaluated by both methods to determine any differences in intake. However, although there were differences between the two
methods, there were no significant quantitative differences since the increase or the under-report of intake was similar in both methods.
D I S C U S S I O N
The present study compared the energy and nutrient intake data among university adults estimated by the 24hr method with the data
obtained using the Nutrabem app to estimate the
agreement between these methods. There was
agreement between the two methods (p>0.05)
for all parameters analyzed.
The strong correlations between energy, carbohydrates, and protein, and the moderate correlation between lipids, iron, calcium, and vitamin C found in this study are similar to those
found by Touvier et al.22. The authors reported
dietary intake data obtained by the 24hr method and by a web-based dietary recording. The authors reported good agreement and reproducibility between the methods for the following variables: food groups, energy, nutrients, and user satisfaction, with correlation values ranging from 0.6 to 0.9 for nutrients, which also indicated moderate to strong correlations.
Table 2. Mean values of the portion sizes of food groups consumed among university students assessment of agreement between
dietary intakes estimated by the 24-hour dietary recall (24hr) and the Nutrabem app. Brazil, 2015.
Poultry, fish, and eggs Sugars and sweets Beef and pork
Refined grains and breads Whole grains, tubers and roots Vegetables and leafy greens Milk and dairy products Fruits
Animal fats Legumes Nuts Vegetable oils Diet Quality Index Food groups 01.65 05.15 01.68 03.11 00.71 01.12 01.84 00.73 01.46 00.34 00.08 02.10 39.49 1.45 3.16 1.27 1.35 0.86 0.56 1.18 0.60 1.59 0.41 0.23 1.28 7.46 24hr
Meana SD
01.72 04.95 01.80 03.02 00.76 01.02 01.50 00.69 00.99 00.32 00.07 01.52 39.48 2.69 3.29 1.37 1.54 0.86 0.99 0.82 0.59 1.06 0.34 0.28 0.71 8.16 App Mean SD 0.85** 0.68** 0.76** 0.82** 0.71** 0.43** 0.59** 0.78** 0.68** 0.85**
0.31**
0.37**
0.64** -0.71 -0.47 -0.43 -0.64 -0.23 -0.34 -0.43 -0.64 -0.42 -0.70 -0.08 -0.05 -0.38
Pearson’s correlation coefficient Coefficient CI 0.95 0.87 0.93 0.92 0.91 0.77 0.78 0.89 0.92 0.95 0.92 0.68 0.82
Note: *p<0.05; **<0.01. aMean values of three assessments.
In a similar study with adolescents, other authors compared a web-based self-administered record with the 24hr interview conducted by dietitians and found strong correlations between
energy and nutrient intake, with values ≥0.86.
As for the food groups, the analyses showed
moderate to strong correlations (≥0.72); data
similar to those obtained in this study23. In the
study mentioned above, Touvier et al.22 considered
different food groups from those evaluated in the present study, which hinders comparison. However, for similar groups, the results of the following groups were consistent: beef; poultry, fish, and eggs and fruits, which showed strong correlations. sugars and sweets, tubers, milk and dairy products, and animal fats showed moderate correlations, and, unlike the findings of this study, there were no weak correlations. The groups of legumes, whole grains, nuts, and vegetable oils
and the Diet Quality Index – GAD scores were
not assessed by the authors.
The tool used in the present study showed some limitations. One of them is that when the data were collected some more updated Android smartphones did not have the “delete food” function. This function was a feature that was activated by a specific button that was included only in the initial smartphone models. Therefore, when the food information added was wrong, the users of these devices were asked to point out these foods when sending their dietary intake information to the researcher. This problem has already been solved by the manufacturer. Another limitation found by the quantitative analyses of each food item is related to the underreporting of foods consumed, which was observed in both protocols. This finding is in agreement with the
findings of Vance et al.24, who compared the food
intake data obtained using a web-based dietary assessment tool and data obtained using the 24hr method to assess energy under-reporting. The data were assessed as a function of gender and nutritional status, and the results showed evidence of similar under-reporting of energy intake in both instruments. This finding can be attributed to the subjective dimensions of
nutrition, the respondent’s memory, the
willingness of the respondents to provide answers, and the extent to which the respondents understand instructions; these are the dimensions that usually lead to biased results and data inconsistency. Inadequate identification of foods and recipes by the participants was also detected in both methods based on a comparative analysis
of food entered into the Nutrabem app and
corresponding information given in the 24hr method. This information accounts for only 2.52% of the listed items. However, this limitation cannot be characterized as a unique limitation of the object of our study of this study because even during the interview with a previously trained interviewer (24hr) there may be misunderstanding
during information collection22-24.
Furthermore, one must consider that the effect of exposure to successive employment of the methods, common in comparative assessments, can mask recall bias that is usually observed in
retrospective methods4,7,22.
Another limitation of the present study is related to the fact that the sample was mainly composed of females, which suggests a possible selection bias. However, the Unifesp 2015 census showed that women outnumbered men in the university admissions, accounting for 54.6% of
the admissions in 2015. The Santos Campus had
the highest admission rate for women in the same
year, with 65.8%25.
It is suggested that the quality of the assessment carried out by digital instruments may reduce as a function of age and improve as a function of level of education and computer
knowledge of the participants26. Therefore, the
population of the present study represents a potential audience for this type of evaluation. Further investigations should assess the performance of this tool for the general population.
demographic strata, regardless of the age of the
population27. Castell et al.28 and Baldo et al.29
believe that digital technology is an interesting and useful tool for dietary intake recording and assessment. Among its benefits are the reduction of interviewer bias and the reduction of time and cost of data collection. The advantage of digital technology is demonstrated by the quality of data collection compared to that of the conventional
methods26.
The present study showed agreement between the methods used to estimate dietary intake for the nutritional variables, energy, and six nutrients, representing a larger number of variables than that reported in most studies available, which usually consider only the
macronutrients30. Based on the data analysis, it
can be said that the use of digital technology improves the quality of the data collected when compared to the use of conventional methods,
as shown in similar studies22,23,28,29. The present
study demonstrates the potential of the Nutrabem
app to support nutritional assistance.
C O N C L U S I O N
Analysis of the agreement between the results obtained by the 24hr method and the Nutrabem app allow us to conclude that this mobile application can be used by dietitians as another tool to assess the dietary intake of university students in terms of energy, carbohydrates, proteins, lipids, calcium, iron, and vitamin C since it produced similar results to those obtained by 24hr method. Further investigations are needed to identify limitations related to the correlations found between the food groups and to allow extrapolating the results to other populations.
Although the identified mobile app limitations can be corrected by the dietitian during data collection, the necessary adjustments discussed in this study may indicate the need for improvements in mobile technology to enhance the quality of the collection and processing of data in future studies.
This study showed the need for further investigations focusing on the improvement of digital methods to assess dietary intake and thus increase the number of available tools for monitoring nutrition indicators and positively impact the health of the population.
C O N T R I B U T O R S
SB MESCOLOTO contributed to conception and study design; collection and interpretation of data. S CAIVANO contributed conception and study design, and interpretation of data. SMA DOMENE contributed to conception and study design. All authors contibuted to writing and critical review of the article and approval of the version to be published.
R E F E R E N C E S
1. World Health Organization. Assessing national capacity for the prevention and control of noncommunicable diseases: Report of the 2010 global survey. Geneva: WHO; 2012.
2. Brasil. Ministério da Saúde. Guia alimentar para a população brasileira. Brasília: Ministério da Saúde; 2014.
3. Katz D, Meller S. Can we say what diet is best for health? Annu Rev Pub health. 2014;35:83-103. 4. Drewnowski A, Kawachi I. Diets and health: How
food decisions are shaped by biology, economics, geography, and social interactions. Big Data. 2015;3(3):193-7.
5. Anjos LA, Souza DR, Rossato SL. Desafios na me-dição quantitativa de ingestão alimentar em estu-dos populacionais. Rev Nutr. 2009;22(1):151-61. https://doi.org/10.1590/51415-5273200900 0100014
6. Barbosa RMS, Colares LGT, Soares EA. Desen-volvimento de guias alimentares em diversos países. Rev Nutr. 2008;21(4):455-67. https://doi.org/10. 1590/S1415-52732008000400010
7. Domene SMA. Avaliação do consumo alimentar. In: Taddei JA, Lang RMF, Longo-Silva G, Toloni MHA. Nutrição em saúde pública. Rio de Janeiro: Rubio; 2011. p.8-21.
9. Holzinger A, Dorner S, Födinger M, Valdez AC, Ziefle M. Chances of increasing youth health awareness through mobile wellness applications. LNCS. 2010;6389:71-81.
10. Caivano S, Domene SMA. Diet quality index for healthy food choices. Rev Nutr. 2013;26(6):693-9. https://doi.org/10.1590/S1415-527320130006 00008
11. Thompson FE, Subar AF, Loria CM, Reedy JL, Baranowski T. Need for technological innovation in dietary assessment. J Am Diet Assoc. 2011;110(1):48-51. https://doi.org/10.1016/j.jada. 2009.10.008
12. Fisberg RM, Marchioni DML, Colucci ACA. Ava-liação do consumo alimentar e da ingestão de nutrientes na prática clínica. Arq Bras Endocrinol Metab. 2009;53(5):617-24.
13. Caivano S, Ferreira BJ, Domene SMA. Avaliação da usabilidade do Guia Alimentar Digital móvel segundo a percepção dos usuários. Rev Ciên Saúde Coletiva. 2014;19(5):1437-46 https://doi.org/10.15 90/1413-81232014195.13932013
14. Liu C, Zhu Q, Holroyd KA, Seng EK. Status and trends of mobile-health applications for iOS devices: A developer’s perspective. J Syst Software. 2011;84(11):2022-33. https://doi.org/10.1016/j. jss.2011.06.049
15. Parker AG, Harper R, Grinter RE. Celebratory healthy technology. J Diab Science Techny. 2011;5(2):319-24.
16. Rodrigues AGM, Proença RPDC. Use of food images for evaluating food intake. Rev Nutr. 2011;24(5):765-76. https://doi.org/10.1590/S14 15-52732011000500009
17. Instituto Brasileiro de Geografia e Estatística. Pes-quisa de orçamentos familiares 2008-2009: análise do consumo alimentar pessoal no Brasil. Rio de Janeiro: IBGE; 2011.
18. Moshfegh AJ, Rhodes DG, Baer DJ, Murayi T, Clemens JC, Rumpler WV, et al. The US department of agriculture automated multiple-pass method reduces bias in the collection of energy intakes. Am J Clin Nutr. 2008;88(2):324-32.
19. Caivano S, Domene SMA, Anunciato T. Nutrabem Pro. São Paulo: NutraBem Consultoria; 2009 [acesso 20 fev 2016]. Disponível em: http://Nutrabem.com. br/site/instituto-nutra-bem
20. Universidade Estadual de Campinas. Tabela Bra-sileira de Composição de Alimentos – Taco. 4ª ed. Campinas: Unicamp; 2011 [acesso 20 fev 2016]. Disponível em: http://www.unicamp.br/nepa/taco/ contar/taco_4_edicao_ampliada_e_revisada 21. United State Department of Agriculture. National
nutrient database for standard reference release,
nº 27. Washington (DC): USDA; 2001 [cited 20 Fev 2016]. Available from: http://ndb.nal.usda.gov/ndb/ search/list
22. Touvier M, Kesse-Guyot E, Méjean C, Pollet C, Malon A, Castetbon K, et al. Comparison between an interactive web-based self-administered 24h dietary record and an interview by a dietitian for large-scale epidemiological studies. Br J Nutr. 2011;105(7):1055-64. https://doi.org/10.1017/ S0007114510004617
23. Vereecken CA, Covents M, Sichert-Hellert W, Alvira JMF, Le Donne C, De Henauw S, et al. Development and evaluation of a self-administered computerized 24-h dietary recall method for adolescents in Europe. Int J Obes. 2008;32(Supl.5):S26-S34. https:// doi.org/10.1038/ijo.2008.180
24. Vance VA, Woodruff SJ, McCargar LJ, Husted J, Hanning RM. Self-reported dietary energy intake of normal weight, overweight and obese adolescents. Public Health Nutr. 2009;12(2):222-7. https://doi.org/10.1017/S1368980008003108 25. Universidade Federal de São Paulo. Análise do perfil
de estudantes ingressantes da Universidade Federal de São Paulo. São Paulo: Unifesp; 2016 [acesso 5 set 2016]. Disponível em: http://www.unifesp.br/ reitoria/prae/images/prae/Informativo/Analise_ perfil_estudantes_executiva.pdf
26. Klovning A, Sandvik H, Hunskaar S. Web-based survey attracted age-biased sample with more severe illness than paper-based survey. J Clin Epidemiol. 2009;62(10):1068-74. https://doi.org/ 10.1016/j.jclinepi.2008.10.015
27. Touvier M, Mejean C, Kesse-Guyot E, Pollet C, Malon A, Castetbon K, et al. Comparison between web-based and paper versions of a self-administered anthropometric questionnaire. Eur J Epidemiol 2010;25(5):287-96. https://doi.org/10.1007/s10 654-010-9433-9
28. Castell GS, Serra-Majem L, Ribas-Barba, L. What and how much do we eat? 24-hour dietary recall method. Nutr Hosp. 2015;31(Supl.3):46-8. https:// doi.org/10.3305/nh.2015.31.sup3.8750
29. Baldo C, Zanchim MC, Kirsten VR, De Marchi, ACB. Diabetes Food Control: um aplicativo móvel para avaliação do consumo alimentar de pacientes diabéticos. Rev Eletron Comun Inf Inov Saúde. 2015;9(3):1-12.
30. Selem SSC, Carvalho AM, Verly-Junior E, Carlos JV, Teixeira JA, Marchioni DML, et al. Validade e reprodutibilidade de um questionário de frequência alimentar para adultos de São Paulo, Brasil. Rev Bras Epidemiol. 2014;17(4):852-9. https://doi.org/ 10.1590/1809-4503201400040005