1
Universidade Estadual de Campinas, Faculdade de Ciências Médicas, Programa de Pós-Graduação em Gerontologia. R. Tessália Vieira de Camargo, 126, Cidade Universitária Zeferino Vaz, 13083-887, Campinas, SP, Brasil. Correspondência para/ Correspondence to: MC MORETTO. E-mail: <[email protected]>.
2
Universidade Estadual de Campinas, Faculdade de Educação, Departamento de Psicologia Educacional. Campinas, SP, Brasil. 3
Universidade Estadual de Campinas, Faculdade de Ciências Médicas, Departamento de Clínica Médica. Campinas, SP, Brasil. Support: Conselho Nacional de Desenvolvimento Científico e Tecnológico (Grant nº 555082/2006-7).
Associations among self-reported diabetes,
nutritional status, and socio-demographic
variables in community-dwelling
older adults
Associações entre diabetes autorreferido, estado
nutricional e variáveis sociodemográficas
em idosos comunitários
Maria Clara MORETTO1
Maria Inês TADONI1
Anita Liberalesso NERI1,2
Maria Elena GUARIENTO1,3
A B S T R A C T
Objective
The aim of this study was to describe relationships between self-reported diabetes mellitus and its treatment, according to demographic and socioeconomic data, as well as indicators of nutritional status in community-dwelling older adults.
Methods
Results
The variables most associated with diabetes were obesity (OR=2.19), abdominal adiposity (OR=2.97), and unintentional weight loss (OR=3.38). The lack of diabetes treatment was associated with advanced age (p=0.027), lower educational level (p=0.005), and low metabolic risk (p=0.004).
Conclusion
Self-reported diabeteswas associated with obesity but mostly with abdominal adiposity and unintentional weight loss. Not being treated for diabetes mellitus was associated with advanced age, lower levels of education, and lower abdominal adiposity.
Indexing terms: Aged. Diabetes mellitus. Nutritional status.
R E S U M O
Objetivo
O objetivo deste estudo foi descrever associações entre o diabete melito autorrelatado e seu tratamento, conforme variáveis demográficas, socioeconômicas e indicadores do estado nutricional, em idosos residentes no município de Campinas.
Métodos
Trata-se de estudo de base populacional, transversal, que faz parte do projeto multicêntrico “Fragilidade em Idosos Brasileiros”, conduzido com amostra aleatória composta por 881 idosos (de 65 anos ou mais) do município de Campinas. Os itens autorreferidos utilizados foram: faixa etária, sexo, renda familiar (em salários-mínimos), escolaridade (anos de escolaridade), além de dados dicotômicos (sim versus não) referentes a perda e ganho ponderais, diabetes mellitus e tratamento da doença. O índice de massa corporal foi classificado como: baixo peso <23; eutrofia ≥23 e <28; sobrepeso ≥28 e <30; obesidade ≥30. A relação cintura-quadril, indicadora de adiposidade abdominal, foi classificada conforme o risco metabólico de homens e mulheres, respectivamente: baixo, entre 0.90-0.95 e 0.80-0.85; moderado, entre 0.96-1.00 e 0.86-0.90; alto, >1.00 e >0.90.
Resultados
Os fatores mais associados ao diabete foram obesidade (OR=2,19), adiposidade abdominal (OR=2,97) e perda ponderal não-intencional (OR=3,38). O não tratamento da doença associou-se a: idade mais avançada (p=0,027), menor nível de escolaridade (p=0,005) e baixo risco metabólico (p=0,004).
Conclusão
O diabete autorrelatado associou-se com a obesidade, mas principalmente com a adiposidade abdominal e a perda de peso não intencional. O não tratamento do diabete pelo idoso foi associado com idade avançada, baixo nível educacional e reduzida adiposidade abdominal.
Termos de indexação: Idoso. Diabetes mellitus. Estado nutricional.
I N T R O D U C T I O N
The demographic transition has been accompanied by changes in nutritional and epidemiological population profiles, characterized respectively, by modification of dietary patterns leading to increased prevalences of overweight and obesity and high rates of morbidity and mortality arising from Chronic Non-communicable Diseases (NCD) and its complications, expressed by disabilities and dependency1.
Among the major NCD, Diabetes Mellitus
(DM) is defined by the World Health Organization
(WHO) as a metabolic disorder characterized by chronic hyperglycemia resulting from changes in the insulin secretion and/or action2, with consequent chronic complications that overwhelm the health care system and burden the patients’ and caregivers’ quality of life3.
period, there were 5.1 million diabetes-related deaths and 316 million people with impaired glucose tolerance, a condition which represents an important risk factor for the development of DM4.
According to a Brazilian Ministry of Health’s epidemiological study on risk and protective factors for chronic diseases, the prevalence of self-reported diabetes in this population corresponded in 2011 to 3.4%, 8.9%, 15.2% and 21.6%, in the age groups of 35-44, 45-54, 55-64, and 65 years and over, respectively, indicating higher frequencies in higher ages (55 years and older)5.
Components such as an ageing population, family history, excessive adiposity, inactivity, and unhealthy diet are associated with high rates of diabetes6. In older adults these risk factors combined with physiological changes of aging, such as chronic inflammation, reduced muscle mass, and high percentage of adipose mass, particularly in the abdominal region, potentiate insulin resistance and enhance the risk for disease6-8.
Obesity, defined as an excess of total body fat, represents one of the major contributors to the development of chronic health conditions, including diabetes6. Body Mass Index (BMI) and Waist-to-Hip Ratio (WHR) are important anthropometric measures widely used in epidemiological studies as indirect indicators of overall and abdominal obesity, respectively. Although showing good correlation with morbidity and mortality, particularly with DM9,10, these measures should be performed and analyzed carefully in the elderly, due to the physiological changes of body composition of this specific population11.
Hence, the purpose of this study was to describe associations between self-reported diabetes and its treatment, according to demographic, socioeconomic, and nutritional status-related variables in community-dwelling older adults.
M E T H O D S
This was a cross-sectional study, conducted with community-dwelling older adults aged 65 years and older, residents of Campinas, a city located in the State of São Paulo, Brazil, with around 1,144,862 inhabitants12. The sample was based on data from the electronic database of
Fragilidade em Idosos Brasileiros (FIBRA, Frailty in Brazilian Elderly), a multicentric and population-based survey conducted in 2008-2009. This investigation was approved by the Ethics Committee of the Faculty of Medical Sciences of
Universidade Estadual de Campinas (nº 208/2007).
We performed simple random sampling of census tracts in urban areas of Campinas, according to a pre-defined plan, and selected 900 elderly. Survey participants were recruited in their households by a trained and uniformed team comprising gerontology students, community health professionals, and religious pastoral agents, according to the following inclusion criteria: aged 65 years and older; understands instructions; agrees to participate; and is a permanent resident in the household and census tract. The exclusion criteria, the same as suggested by Ferrucci et al.13, used in the Cardiovascular Health Study (CHS), were: having a cognitive deficit suggestive of dementia; being wheelchair-bound or bedridden; suffering from severe stroke sequelae, with localized loss of strength and/or aphasia; having Parkinson’s disease in an advanced or unstable stage; having auditory or visual deficits that make communication difficult; being terminally ill. More information about the methodology and the sampling and recruitment processes of FIBRA can be found in the study carried out by Neri et al.14.
age (years), family income (in minimum salaries) and educational level were sorted, respectively, into four (65-69, 70-74, 75-79, ≥80), five (0.0 to 1.0, 1.1-3.0, 3.1-5.0, 5.1-10.0, >10.0), and three (never been to school, 1-4 years, ≥5 years) categories.
Diabetes data was obtained from the self-reported question: “Do you have diabetes?” (yes
versus no). The older adults who answered yes to
this item were then asked whether they were being treated for the disease (yes versus no).
Anthropometric measurements (weight, height, and waist and hip circumferences) were collected by trained examiners according to classic protocols of the WHO15. The weight and height of the participants were obtained, respectively, by a digital balance (G-Tech) and a scale (200 cm) graduated in centimeters and millimeters. BMI was calculated using the equation: BMI (kg/m2) = weight (kg) ÷ height2 (m), and classified according to the Pan American Health Organization criteria (underweight <23; normal weight ≥23 and <28; overweight ≥28 and <30; obesity ≥30)16. The waist circumference (WC) and Hip Circumference (HC) were measured with a non-elastic tape measure (150 cm), to obtain the WHR, an indicator of abdominal adiposity, which was classified as metabolic risk according to Lohman
et al.17 (risk for male and female, respectively: 0.90 to 0.95 and 0.80 to 0.85: low; 0.96 to 1.00 and 0.86 to 0.90: moderate; >1.00 and >0.90: high).
Data regarding weight loss and weight gain were collected from the dichotomous self-reported items: “Did you lose weight unintentionally in the past 12 months?” (yes
versus no) and “involuntary weight gain” (yes
versus no).
After the exclusion of 19 participants due to lack of information in self-reported diabetes, the final sample was composed of 881 older adults. Of these, due to missing data, 766 (86.9%), 879 (99.7%), 874 (99.2%), 675 (76.6%), 879 (99.7%) and 878 (99.6%) participants exhibited data concerning family income, education level, weight loss, weight gain, BMI and WHR, respectively.
Descriptive statistics were used to characterize the sample. Categorical (gender, age, family income, education, self-reported DM, treatment for DM, BMI, weight loss, weight gain, and WHR) and continuous (age, family income, years of education, BMI and WHR) data were presented, respectively, by absolute frequencies and percentages; and by mean and standard deviation values. Chi-square analyses and Fisher exact tests were used to compare the categories of self-reported DM and its treatment, with demographic, socioeconomic and nutritional status-related indicators. Binary logistic regression analyses were performed to determine associations between self-reported DM (dependent variable) and the other variables (independent). The multivariate logistic regression analysis was conducted using the stepwise backward method. The significance level of 5% (p<0.05) was adopted in the tests. The Statistical Package for the Social Sciences (SPSS) 17.0 version was used in the analyses.
R E S U L T S
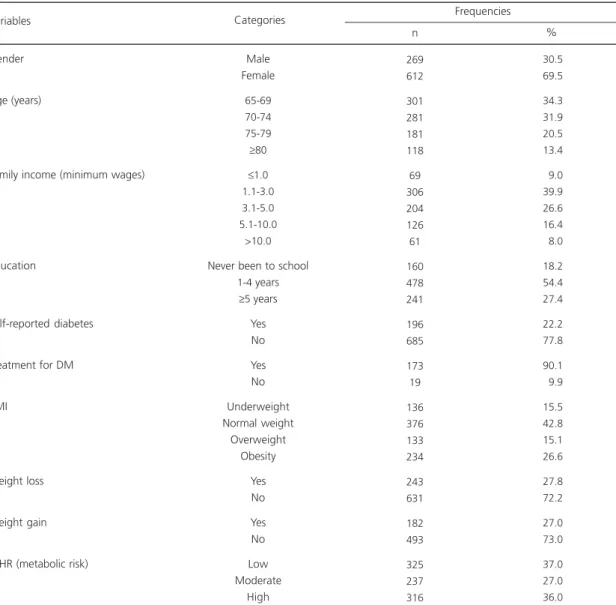
Of the 881 respondents, 69.5% were females and 66.2% were between 65 and 74 years old. Almost 20.0% of the older adults had never been to school and more than half of the sample had 1 to 4 years of formal education. Mean values of age and education were 72.79 ± 5.81 and 4.69 ± 5.28 years, respectively. Half of the participants had a family income of up to 3 minimum salaries.
The prevalence of self-reported DM was 22.2% (Table 1). Respondents who treated less for DM were older, with no formal education and showed a low metabolic risk according to their WHR (Table 2).
Table 1. Characteristics of the participants according to demographic, socioeconomic and nutritional status-related variables. Frailty in Brazilian Elderly.Campinas (SP), 2008-2009.
Gender
Age (years)
Family income (minimum wages)
Education
Self-reported diabetes
Treatment for DM
BMI
Weight loss
Weight gain
WHR (metabolic risk)
269 612
301 281 181 118
69 306 204 126 61
160 478 241
196 685
173 19
136 376 133 234
243 631
182 493
325 237 316
30.5 69.5
34.3 31.9 20.5 13.4
09.0 39.9 26.6 16.4
08.0
18.2 54.4 27.4
22.2 77.8
90.1
09.9
15.5 42.8 15.1 26.6
27.8 72.2
27.0 73.0
37.0 27.0 36.0 Variables
Male Female
65-69 70-74 75-79
≥80
≤1.0
1.1-3.0 3.1-5.0 5.1-10.0
>10.0
Never been to school 1-4 years
≥5 years
Yes No Yes No Underweight Normal weight
Overweight Obesity
Yes No Yes No Low Moderate
High Categories
n %
Frequencies
Note: BMI: Body Mass Index; WHR: Waist-Hip Ratio; DM: Diabetes Mellitus.
anthropometric variables demonstrated frequencies of underweight, overweight, and obesity in 12 (6.1%), 35 (17.9%) and 81 (41.3%) diabetic older adults versus 124 (18.2%), 98 (14.3%) and 153 (22.4%) without this disease (p<0.001). We found low, moderate and high WHR values in 49 (25.0%), 48 (24.5%) and 99 (50.5%) of those who reported DM versus 276 (40.5%), 189 (27.7%) and 217 (31.8%) non-diabetics (p<0.001). There was also an association between weight loss and self-reported DM (38.7% among diabetics versus 24.7% among non-diabetics,
p<0.001) (Table 2).
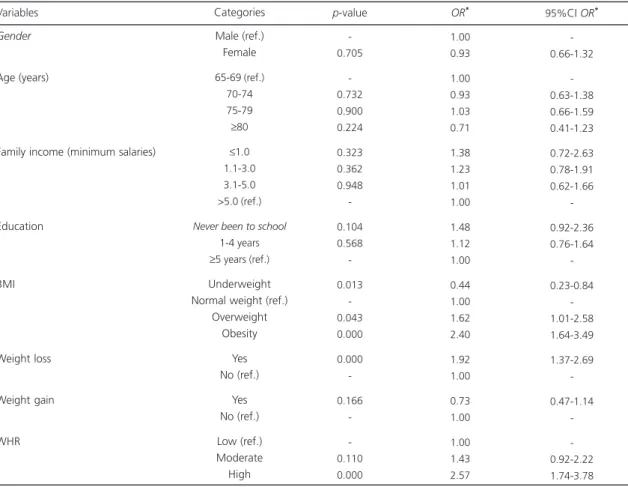
Results from the logistic regression analyses (Tables 3 and 4), showed that the factors most associated with self-reported DM were obesity, abdominal adiposity (indicated by high values of WHR) and unintentional weight loss.
D I S C U S S I O N
care system. In this study we investigated associations of self-reported diabetes in community-dwelling older adults according to demographic, socioeconomic, and nutritional status-related data.
With reference to the socioeconomic profile of our sample, the educational level of the older adults was similar to the Saúde Bem-Estar
e Envelhecimento (SABE, Health, Well-being and
Aging Survey), a population based-study conducted with 2,143 older adults (mean age of 68 years) from the city of São Paulo, in which 21.0% of respondents had never attended school, and 46.4% had less than four years of formal education18. Nevertheless, the participants’ average income was lower (2.1 minimum salaries) Table 2. Distribution of the participants regarding self-reported diabetes and its treatment according to demographic, socioeconomic,
and nutritional status-related variables. Frailty in Brazilian Elderly. Campinas (SP), 2008-2009.
Gender Male Female Age (years) 65-69 70-74 75-79 ≥80
Family income (minimum salaries)
≤1.0 1.1-3.0 3.1-5.0 >5.0
Education
Never been to school 1-4 years
≥5 years
BMI Underweight Normal weight Overweight Obesity Weight loss Yes No Weight gain Yes No WHR Low Moderate High
Variables and Categories
62 134 70 62 43 21 18 73 42 38 43 104 48 12 68 35 81 75 119 31 108 49 48 99 31.6 68.4 35.7 31.6 21.9 10.8 10.5 42.7 24.6 22.2 22.1 53.3 24.6 06.1 34.7 17.9 41.3 38.7 61.3 22.3 77.7 25.0 24.5 50.5 n % Yes 207 478 231 219 138 97 51 233 162 149 117 374 193 124 308 98 153 168 512 151 385 276 189 217 30.2 69.8 33.7 31.9 20.2 14.2 08.6 39.2 27.2 25.0 17.1 54.7 28.2 18.2 45.1 14.3 22.4 24.7 75.3 28.2 71.8 40.5 27.7 31.8 n % No
<0.705*
<0.621*
<0.623*
<0.246*
<0.001*
<0.001*
<0.165*
<0.001* p-value Self-reported diabetes 52 121 64 57 37 15 14 64 37 36 31 96 45 10 60 32 71 67 105 25 98 37 44 92 30.1 69.9 37.0 32.9 21.4 8.7 09.3 42.4 24.5 23.8 18.0 55.8 26.2 05.8 34.7 18.5 41.0 38.9 61.1 20.3 79.7 21.4 25.4 53.2 n % Yes 8 11 5 3 5 6 4 6 5 1 10 7 2 2 7 2 8 7 11 3 10 11 3 5 42.1 57.9 26.3 15.8 26.3 31.6 25.0 37.5 31.2 6.3 52.6 36.9 10.5 10.5 36.8 10.5 42.2 38.9 61.1 23.1 76.9 57.9 15.8 26.3 n % No
<0.282**
<0.027**
<0.121**
<0.005**
<0.682**
<1.000**
<0.730**
<0.004**
p-value Treatment for DM
Note: *p-value for Qui-square Test; **p-value for Fischer Exact Test.
Table 3. Univariate logistic regression results for self-reported diabetes mellitus (N=586). Frailty in Brazilian Elderly. Campinas (SP), 2008-2009.
Gender
Age (years)
Family income (minimum salaries)
Education
BMI
Weight loss
Weight gain
WHR
Male (ref.) Female 65-69 (ref.)
70-74 75-79
≥80
≤1.0
1.1-3.0 3.1-5.0 >5.0 (ref.)
Never been to school
1-4 years
≥5 years (ref.)
Underweight Normal weight (ref.)
Overweight Obesity
Yes No (ref.)
Yes No (ref.) Low (ref.) Moderate High
-0.705
-0.732 0.900 0.224
0.323 0.362 0.948
-0.104 0.568
-0.013 -0.043 0.000
0.000
-0.166
-0.110 0.000
1.00 0.93
1.00 0.93 1.03 0.71
1.38 1.23 1.01 1.00
1.48 1.12 1.00
0.44 1.00 1.62 2.40
1.92 1.00
0.73 1.00
1.00 1.43 2.57
Variables Categories p-value OR* 95%CI OR*
-0.66-1.32
-0.63-1.38 0.66-1.59 0.41-1.23
0.72-2.63 0.78-1.91 0.62-1.66
-0.92-2.36 0.76-1.64
-0.23-0.84 -1.01-2.58 1.64-3.49
1.37-2.69
-0.47-1.14
-0.92-2.22 1.74-3.78
Note: *OR: Odds Ratio for self-reported diabetes; 95%CI OR: 95% Confidence Interval for Odds Ratio.
BMI: Body Mass Index; WHR: Waist-Hip Ratio; Ref.: Reference level.
Table 4. Multivariate logistic regression results for self-reported diabetes mellitus (N=586). Frailty in Brazilian Elderly. Campinas (SP), 2008-2009.
BMI
WHR (metabolic risk)
Weight loss
Underweight Normal weight (ref.)
Overweight Obesity Low (ref.) Moderate High No (ref.)
Yes
0.399 -0.070 0.003
-0.099 0.000
-0.000
0.71 1.00 1.75 2.19
1.00 1.67 2.97
1.00 3.38
Variables Categories p-value OR* 95%CI OR*
0.32-1.56 -0.95-3.21 1.29-3,70
-0.90-3.08 1.68-5.25
-2.12-5.38
Note: *OR: Odds Ratio for self-reported diabetes; 95%CI OR: 95% Confidence Interval for Odds Ratio.
than the mean value found in the present study (4.5 ± 5.0 minimum salaries)19.
The prevalence of DM found in this study (22.2%) differs from data regarding Brazilian community-dwelling older adults from SABE (17.5%)18 and the Inquérito de Saúde no Estado de São Paulo (ISA-SP, Health Survey in São Paulo) (15.4%)20. However, Wennberg et al.21 reported a similar frequency of this self-rated disease (24%) in a representative sample of American seniors (≥65 years).
The high proportion of diabetics in this study may be partially explained by the presence of community health professionals in the recruitment process. Participants often attend the primary health care units because of some chronic disease-related problem and so probably knew some of these recruiters. Therefore, they could have been more willing to accept the invitation to participate in the research. Nevertheless, this DM prevalence may be underestimated, considering the use of a self-report measure and the exclusion criteria, which ruled out the most disabled older adults.
Diabetes was not statistically associated with gender and age, data corroborated by the ISA-SP Study20. However, in an investigation conducted with 399 older community-dwellers, Aurichio et al.22 observed higher self-rated DM frequencies in men (22.1% versus 15.1% in women). SABE showed a slight predominance of DM in women (18.7% versus 16.8% in men) and lower frequencies in seniors older than 75 years in both genders, which could be explained by premature mortality due to the disease’s chronic complications18.
Similarly with the ISA-SP20, there was no statistically significant difference between self-reported DM and socioeconomic variables (income and education level). Nevertheless, we observed statistical associations between non-treatment for DM with higher ages (80 years and older), illiteracy, i.e., seniors who have never attended school, and lower WHR. Furthermore, a greater proportion of subjects with higher
income (>5.0 minimum salaries) was found among the treatment group, compared with those receiving the minimum salary or less.
Barros et al.23, in a sample of 391,868 adults from the Brazilian National Household Sample Survey (PNAD) - 2008, observed an association between disadvantaged social groups (evaluated by years of education and access to private health services) and higher prevalences of chronic diseases, particularly diabetes. In a systematic review, Agardh et al.24 also reported that an adverse economic situation, measured by income, education level, and occupation, was associated with increased risk for type 2 DM occurrence, both in developed and developing countries.
In this study a disadvantageous socioeconomic status, particularly when associated with low education level, and also advanced age, may have prevented the older adults from getting DM treatment. According to the literature, the non-adherence of old people to drug therapy for chronic diseases may be related to factors like low levels of education and information, difficulties in obtaining medications due to their high costs, scarcity of these drugs in primary health care units, insufficient income, multiple comorbidities and polypharmacy, cognitive impairment, and functional disability25,26.
Regarding the nutritional profile of the sample, we found elevated prevalences of obesity (26.7%) indicated by BMI, and abdominal adiposity (36.0%) represented by high WHR, as well as weight loss and weight gain.
our results could be explained by methodological criteria used to define cutoff values for BMI and WHR categories.
High prevalences of weight gain and obesity in the general population, particularly among older adults, are associated with the nutrition transition, which is influenced by industrialization and urbanization, and consequently by globalization of unhealthy dietary habits and a sedentary lifestyle1.
Changes in body composition, physiological features of the aging process, should also be considered. These include loss of muscle mass and redistribution of body fat with increasing intra-abdominal, visceral, and intramuscular adiposity, and decreasing subcutaneous fat. This set of changes results in a decline in the basal metabolic rate, which concomitantly with high or stable caloric consumption, could possibly contribute to involuntary weight gain and high frequencies of overweight7.
Obesity in turn is a major risk factor for the development of chronic diseases, including diabetes. The present study found a strong association between overweight (p=0.043), obesity (p=0.003) and abdominal adiposity (p=0.000) with the presence of diabetes. These findings corroborate data found in the literature.
In the Inquérito de Saúde no Estado de
São Paulo20, self-reported DM was statistically
associated with high values of BMI (p<0.01). Although Benedetti et al.30, in a study involving 867 elderly from southern Brazil found no association between self-reported diabetes and high BMI (>25 kg/m2), they reported statistical association between DM and high WHR values (>0.90 and >0.85 for men and women, respectively) (OR=4.32, CI=1.85 - 10.09).
Cheng et al.10, in a sample of 5,107 Chinese (Taiwanese), also reported a significant relationship between self-reported DM and high BMI and WHR (compared with non-diabetics), the latter being an important anthropometric risk predictor for the development of type 2 diabetes
mellitus. Other foreign studies also observed associations between high WHR9 and BMI9,31 and high risk for DM incidence.
Abdominal adiposity correlates with type 2 DM, whereas it is associated with secretion of substances such as adipokines, free fatty acids, and pro-inflammatory cytokines, such as Tumor Necrosis Factor alpha (TNF-α) and Interleukin 6 (IL-6), which contribute to reduce insulin sensitivity and cause pancreatic beta-cell dysfunctions8. This set of risk factors characterizes the metabolic syndrome and also potentiates the development and aggravation of diabetes. Likewise, according to recent studies, features such as central obesity, insulin resistance, and chronic inflammation correlate with worse sarcopenia and development of frailty syndrome in older adults, which leads to greater risks for disabilities, hospitalization, and death32,33.
The robust association of unintentional weight loss with DM in respondents (OR=3.38, CI=2.12-5.38) may be related to the symptomatology of the disease, which involves weight loss, among other factors2. Although no association was observed between non-treatment for DM and weight loss, the degree of adherence and treatment effectiveness in those undergoing treatment is unknown. Thus, a possibly inappropriate treatment for DM could have contributed to weight loss in the sample.
In older individuals with chronic diseases, particularly in those with more than one disease, situations such as polypharmacy, dysphagia, xerostomia, lower gustatory and olfactory sensitivity, cognitive impairment, and depressive symptoms may promote inappetence and low food intake. Other aspects such as mobility disorders, disability, and social isolation may preclude access to adequate food34.
disability, worsening of health status, and mortality in older men and women. This fluctuations in weight, particularly among old adults with chronic comorbidities, as diabetes, who are more prone to having chronic inflammation and abdominal adiposity, could possibly lead to a progressive loss of lean mass, strength, and functionality36. Therefore, monitoring weight changes in these ageing individuals should be a priority of geriatric care35.
One limiting factor of this study refers to its cross-sectional design, which does not allow establishing a cause-effect relationship, but only drawing a profile of associations, between diabetes mellitus and the other variables. Another limitation of this investigation regards to the use of a self-reported data to indicate the presence of DM, whereas, as mentioned above, this type of measure could have underestimated the real situation of the participants. Nevertheless, despite being a limited method, studies have shown that using self-rated morbidity in population surveys represents a valid, inexpensive and practical method, and may produce adequate prevalence estimates of diseases such as diabetes and hypertension37,38.
C O N C L U S I O N
This study showed a high prevalence of self-reported diabetes. The disease was associated with obesity (measured by high BMI) but mostly with abdominal adiposity (WHR) and unintentional weight loss, factors that cause a greater impact on functionality, increase risks of morbidity and mortality, and increase the health care system costs considerably.
The non-treatment for DM was associated with advanced age, lower levels of education and low abdominal adiposity (WHR), which reinforce the importance of implementing specific educational interventions focused on the oldest and less educated seniors for an effective diabetes management.
A K N O W L E D G E M E N T S
The authors wish to thank Conselho Nacional de Desenvolvimento Científico e Tecnológico for sponsoring the study.
C O N T R I B U T O R S
MC MORETTO, MI TADONI, AL NERI, and ME GUARIENTO contributed to project conception and design, and data analysis and interpretation. MC MORETTO and ME GUARIENTO participated in drafting the article and revising it critically for important intellectual content. AL NERI and ME GUARIENTO approved the final version to be published.
R E F E R E N C E S
1. Schmidt MI, Duncan BB, Silva GA, Menezes AM, Monteiro CA, Barreto SA, et al. Chronic non-communicable diseases in Brazil: Burden and current challenges. Lancet. 2011: 377(9781):1949-61. doi: 10.1016/S0140-6736(11)60437-6
2. World Health Organization. Definition and diagnosis of diabetes Mellitus and intermediate hyperglycemia: Report of a WHO/IDF consultation. Geneva: WHO; 2006.
3. Conwell LJ, Boult C. The effects of complications and comorbidities on the quality of preventive diabetes care: A literature review. Popul Health Manag. 2008; 11(4):217-28. doi: 10.1089/pop.20 07.0017
4. International Diabetes Federation. IDF Diabetes Atlas. 6th ed. Brussels: International Diabetes
Federation; 2013 [cited 2014 Jun 10]. Available from: <http://www.idf.org/diabetesatlas>. 5. Brasil. Ministério da Saúde. Secretaria de Vigilância
em Saúde. Vigitel Brasil 2011: vigilância de fatores de risco e proteção para doenças crônicas por in-quérito telefônico. Brasília: Ministério da Saúde; 2012.
6. Hu FB. Globalization of diabetes: The role of diet, lifestyle and genes. Diabetes Care. 2011; 34(6):1249-57. doi: 10.2337/dc11-0442
7. Kuk JL, Saunders TJ, Davidson LE, Ross R. Age-related changes in total and regional fat distribution. Ageing Res Rev. 2009; 8(4):339-48. doi: 10.1016/j.arr.2009.06.001
9. Vazquez G, Duval S, Jacobs DR Jr., Silventoinen K. Comparison of body mass index, waist circumference and waist/hip ratio in predicting incident diabetes: A meta-analysis. Epidemiol Rev. 2007; 29:115-28. doi: 10.1093/epirev/mxm008 10. Cheng CH, Ho CC, Yang CF, Huang YC, Lai CH,
Liaw YP. Waist-to-hip ratio is a better anthropometric index than body mass index for predicting the risk of type 2 diabetes in Taiwanese population. Nutr Res. 2010; 30(9):585-93. doi: 10.1016/j.nutres. 2010.08.007
11. Cervi A, Franceschini CC, Priore E, Federal U, Regional U, Grande R, et al. Critical analysis of the use of the body mass index for the elderly. Rev Nutr. 2005; 18(6):765-75. doi: 10.1590/S1415-5273 2005000600007
12. Instituto Brasileiro de Geografia e Estatística. Características étnico-raciais da população: um estudo das categorias de classificação de cor ou raça. Rio de Janeiro: IBGE; 2013 [cited 2013 Oct 11]. Available from: <http://www.ibge.gov.br/ home/estatistica/populacao/caracteristicas_raciais/ PCERP2008.pdf>.
13. Ferrucci L, Guralnik JM, Studenski S, Fried LP, Cutler GB Jr, Walston JD. Designing randomized, controlled trials aimed at preventing or delaying functional decline and disability in frail, older persons: A consensus report. J Am Geriatr Soc. 2004; 52(4):625-34. doi: 10.1111/j.1532-5415.20 04.52174.x
14. Neri AL, Yassuda MS, Araújo LF, Eulálio MC, Cabral BE, Siqueira MEC, et al. Methodology and social, demographic, cognitive, and frailty profiles of community-dwelling elderly from seven Brazilian cities: The FIBRA study. Cad Saúde Pública. 2013; 29(4):778-92. doi: 10.1590/S0102-311X201300 0800015
15. World Health Organization. Physical status: The use and interpretation of anthropometry. Report of a WHO Expert Committee. Geneva: World Health Organization; 1995 [cited 2012 Jun 5]. Available from: <http://whqlibdoc.who.int/trs/WHO_TRS_ 854.pdf?ua=1>.
16. Pan-American Health Organization. 36a Reunión del
Comitê Asesor de Investigaciones en Salud -Encuesta Multicêntrica - Salud Bienestar y Envejecimiento (SABE) en América Latina y el Caribe: Informe preliminar; 2001 Jul 9-11, Kingston, Jamaica. Washington (DC): Pan-American Health Organization [acceso 2012 Jan 15]. Disponible en: <http://www.opas.org/program/sabe.htm>.
17. Lohman TG, Roche AF, Martorell R. Anthropometric standardization reference manual. Illinois: Human Kinetics Books; 1988.
18. Lebrão ML, Laurenti R. Health, well-being and aging: the SABE Study in São Paulo, Brazil. Rev Bras Epidemiol. 2005; 8(2):127-41. doi: 10.1590/S1415-7 90X2005000200005
19. Campino ACC, Cyrillo DC. Situação de ocupação e renda. In: Lebrão ML, Duarte YAO. O Projeto SABE no Município de São Paulo: uma abordagem inicial. Brasília: OPAS; 2003. p.241-55.
20. Francisco PMSB, Belon AP, Barros MBA, Carandina L, Alves MCGP, Goldbaum M, et al. Self-reported diabetes in the elderly: Prevalence, associated factors and control practices. Cad Saúde Pública. 2010; 26(1):175-84. doi: 10.1590/S0102-311X 2010000100018
21. Wennberg AMV, Gottesman RF, Kaufmann CN, Albert MS, Chen-Edinboro LP, Rebok GW, et al. Diabetes and cognitive outcomes in a nationally representative sample: The National Health and Aging Trends Study. Int Psychogeriatr. 2014; 30:1-7. 22. Aurichio TR, Rebelatto JR, Castro AP. Obesity among older people of the City of São Carlos, SP, Brazil, and its association with diabetes Mellitus and joint pain. Fisioter Pesq. 2010; 17(2):114-7. doi: 10.15 90/S1809-29502010000200004
23. Barros MBA, Francisco PMSB, Zanchetta LM, César CLG. Trends in social and demographic inequalities in the prevalence of chronic diseases in Brazil. PNAD: 2003-2008. Cienc Saúde Colet. 2011; 16(9):3755-68. doi: 10.1590/S1413-812320110 01000012
24. Agardh E, Allebeck P, Hallqvist J, Moradi T, Sidorchuk A. Type 2 diabetes incidence and socio-economic position: A systematic review and meta-analysis. Int J Epidemiol. 2011; 40(3):804-18. doi: 10.1093/ije/dyr029
25. Marin MJS, Cecílio LCO, Perez AEWUF, Santella F, Silva CBA, Gonçalves Filho JR, et al. Use of medicines by the elderly in a Family Health Program unit in Brazil. Cad Saúde Pública. 2008; 24(7):1545-55. doi: 10.1590/S0102-311X2008 000700009
26. Munshi MN, Maguchi M, Segal AR. Treatment of type 2 diabetes in the elderly. Curr Diab Rep. 2012; 12(3):139-45. doi: 10.1007/s11892-012-0269-4 27. Nascimento CM, Ribeiro AQ, Cotta RMM, Acurcio
FA, Peixoto SV, Priore SE, et al. Nutritional status and associated factors among the elderly in Viçosa, Minas Gerais State, Brazil. Cad Saúde Pública. 2011; 27(12):2409-18. doi: 10.1590/S0102-311X2 011001200012
29. Munaretti DB, Barbosa AR, Marucci MFN, Lebrão ML. Self-rated hypertension and anthropometric indicators of body fat in elderly. Rev Assoc Med Bras. 2011; 57(1):25-30. doi: 10.1590/S0104-42302011000100011
30. Benedetti TRB, Meurer ST, Morini S. Anthropometric indices related to cardiovascular and metabolic diseases in older adults. Rev Educ Fis UEM. 2012; 23(1):123-30. doi: 10.4025/reveducfis.v23i1.11 393
31. Rodbard HW, Bays HE, Gavin JR, Green AJ, Bazata DD, Lewis SJ, et al. Rate and risk predictors for development of self-reported type-2 diabetes mellitus over a 5-year period: The SHIELD Study. Int J Clin Pract. 2012; 66(7):684-91. doi: 10.1111/j. 1742-1241.2012.02952.x
32. Barzilay JI, Blaum C, Moore T, Xue QL, Hirsch CH, Walston JD, et al. Insulin resistance and inflammation as precursors of frailty: The cardiovascular health study. Arch Intern Med. 2007; 167(7):635-41. doi: 10.1001/archinte.167.7.635 33. Goulet ED, Hassaine A, Dionne IJ, Gaudreau P, Khalil
A, Fulop T, et al. Frailty in the elderly is associated with insulin resistance of glucose metabolism in the postabsorptive state only in the presence of increased abdominal fat. Exp Gerontol. 2009; 44(11):740-4. doi: 10.1016/j.exger.2009.08.008 34. Ahmed T, Haboubi N. Assessment and management
of nutrition in older people and its importance to
health. Clin Interv Aging. 2010; 5:207-16. doi: 10.2147/CIA.S9664
35. Murphy RA, Patel KV, Kritchevsky SB, Houston DK, Newman AB, Koster A, et al. Weight change, body composition, and risk of mobility disability and mortality in older adults: A population-based cohort study. J Am Geriatr Soc. 2014; 62(8):1476-83. doi: 10.1111/jgs.12954
36. Corona LP, Nunes DP, Alexandre TS, Santos JLF, Duarte YAO, Lebrão ML. Weight gain among elderly woman as risk fator for disability: Health, Well-Being and Aging Study (SABE Study). J Aging Health. 2013; 25(1):119-35. doi: 10.1177/0898264312 466261
37. Cricelli C, Mazzaglia G, Samani F, Marchi M, Sabatini A, Nardi R, et al. Prevalence estimates for chronic diseases in Italy: Exploring the differences between self-report and primary care databases. J Public Health Med. 2003; 25(3):254-7. doi: 10.1093/pubmed/fdg060
38. Schneider ALC, Pankow JS, Heiss G, Selvin E. Validity and reliability of self-reported diabetes in the atherosclerosis risk in communities study. Am J Epidemiol. 2012; 176(8):738-43. doi: 10.1093/aje/ kws156