Rev Saúde Pública 2006;40(1) www.fsp.usp.br/rsp
INTRODUCTION
Premenstrual syndrome (PMS) is a set of physical, emotional and behavioral symptoms that start dur-ing the week preceddur-ing menstruation and are alle-viated when the menstrual flow begins.13 The
symp-toms present a cyclic and recurrent character and may be variable in quantity and intensity. Slight
Population study of premenstrual syndrome
Celene Maria Longo da Silva*, Denise Petrucci Gigante, Maria Laura Vidal Carret and Anaclaudia Gastal Fassa
Programa de Pós-graduação em Epidemiologia. Faculdade de Medicina. Universidade Federal de Pelotas. Pelotas, RS, Brasil
Correspondence:
Celene Maria Longo da Silva Av. Duque de Caxias, 250 3º piso 96030-020 Pelotas, RS, Brasil E-mail: [email protected]
*Fellowship by Coordenação de Aperfeiçoamento de Pessoal de Nível Superior (CAPES).
Based on Master’s dissertation presented within the Postgraduate Program in Epidemiology, Faculdade de Medicina of the Universidade Federal de Pelotas, in 2004.
Received on 13/12/2004. Reviewed on 10/6/2005. Approved on 18/7/2005.
Keywords
Premenstrual syndrome, diagnosis. Premenstrual syndrome, epidemiology. Symptoms, classification. Cross-sectional studies. Health surveys.
Abstract
Objective
To study the prevalence of premenstrual syndrome and the factors associated with this, by comparing the obtained frequency with the self-reported frequency.
Methods
This was a cross-sectional population-based study, involving 1,395 women aged 15 to 49 years old in a medium-sized municipality in Southern Brazil, carried out in 2003. Questionnaires were applied to measure the prevalence of premenstrual syndrome by means of a score based on five premenstrual symptoms that interfered with family life or led to absence from work or school. Associations with socioeconomic, demographic and behavioral variables were investigated. Self-reported syndrome was investigated with regard to its sensitivity and specificity, taking the score as the gold standard. The statistical analyses performed were Pearson χ2, Mantel-Haenszel and Poisson regression, with Kappa coefficients to verify the concordance of the responses.
Results
The obtained prevalence was 25.2% (95% CI: 22.5-27.9) and the self-reported prevalence was 60.3% (95% CI: 57.4-63.3). The principal premenstrual symptoms found were: irritability, abdominal discomfort, nervousness, headache, fatigue and breast pain; all of these showed prevalence of over 50%. Higher risk was presented by women of higher socioeconomic level, better schooling level, aged under 30 years and with white skin color. Psychotropic drug users and women who were not using any hormonal contraceptive presented higher prevalence of the syndrome. The sensitivity of the test was 94%, specificity 51% and accuracy 62%.
Conclusions
A high prevalence of premenstrual syndrome was found. Even though the women’s perception of the syndrome was higher than the result measured by the symptom score, one quarter of the women presented this health problem.
Rev Saúde Pública 2006;40(1) www.fsp.usp.br/rsp Population study of PMS
Silva CML et al
this, the study had the objective of comparing these findings with the prevalence of self-reported PMS.
METHODS
A population-based cross-sectional health survey was carried out in 2003, among women aged 15 to 49 years living in the urban zone of the city of Pelotas. Women who did not present regular menstrual cycles because of anovulation, and those who were using hormonal medication as a treatment for the meno-pause, were excluded from the study.
The municipality of Pelotas is located in the state of Rio Grande do Sul, in the south of Brazil, and has approximately 320,000 inhabitants. Women repre-sent 53% of the total population, and 53% of them are at a fertile age.
To calculate the sample size, the size of the popula-tion of women of fertile age (around 90,000) and a PMS prevalence of 50% were taken into account.22,*
To have a confidence interval of 95% with an accept-able error of 3.0 percentage points, it would be neces-sary to study 1,054 women. After adding 10% to al-low for losses and refusals, and considering that the sampling delineation effect would be close to one, and that there would be a mean of not less than 0.8 women aged 15 to 49 years per household, it was calculated that it would be necessary to visit approxi-mately 1,440 homes.
The sampling process included the selection of 144 census tracts out of the 404 that exist in the urban zone of Pelotas, and these were ranked in increasing order according to the mean income of the head of the household. The choice of the census tracts was systematic and proportional to the number of homes in the sector. In accordance with this number, the in-terval between the homes within each sector was de-fined, and the first home was drawn. After identifying the sectors drawn, it was observed that there had been demographic changes since the 2000 census. While the initial interval in each sector was maintained, with a mean of ten homes per sector, the number of homes sampled per sector ranged from nine to 27, to match the demographic changes over the period.
The outcome of PMS was characterized by differ-ent symptoms that needed to have been presdiffer-ent dur-ing the last three cycles, in the week preceddur-ing struation, with alleviation in the week following men-struation. The emotional symptoms asked about were: sadness, rage, irritability, nervousness, confusion,
*Nogueira CWM. Determinantes da síndrome pré-menstrual: análise de aspectos clínicos e epidemiológicos [tese de doutorado]. Campinas: Universidade Estadual de Campinas; 1998.
One of the theories for explaining the physiopatho-logical mechanism of premenstrual syndrome is that the endocrine, reproductive and serotoninergic sys-tems converge to regulate the individual’s behavior. The oscillations in estrogen and progesterone levels during the menstrual cycle act on serotoninergic func-tion such that PMS is manifested in women who are more sensitive to this.10
Most of the studies that have been published were carried out in gynecological and/or psychiatric out-patient clinics of reference centers, and there are few population-based studies.5,22 A variety of instruments
have been developed for evaluating PMS, and these have taken into consideration varying numbers of symptoms and intensity levels.19 Since PMS does not
have a characteristic clinical condition, the first ques-tionnaires on PMS were long and directed towards application in clinics.1,15
Population studies have shown different prevalences of PMS, ranging from 5 to 35%, according to the crite-ria utilized and the place where the study was con-ducted.5,14,22 Higher prevalences are found when the
diagnostic criteria are less rigid and include women who report four or more symptoms.22 In one
popula-tion-based study carried out in Virginia (USA),5 PMS
was observed in 8.3% of the women interviewed by telephone. However, there is concordance regarding the fact that approximately 5% of women present se-vere symptoms,7 and such symptoms are known as
pre-menstrual dysphoric disorder (PMDD).4
In Brazil, studies in clinics have shown PMS preva-lence of between 8% and 86%, depending on the severity of the symptoms considered.7,* In a study
carried out in a gynecology outpatient clinic,* the premenstrual symptoms reported among women with the severe form of PMS (43.3%) were: irritability (86%), tiredness (71%), depression (62%) and head-ache (62%); 95% presented more than one symptom and 76% presented an association between physical and psychiatric symptoms.
A review of the literature11,21 shows that there is no
!
Rev Saúde Pública 2006;40(1) www.fsp.usp.br/rsp
Population study of PMS Silva CML et al
social isolation and tiredness. The physical symp-toms asked about were: mastalgia, abdominal disten-sion, headache, swelling in the hands and legs, weight increases and paints in the joints or muscles. An ad-aptation of the criteria proposed in DSM-IV8 was
made, such that PMS was considered to be the pres-ence of five of the above symptoms. Among these, at least one of them needed to be sadness, rage, nerv-ousness or irritability, accompanied by difficulties in relationships at home, missing work or missing school. In addition to this, self-reported PMS was also evaluated as an outcome. The interviewees’ percep-tion was taken into account to define self-reported PMS, which was considered to be present when the women answered in the affirmative to the question “Do you think that you have premenstrual tension (PMT) or premenstrual syndrome?”.
The variables studied were classif ied or dichotomized according to their specific nature. Fam-ily income was categorized into increasing quartiles. The income range was from zero to R$15,000 per month. The economic level was presented in two ways: firstly, divided in the levels A, B, C, D and E, in con-formity with the Brazilian Economic Classification Criteria;* and secondly, in quartiles. Schooling was considered on the basis of numbers of completed years of study. Skin color was grouped as white and non-white. The present marital situation was dichotomized as having or not having a partner at the time of the interview. Parity was considered in terms of the number of children born alive reported by the woman. Work-ing outside of the home was considered as yes or no. The variable of physical activity during leisure time was constructed by means of a score of activities per-formed over the past week and dichotomized, with information collected only for women aged 20 years or over. Health perception was considered by means of the interviewee’s self-assessment, as excellent, very good, good, regular and bad, and was regrouped into three categories for analysis. Religious observance was divided into practicing and non-practicing. Smoking habits were classified as: never smoked, current smoker and used to smoke, but stopped more than one month ago. In collecting information re-garding psychiatric drugs, the interviewee was asked whether, over past 15 days, she had used medications that are only sold under medical prescription, and the commercial or generic names were noted down. Subsequently, these were classified according to the major pharmacological groups. In addition to antidepressives and anxiolytics, there were reports of amphetamines, hypnotic drugs and antipsychotic drugs, but the users of each of these accounted for less than 1% of the interviewees. These were
trans-formed into missing and excluded from the analysis. Interviewees were said to be hormonal contraceptives users if they utilized oral or injectable contraceptives or other hormonal methods (vaginal rings, implants and contraceptive adhesive patches).
Interviewees were considered to have regular men-struation if they had been menstruating cyclically within a range of every 21 to every 35 days over the past three months, whether using hormonal contra-ceptives or not, in conformity with the criteria de-scribed by Halbe.10
The women were considered to be losses when, af-ter three attempts to find them in their homes, they were always on trips, or had changed address or were not at home. The main reasons for refusal to be inter-viewed were that they did not have time or did not have any interest in taking part in the study, even when the interviewer tried on different days, at differ-ent times. After two refusals, one of the supervisors went to the home to explain in more detail what the importance of the study was.
There were 1,431 women who were eligible to take part in the study. There were seven losses due to changes of address, trips or never being found at home, and 29 did not agree to be interviewed after at least three attempts to interview them (2.6%). Thus, a total of 1,395 women were interviewed.
The 32 interviewers who were selected and trained were female, with schooling up to the end of high school, and they carried out the field work between October and December 2003.
The supervisors of the fieldwork were responsible for the quality control, and they reviewed the filling out of the questionnaires, the coding of the variables and the appraisal of the interviewers’ performance. They also applied a repeat questionnaire of reduced length to 10% of the interviewees, which included key questions to assess the repeatability by means of the Kappa index.
Sensitivity, specificity, accuracy and concordance (this latter measured by means of the Kappa index) were calculated to compare the results obtained from the score (the gold standard) with the self-reported PMS data.
The analyses were performed using the Stata for Windows 8.2 software, with description of the vari-ables by means of simple tabulation and summariz-ing of the data. The raw analysis was performed ussummariz-ing
" Rev Saúde Pública 2006;40(1) www.fsp.usp.br/rsp Population study of PMS
Silva CML et al
the Pearson χ2 test to evaluate proportions and Poisson regression to estimate prevalence ratios, since this is the most appropriate test when the prevalence is ex-pected to be high.2 For the ordinal and nominal
cat-egorical variables, the significance was evaluated using the linear trend and Wald tests, respectively.
Responses were considered to be unknown when the interviewees were unable to place themselves in one of the categories presented to them. These re-sponses were excluded from the analysis and trans-formed into missing. However, the proportion of such responses was no greater than 3% for any of the vari-ables. Association tests and stratified analysis using the Mantel-Haenszel test were performed between the variables studied in order to verify possible interac-tions. The variables that were possibly associated with the outcomes were taken for further analysis with any p-value, and those that showed associations with p<0.05 for at least one outcome were kept in the model, in order to maintain comparability between the two outcomes.
The adjusted analysis was performed using Poisson regression and taking into account the sampling proc-ess by clusters. This adjustment, which had the objec-tive of controlling for possible confounding factors, was done in accordance with the following analysis model: the first level consisted of schooling, age, skin color and parity; the second level consisted of health perception, current smoker and use of psychiatric drugs; and the third level consisted of hormonal contracep-tives. This model was formulated beforehand.
The project was approved by the Research Ethics Committee of the Faculdade de Medicina of Universidade Federal de Pelotas. Confidentiality of the information contained in the questionnaires was guaranteed and informed verbal consent was re-quested from all interviewees.
RESULTS
The effect of the study delineation on the preva-lence of PMS was 1.06 and the intraclass correlation was 0.005. Comparison relating to the question on menstrual regularity over the last three cycles resulted in a Kappa value of 0.75.
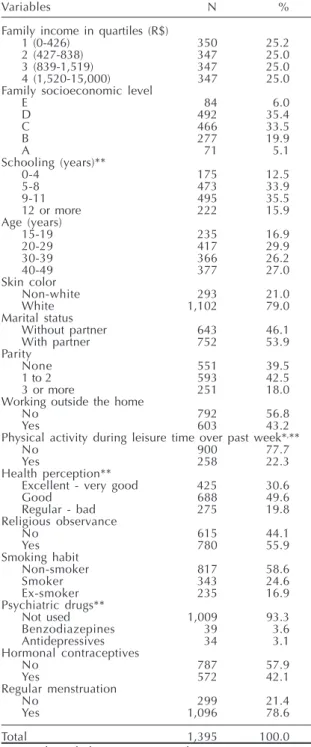
The family income of the study population pre-sented a median of R$839 per month and a mean of R$ 1,332 (SD=1,564). Table 1 shows that 41.4% of the women were in the economic levels D and E, half of them had had up to eight years of schooling and almost half were up to 30 years old. The white-skinned women represented 79% of the sample, more than
half of the women said that they lived with a partner, 60.5% of them had one or more children, and almost half of them said that they worked outside of the home. Around one-fifth of the women aged 20 or over prac-ticed physical activities during their leisure time, and 19.8% considered that their health was regular or bad. More than half of the women said that they practiced some type of religion. One quarter of them were
smok-Table 1 - Socioeconomic, demographic and behavioral characteristics of women aged 15 to 49 years. Pelotas, state of Rio Grande do Sul, Brazil, 2003.
Variables N %
Family income in quartiles (R$)
1 (0-426) 350 25.2
2 (427-838) 347 25.0
3 (839-1,519) 347 25.0
4 (1,520-15,000) 347 25.0
Family socioeconomic level
E 84 6.0
D 492 35.4
C 466 33.5
B 277 19.9
A 71 5.1
Schooling (years)**
0-4 175 12.5
5-8 473 33.9
9-11 495 35.5
12 or more 222 15.9
Age (years)
15-19 235 16.9
20-29 417 29.9
30-39 366 26.2
40-49 377 27.0
Skin color
Non-white 293 21.0
White 1,102 79.0
Marital status
Without partner 643 46.1
With partner 752 53.9
Parity
None 551 39.5
1 to 2 593 42.5
3 or more 251 18.0
Working outside the home
No 792 56.8
Yes 603 43.2
Physical activity during leisure time over past week*,**
No 900 77.7
Yes 258 22.3
Health perception**
Excellent - very good 425 30.6
Good 688 49.6
Regular - bad 275 19.8
Religious observance
No 615 44.1
Yes 780 55.9
Smoking habit
Non-smoker 817 58.6
Smoker 343 24.6
Ex-smoker 235 16.9
Psychiatric drugs**
Not used 1,009 93.3
Benzodiazepines 39 3.6
Antidepressives 34 3.1
Hormonal contraceptives
No 787 57.9
Yes 572 42.1
Regular menstruation
No 299 21.4
Yes 1,096 78.6
Total 1,395 100.0
N: Number of observations in each category *Information for women aged 20 years or more
#
Rev Saúde Pública 2006;40(1) www.fsp.usp.br/rsp
Population study of PMS Silva CML et al
ers at the time of the interview. The principal psychi-atric drugs utilized were benzodiazepines (3.6%) and antidepressives (3.1%). To prevent pregnancy, 42% were using hormonal contraceptives. Among the in-terviewees, 299 (21.4%) did not have regular men-struation and were excluded because of the impossi-bility of answering the question regarding the last three cycles. The sample was therefore left with 1.096 interviewees who had given responses about the symptoms of interest. The analyses were performed on these interviewees (Table 1).
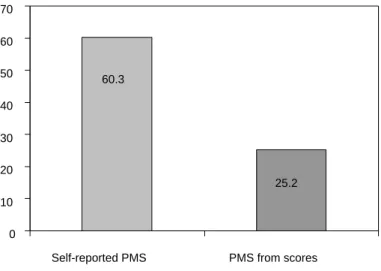
Figure 1 shows the prevalence of each premenstrual symptom. The most prevalent were irritability, ab-dominal discomfort, nervousness, headache, tiredness and mastalgia, all with a frequency of more than 50%. The prevalence of PMS when the modified DSM-IV criterion was used was 25.2% (95% CI: 22.5-27.9) and the self-reported prevalence was 60.3% (95% CI: 57.4-63.3) (Figure 2).
The test to validate the self-reported PMS, using the questionnaire-based characteriza-tion of the PMS as the gold standard, found the following values: sensitivity 94%, specificity 51%, positive predictive value 39%, negative predictive value 96% and accuracy 62%.
Among the women with self-reported PMS, 4.4% were using some type of treatment and 3.2% had already used treatment for control-ling their symptoms.
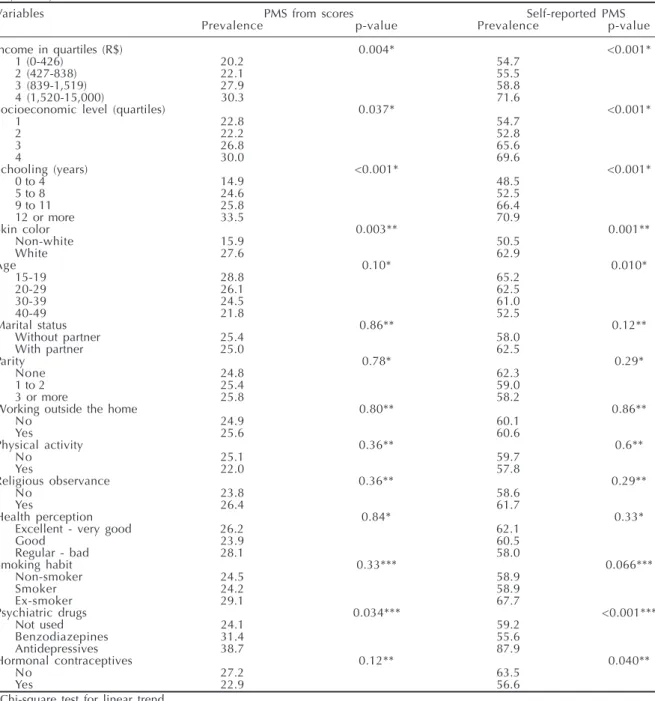
Table 2 shows the prevalences of PMS (us-ing the score and self-reported), accord(us-ing to the variables studied. It can be seen that PMS was most prevalent among the women of higher economic level (30 vs 69.6%), higher family income (30.3 vs 71.6%),
longer schooling (33.5 vs 70.9%) and in the younger age groups (28.8 vs 65.2%). It was also found that it occurred more among those with white skin (27.6 vs 62.9%) and those who were using psychiatric drugs, espe-cially antidepressives (38.7 vs 87.9%). Mari-tal status, parity, work outside the home, physical activities during leisure time, health perception, religious observance and smoking were not shown to be associated with the outcomes.
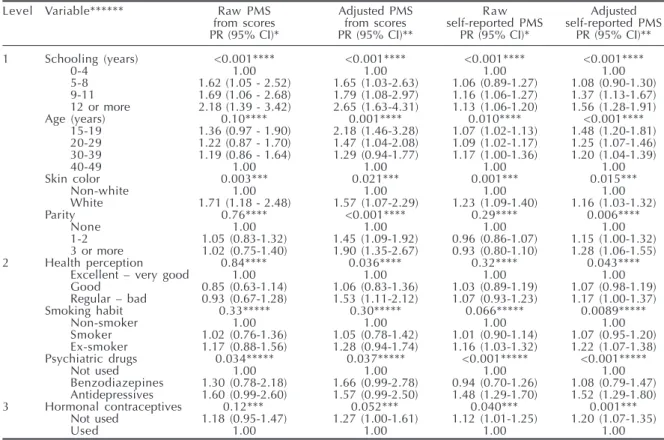
Table 3 shows the result from the adjusted analysis. The following maintained their as-sociation with PMS: longer schooling, younger age groups, white skin color and parity of three or more children. The risk of PMS was 53% greater among the women who perceived their health as regular or bad, in comparison with those who considered their health to be excellent or very good. The use of benzodiazepines or antidepressives showed a statistically significant association with PMS. The use of hormonal contraceptives represented a protection of 17%, in comparison with the women who were not using this method.
In evaluating the results from self-reported PMS, the risks appeared in the same directions, although lower for all the characteristics studied. The only ex-ception was found with regard to smoking habit, which although forming a risk factor did not show significance for PMS in relation to the score for ex-smokers. However, in the self-assessment, there was significant risk in the raw analysis and this was main-tained after adjustment.
Figure 1 - Prevalence and distribution of premenstrual symptoms (N=1,096). Pelotas, state of Rio Grande do Sul, Brazil, 2003.
39
71.4 70.1 56.9 56.9 52.4 51.7 42.1 40.1 35.3 26.5 24.4 17.8
0 25 50 75 100
Edema in hands and feet Confusion
Weight gain Rage Isolation Sadness Pains in joints Mastalgia Tiredness Headache Nervousness Abdominal discomfort Irritability
Figure 2 - Prevalence of premenstrual syndrome self-reported and from scoresdesfechos (N=1,096). Pelotas, state of Rio Grande do Sul, Brazil, 2003.
60.3
25.2
0 10 20 30 40 50 60 70
Self-reported PMS PMS from scores
$ Rev Saúde Pública 2006;40(1) www.fsp.usp.br/rsp Population study of PMS
Silva CML et al
*Nogueira CWM. Determinantes da síndrome pré-menstrual: análise de aspectos clínicos e epidemiológicos [tese de doutorado]. Campinas: Universidade Estadual de Campinas; 1998.
DISCUSSION
This is the first Brazilian study to show the preva-lence of PMS from a population-based cross-sectional study. The low percentages of losses and refusals, and the comparison with the age distribution of the data from the Brazilian Institute for Geography and Sta-tistics (2000 census) show that the results found are representative of the population of women aged 15 to 49 years in Pelotas.
In the present study, it was decided to utilize a defi-nition of PMS that considered whether symptoms that severely interfered in the women’s lives were present or not. Some authors,* differing from the present study, defined PMS as the presence of a single cyclical symp-tom, which implies greater sensitivity in the diagnos-tic criterion. In the sample studied, if this criterion had been utilized, the prevalence would have been 95.4%.
As expected, studies3,7,*carried out in
gynecologi-Table 2 - Prevalence of premenstrual syndrome found from scores and self-reported premenstrual syndrome, according to socioeconomic, demographic and behavioral variables for women of fertile age (N=1,096). Pelotas, state of Rio Grande do Sul, Brazil, 2003.
Variables PMS from scores Self-reported PMS
Prevalence p-value Prevalence p-value
Income in quartiles (R$) 0.004* <0.001*
1 (0-426) 20.2 54.7
2 (427-838) 22.1 55.5
3 (839-1,519) 27.9 58.8
4 (1,520-15,000) 30.3 71.6
Socioeconomic level (quartiles) 0.037* <0.001*
1 22.8 54.7
2 22.2 52.8
3 26.8 65.6
4 30.0 69.6
Schooling (years) <0.001* <0.001*
0 to 4 14.9 48.5
5 to 8 24.6 52.5
9 to 11 25.8 66.4
12 or more 33.5 70.9
Skin color 0.003** 0.001**
Non-white 15.9 50.5
White 27.6 62.9
Age 0.10* 0.010*
15-19 28.8 65.2
20-29 26.1 62.5
30-39 24.5 61.0
40-49 21.8 52.5
Marital status 0.86** 0.12**
Without partner 25.4 58.0
With partner 25.0 62.5
Parity 0.78* 0.29*
None 24.8 62.3
1 to 2 25.4 59.0
3 or more 25.8 58.2
Working outside the home 0.80** 0.86**
No 24.9 60.1
Yes 25.6 60.6
Physical activity 0.36** 0.6**
No 25.1 59.7
Yes 22.0 57.8
Religious observance 0.36** 0.29**
No 23.8 58.6
Yes 26.4 61.7
Health perception 0.84* 0.33*
Excellent - very good 26.2 62.1
Good 23.9 60.5
Regular - bad 28.1 58.0
Smoking habit 0.33*** 0.066***
Non-smoker 24.5 58.9
Smoker 24.2 58.9
Ex-smoker 29.1 67.7
Psychiatric drugs 0.034*** <0.001***
Not used 24.1 59.2
Benzodiazepines 31.4 55.6
Antidepressives 38.7 87.9
Hormonal contraceptives 0.12** 0.040**
No 27.2 63.5
Yes 22.9 56.6
*Chi-square test for linear trend **Chi-square test
%
Rev Saúde Pública 2006;40(1) www.fsp.usp.br/rsp
Population study of PMS Silva CML et al
cal clinics have shown prevalences greater than what was found in the present study. On the other hand, population-based studies5,22 have shown lower
preva-lence. However, there were differences between the diagnostic criteria in these studies. The present study found a higher prevalence of self-reported PMS that in another study.21 One possible explanation for this
difference is that the women with few symptoms also mentioned the presence of the syndrome, even when there was no interference in their daily activities.
Although the sampling process was performed by census tracts, the results obtained from analysis of the study delineation effect showed that there was no dif-ference in the prevalence of the outcome between the census tracts that reached the point of interfering in the interpretation of the results. Nonetheless, Poisson regression analysis took this sampling process into account, in accordance with Barros & Hirataka.2
In the present study, the self-reported prevalence of PMS was twice the rate diagnosed by means of the scoring system. The score was constructed in such a way that occasional discomfort was not classified as
presence of the syndrome or harm to health. From the sensitivity and specificity tests, it was observed that almost all the women who presented positive scores thought that they had PMS, but among those who said they had PMS, only half fulfilled the scoring criteria for PMS.
In cross-sectional studies, the possibility of pre-senting PMS but using some type of treatment or be-havior modifier may have led to underestimation of the prevalence encountered. This is because the in-formation on the presence of PMS and the factors associated with it are investigated at the same time.18
One example is the growing use of hormonal contra-ceptive methods on a continual basis among those who present PMS, thereby avoiding menstruation and the premenstrual period. Such women will not have menstruated during the past three months, and thus will not have answered the questions regarding pre-menstrual symptoms, or regarding self-reported PMS. With such a possibility, the prevalence found may be lower than the real prevalence. There is controversy regarding the range of menstrual cycle duration that is considered normal.10
Table 3 - Raw and adjusted prevalence ratios for premenstrual syndrome found from scores and self-reported premenstrual syndrome, according to socioeconomic, demographic and behavioral variables (N=1,096). Pelotas, state of Rio Grande do Sul, Brazil, 2003.
Level Variable****** Raw PMS Adjusted PMS Raw Adjusted
from scores from scores self-reported PMS self-reported PMS
PR (95% CI)* PR (95% CI)** PR (95% CI)* PR (95% CI)**
1 Schooling (years) <0.001**** <0.001**** <0.001**** <0.001****
0-4 1.00 1.00 1.00 1.00
5-8 1.62 (1.05 - 2.52) 1.65 (1.03-2.63) 1.06 (0.89-1.27) 1.08 (0.90-1.30)
9-11 1.69 (1.06 - 2.68) 1.79 (1.08-2.97) 1.16 (1.06-1.27) 1.37 (1.13-1.67)
12 or more 2.18 (1.39 - 3.42) 2.65 (1.63-4.31) 1.13 (1.06-1.20) 1.56 (1.28-1.91)
Age (years) 0.10**** 0.001**** 0.010**** <0.001****
15-19 1.36 (0.97 - 1.90) 2.18 (1.46-3.28) 1.07 (1.02-1.13) 1.48 (1.20-1.81)
20-29 1.22 (0.87 - 1.70) 1.47 (1.04-2.08) 1.09 (1.02-1.17) 1.25 (1.07-1.46)
30-39 1.19 (0.86 - 1.64) 1.29 (0.94-1.77) 1.17 (1.00-1.36) 1.20 (1.04-1.39)
40-49 1.00 1.00 1.00 1.00
Skin color 0.003*** 0.021*** 0.001*** 0.015***
Non-white 1.00 1.00 1.00 1.00
White 1.71 (1.18 - 2.48) 1.57 (1.07-2.29) 1.23 (1.09-1.40) 1.16 (1.03-1.32)
Parity 0.76**** <0.001**** 0.29**** 0.006****
None 1.00 1.00 1.00 1.00
1-2 1.05 (0.83-1.32) 1.45 (1.09-1.92) 0.96 (0.86-1.07) 1.15 (1.00-1.32)
3 or more 1.02 (0.75-1.40) 1.90 (1.35-2.67) 0.93 (0.80-1.10) 1.28 (1.06-1.55)
2 Health perception 0.84**** 0.036**** 0.32**** 0.043****
Excellent – very good 1.00 1.00 1.00 1.00
Good 0.85 (0.63-1.14) 1.06 (0.83-1.36) 1.03 (0.89-1.19) 1.07 (0.98-1.19)
Regular – bad 0.93 (0.67-1.28) 1.53 (1.11-2.12) 1.07 (0.93-1.23) 1.17 (1.00-1.37)
Smoking habit 0.33***** 0.30***** 0.066***** 0.0089*****
Non-smoker 1.00 1.00 1.00 1.00
Smoker 1.02 (0.76-1.36) 1.05 (0.78-1.42) 1.01 (0.90-1.14) 1.07 (0.95-1.20)
Ex-smoker 1.17 (0.88-1.56) 1.28 (0.94-1.74) 1.16 (1.03-1.32) 1.22 (1.07-1.38)
Psychiatric drugs 0.034***** 0.037***** <0.001***** <0.001*****
Not used 1.00 1.00 1.00 1.00
Benzodiazepines 1.30 (0.78-2.18) 1.66 (0.99-2.78) 0.94 (0.70-1.26) 1.08 (0.79-1.47) Antidepressives 1.60 (0.99-2.60) 1.57 (0.99-2.50) 1.48 (1.29-1.70) 1.52 (1.29-1.80)
3 Hormonal contraceptives 0.12*** 0.052*** 0.040*** 0.001***
Not used 1.18 (0.95-1.47) 1.27 (1.00-1.61) 1.12 (1.01-1.25) 1.20 (1.07-1.35)
Used 1.00 1.00 1.00 1.00
*Raw prevalence ratio and 95% confidence interval; **Adjusted prevalence ratio and 95% confidence interval; ***Heterogeneity test;
**** Linear trend test; *****Wald test;
& Rev Saúde Pública 2006;40(1) www.fsp.usp.br/rsp Population study of PMS
Silva CML et al
The Kappa test showed good concordance relating to the question on menstrual regularity. Considering that menstruation is usually an important event in women’s routines, it is expected that their recollec-tion of these events will have been clear.
It was found that PMS measured by the score and self-reported PMS were more prevalent among women of higher economic level and higher income. This may be due to the fact that the more affluent women had greater access to knowledge regarding the symp-toms. By knowing about the symptoms, they would be alert to the cyclical modifications in their bodies. This result is similar to what was found in a study carried out in Mexico.13 The risks in self-reported PMS
were in the same direction as for the constructed score, but lower. The likely cause of this was error in classi-fying the outcome.
The younger women reported more symptoms, and this has also been found by other authors,4,9,20 although
one study7 carried out in a gynecology clinic found
greater prevalence among women aged over 30 years. Since the present study was population-based, it is likely that, although the women identified their symp-toms at an early age, they only sought specialized assistance after a few years with the problem. There may also have been a cohort effect, in that the younger women are experiencing a time when PMS is dis-cussed to a much greater extent.
White skin color was associated with greater risk of PMS. This was also found in a gynecology outpatient clinic,* but not in another population-based study,5 in
which the prevalence was greater among blacks, in a survey carried out by telephone. There is no known plausible biological reason why white skin color should present greater prevalence of PMS. What may be acting as a confounding factor in this association are the socioeconomic factors, since it is known that white women have a higher economic level. It was observed that the risks remained significant after ad-justment for the socioeconomic and demographic vari-ables, but diminished in magnitude. It might be envis-aged that other factors not studied here may exist, and that these could be interfering with the association.
The finding that there was no difference in the prevalence or in the risk of PMS between women with and without a partner can be highlighted, as found in other studies.5,21 This serves to demystify the old
con-cept that when the woman marries, she will get bet-ter. There was also no difference between the women who worked outside of the home and those who did
not.5 There has, however, been a report of greater risk
for women with children.11,*
Physical activity during leisure time and smoking habit did not present any association with PMS in the present study, whereas in some others, physical activity was a risk factor for PMS5 and smoking habit
showed an association with the outcome.22 Health
perception did not show an association with PMS in the raw analysis. However, after adjustment for school-ing, there was a positive relationship between PMS and the perception of regular/bad health. This nega-tive confounding effect can be explained by the schooling, since self-perception of regular/bad health was associated with low levels of schooling, with in turn was associated with lower risk of PMS.
The use of psychiatric drugs (anxiolytics and antidepressives) was associated with greater prevalence of PMS, which may signify that the women who used more medications were those who made more reports of symptoms during medical consultations. Thus, it is not thought that the medications cause the symptoms, but that their use is a consequence of PMS. Good re-sults in relation to PMS are being obtained today through treatment using antidepressives6 and, during
some symptomatic periods, anxiolytics,10 since the
symptoms of PMS have the same nature as those of depression and anxiety. The fact that only 20% of the women with PMS as defined in the present study were utilizing some form of treatment can be highlighted. It might be envisaged that the other women either did not have access to healthcare services or, when they went there, they did not received the due attention.16,17
There was only a significant difference between use and non-use of hormonal contraceptives in rela-tion to self-reported PMS. It is possible that there was insufficient statistical power to detect such a differ-ence when PMS was measured using the scoring sys-tem. Some other authors have not found such differ-ences,5,* while in other studies the use of hormonal
medication was an exclusion criterion.7,11 The use of
hormonal contraception has been prescribed as a means of preventing hormonal fluctuation and the appearance of premenstrual symptoms. The results found indicate that these medications provide pro-tection against the appearance of symptoms.
One limitation to the present study is its use of retrospective information. There is evidence that data collected prospectively over two or three cy-cles show prevalences that differ from those obtained retrospectively.13
'
Rev Saúde Pública 2006;40(1) www.fsp.usp.br/rsp
Population study of PMS Silva CML et al
REFERENCES
1. Allen SS, McBride CM, Pirie PL. The shortened premenstrual assessment form. J Reprod Med 1991;36(11):769-72.
2. Barros AJ, Hirakata VN. Alternatives for logistic regression in cross-sectional studies: an empirical comparison of models that directly estimate the prevalence ratio. BMC Med Res Methodol 2003;3(1):21.
3. Christensen AP, Oei TP. Correlates of premenstrual dysphoria in help-seeking women. J Affect Disord 1995;33(1):47-55.
4. Cohen LS, Soares CN, Otto MW, Sweeney BH, Liberman RF, Harlow BL. Prevalence and predictors of premenstrual dysphoric disorder (PMDD) in older premenopausal women: the Harvard study of moods and cycles. J Affect Disord 2002;70(2):125-32.
5. Deuster PA, Adera T, South-Paul J. Biological, social, and behavioral factors associated with premenstrual syndrome. Arch Fam Med 1999;8(2):122-8.
6. Diegoli MS, da Fonseca AM, Diegoli CA, Pinotti JA. A double-blind trial of four medications to treat severe premenstrual syndrome. Int J Gynaecol Obstet 1998;62(1):63-7.
7. Diegoli MSC, Fonseca AM, Diegoli CA, Halbe HW, Bagnoli VR, Pinotti JA. Síndrome pré-menstrual: estudo da incidência e das variações sintomatológicas. Rev Ginecol Obstet 1994;5(4):238-242.
8. Freeman EW. Premenstrual syndrome and premenstrual dysphoric disorder: definitions and diagnosis.
Psychoneuroendocrinology 2003;28 Suppl 3:25-37.
9. Freeman EW, Rickels K, Schweizer E, Ting T. Relationships between age and symptom severity among women seeking medical treatment for premenstrual symptoms. Psychol Med 1995;25(2):309-15.
10. Halbe HW. Tratado de ginecologia. 3ª ed. São Paulo: Roca; 2000.
11. Hsiao MC, Liu CY, Chen KC, Hsieh TT. Characteristics of women seeking treatment for premenstrual syndrome in Taiwan. Acta Psychiatr Scand 2002;106(2):150-5.
12. Johnson SR. The epidemiology and social impact of premenstrual symptoms. Clin Obstet Gynecol 1987;30(2):367-76.
13. Marvan ML, Cortes-Iniestra S. Women’s beliefs about the prevalence of premenstrual syndrome and biases in recall of premenstrual changes. Health Psychol 2001;20(4):276-80.
14. Marvan ML, Diaz Eroza MC. Sintomatología premenstrual en mujeres de área rural y urbana. Acta Psiquiatr Psicol Am Lat 1995;41(4):316-21.
15. Moos RH. The development of a menstrual distress questionnaire. Psychosom Med 1968;30(6):853-67.
16. Nicolson P. The menstrual cycle, science and femininity: assumptions underlying menstrual cycle research. Soc Sci Med 1995;41(6):779-84.
17. Reid RL. Premenstrual syndrome: a time for
introspection. Am J Obstet Gynecol 1986;155(5):921-6.
18. Rothman KJ, Greeland S. Modern Epidemiology. 2nd
ed. Philadelphia(PA): Lippincott-Ravel; 1998.
19. Steiner M, Macdougall M, Brown E. The premenstrual symptoms screening tool (PSST) for clinicians. Arch Women Ment Health 2003;6(3):203-9.
20. Sternfeld B, Swindle R, Chawla A, Long S, Kennedy S. Severity of premenstrual symptoms in a health maintenance organization population. Obstet Gynecol 2002;99(6):1014-24.
21. Sveindottir H, Backstrom T. Prevalence of menstrual cycle symptom cyclicity and premenstrual dysphoric disorder in a random sample of women using and not using oral contraceptives. Acta Obstet Gynecol Scand 2000;79(5):405-13.
22. Wittchen HU, Becker E, Lieb R, Krause P.
Prevalence, incidence and stability of premenstrual dysphoric disorder in the community. Psychol Med 2002;32(1):119-32.
In conclusion, the symptoms were more prevalent at higher economic levels, longer schooling levels, among younger women and among those of white skin color. It must be considered that differences in access to information and knowledge of the symp-toms may explain these associations. However, there is a need for further studies to investigate this ques-tion. It is recommended that a sample from a young population with similar access to information should be studied, and if possible by means of a longitudinal study, in order to evaluate the appearance or
persist-ence of more intense symptoms with advancing age.