Patterns of deliveries in a
Brazilian birth cohort: almost
universal cesarean sections for
the better-off
Padrões dos partos em uma coorte
de nascimentos: cesarianas quase
universais para os ricos
Aluísio J D BarrosI
Iná S SantosI
Alicia MatijasevichI
Marlos Rodrigues DominguesII
Mariângela SilveiraI
Fernando C BarrosIII
Cesar G VictoraI
I Programa de Pós-graduação em Epidemiologia. Universidade Federal de Pelotas (UFPel). Pelotas, RS, Brasil II Programa de Pós-Graduação em Educação
Física. UFPel. Pelotas, RS, Brasil III Programa de Pós-Graduação em Saúde e
Comportamento. Universidade Católica de Pelotas. Pelotas, RS, Brasil
Correspondence: Aluísio J D Barros
Programa de Pós-graduação em Epidemiologia UFPel
R. Mal. Deodoro, 1160 3º piso 96020-220 Pelotas, RS, Brasil E-mail: [email protected] Received: 7/15/2010 Approved: 3/9/2011
Article available from: www.scielo.br/rsp
ABSTRACT
OBJECTIVE: To describe the patterns of deliveries in a birth cohort and to
compare vaginal and cesarean section deliveries.
METHODS: All children born to mothers from the urban area of Pelotas,
Brazil, in 2004, were recruited for a birth cohort study. Mothers were contacted and interviewed during their hospital stay when extensive information on the gestation, the birth and the newborn, along with maternal health history and family characteristics was collected. Maternal characteristics and childbirth care fi nancing – either private or public healthcare (SUS) patients - were the main factors investigated along with a description of C-sections distribution according to day of the week and delivery time. Standard descriptive techniques, χ2 tests for comparing proportions and Poisson regression to
explore the independent effect of C-section predictors were the methods used.
RESULTS: The overall C-section rate was 45%, 36% among SUS and 81%
among private patients, where 35% of C-sections were reported elective. C-sections were more frequent on Tuesdays and Wednesdays, reducing by about a third on Sundays, while normal deliveries had a uniform distribution along the week. Delivery time for C-sections was markedly different among public and private patients. Maternal schooling was positively associated with C-section among SUS patients, but not among private patients.
CONCLUSIONS: C-sections were almost universal among the wealthier
mothers, and strongly related to maternal education among SUS patients. The patterns we describe are compatible with the idea that C-sections are largely done to suit the doctor’s schedule. Drastic action is called for to change the current situation.
DESCRIPTORS: Parturition. Cesarean Section, trends. Perinatal Care.
Despite international recommendations that cesarean section (C-section) rates should be kept below 15%,3
they have increased worldwide in the last three decades. Globally, C-sections account for around 15% of child-birth deliveries, but rates as high as 50% are seen in some countries.13 Although rates below 5% may refl ect
lack of access to health services,24 high rates do not
necessarily mean improved perinatal care. In high-income populations, C-section rates are mostly below 25%, and the lowest ones (below 15%) are reported in Nordic countries.22 The highest rates are reported in
middle-income countries such as China, Mexico and Brazil (around 40%).22 Recently rates above 30% were
reported in the United States and Australia.15 C-section
rates appear to be increasing in most countries. It is a challenge to achieve adequate C-section rates as it entails a balance between performing appropriately indicated C-sections while avoiding unnecessary inter-ventions that do not provide better health outcomes and can cause complications to the mother and the infant.29
RESUMO
OBJETIVO: Descrever o padrão dos partos em uma coorte de nascimentos,
comparando partos normais e cesarianos.
MÉTODOS: Todos os recém-nascidos de moradoras da área urbana de
Pelotas (RS) em 2004 foram recrutados para uma coorte de nascimentos. As mães foram entrevistadas ainda no hospital, quando informações detalhadas sobre a gestação, o parto e o recém-nascido, junto com um histórico da saúde materna e características da família foram coletadas. Características maternas e o fi nanciamento do parto foram os principais fatores estudados. Também se fez uma descrição da distribuição das cesáreas por hora do dia e dia da semana. Técnicas padrão de análise descritiva e testes qui-quadrado para comparar proporções e regressão Poisson para explorar o efeito independente de preditores da cesárea foram os métodos utilizados.
RESULTADOS: A taxa global de cesarianas foi de 45%, 36% entre pacientes
do SUS e 81% no serviço privado, onde se relatou que 35% das cesarianas foram eletivas. As cesarianas foram mais freqüentes nas terças e quartas-feiras, com uma redução de cerca de um terço aos domingos, enquanto os partos normais apresentaram distribuição uniforme ao longo da semana. O horário das cesarianas no setor público e no privado foi muito diferente. A escolaridade materna se associou positivamente com a cesariana entre as mães do serviço público, mas não do privado.
CONCLUSÕES: A cesariana foi muito freqüente entre as mães mais ricas,
e fortemente associada com a escolaridade materna entre pacientes do SUS. Os padrões descritos são compatíveis com a hipótese de que as cesáreas são feitas, em grande parte, para atender a conveniência das agendas dos médicos. A situação atual só será revertida com políticas radicais.
DESCRITORES: Parto. Cesárea, tendências. Assistência Perinatal.
Obstetrícia. Fatores Socioeconômicos. Estudos de Coortes.
INTRODUCTION
Unfortunately, medical indications such as fetal distress or preeclampsia are not the only reasons for C-section deliveries. The mother’s request based on cultural factors, past experience, concerns about the baby’s well-being or even fear of labor are frequently the actual reasons for C-sections.18,23 Some authors have argued
that C-section delivery has become a matter of choice and mothers see it as an option.12,20 Many obstetricians
are apparently ready to agree with the mother’s request for an elective C-section claiming reduced risk of pelvic
fl oor or fetal injury, maintenance of sexual function, and physician-patient convenience.32 Defensive medicine,
i.e., delivering care in a way to avoid lawsuits has also been documented as a reason for C-sections.14
Challenging the idea that C-sections are harmless recent evidence shows they are associated with maternal morbidity and mortality. A multicenter study30 in Latin
a Ministério da Saúde. Rede Interagencial de Informações em Saúde - RIPSA. Indicadores e Dados Básicos de Saúde - Brasil-2008 [cited 2010 May 6]. Available from: http://tabnet.datasus.gov.br/cgi/idb2008/matriz.htm
C-section delivery reduced the risk of fetal death in breech presentations and the risk of intrapartum fetal death in cephalic presentations. On the other hand, C-sections increased the risk of severe maternal and neonatal morbidity and mortality in cephalic presen-tations.30 A study in the United States on elective
C-sections showed that more than one third of deliveries were before 39 complete weeks of gestation and that the children born were at a higher risk of mortality and several other adverse neonatal events.26 A multicountry
study based on the World Health Organization (WHO) Global Survey on Maternal and Perinatal Health also found increased risks for adverse short-term maternal outcomes (death, intensive care unit admission, blood transfusion and hysterectomy) among women under-going C-sections without medical indication in all three continents where the survey was conducted – the Americas, Africa and Asia.25
In Latin America most countries present high C-section rates.29 Brazil has a particularly worrying situation as
nearly 50% of all deliveries are C-sections and this rate is as high as 80% in the private sector.1 In 1970 C-section
rates were around 15%10 but since then this situation
has dramatically changed. C-section rates doubled in the 1980s, and they were right below 40% in 1984. Researchers in Brazil became alarmed by the increasing trend and potentially harmful effects of unnecessary C-sections.9 The rates remained stable until 2000 when
they started to increase again and reached the current levels.a During this period, the Brazilian health sector
has undergone a complete reform with the creation of a national unifi ed public health system in 1988, the
Sistema Único de Saúde (SUS). The SUS is based on the
principle of universal comprehensive care. With respect to childbirth deliveries, starting from the mid-1990’s more than 90% of deliveries in Brazil were hospital-based, and more than 80% fi nanced by the SUS.8
Increasing C-section rates have been reported in many countries and this issue has been widely discussed. The health system organization and availability of midwives or obstetric nurses are contributing factors for this issue. The mothers-to-be develop strong relationships with midwives from prenatal to postnatal care visits increasing the likelihood of vaginal births.28 In Brazil,
regardless of fi nancing or budget constraints, obstetri-cians assist almost all deliveries and their convenience may play an important role in the decision about the type of delivery.17 There is widespread evidence that
doctors’ attitudes during the prenatal and peri-delivery period may increase the likelihood of a C-section.16,21,27
In view of increasing C-section rates in Brazil, there are growing concerns about its indiscriminate use. Thus, given the availability of detailed high quality data on
births included in the Pelotas 2004 birth cohort, we prepared this paper in order to evaluate patterns of delivery mode in this setting.
METHODS
A birth cohort study was started in 2004 in the city of Pelotas, state of Rio Grande do Sul, Southern Brazil, following two other birth cohorts launched in 1982 and 1993. Pelotas has approximately 340,000 inhabitants (according to projections based on the 2000 Population Census, Brazilian Institute of Geography and Statistics). From January 1st to December 31st, 2004, all the fi ve
hospitals in the city were visited on a daily basis by a team of trained interviewers. Eligible mothers – those living in the urban area of Pelotas – were interviewed within 24 hours after delivery. A total of 4,231 live born babies were successfully recruited to the study (only 32 mothers refused to participate [0.8%]). Non-hospital deliveries (20 in total) were also included in the cohort since the mothers and the infants born were taken to the maternity hospital immediately after delivery and were also recruited. Multiple and out-of-hospital births, and those with missing information about type of delivery were excluded from the analyses, so that 4,126 births remained. The exclusion of multiple and out-of-hospital births was motivated by very high and very low odds of a C-section, respectively. Their effect would be negligible since only 188 births were excluded through these criteria.
Detailed information about the family’s socioeconomic conditions, maternal lifestyle, obstetric history, prenatal care, gestational morbidity, and birth conditions was collected during the interview. Newborns’ measure-ments including weight, length, and circumferences of head, thorax and abdominal were taken and their gestational age was assessed. These children were visited at 3, 12, 24 and 48 months of age. A detailed account of the cohort methods is given elsewhere.6,7
Comparisons with the previous Pelotas birth cohorts are also available.7
preeclampsia, eclampsia, diabetes); and elective (previous C-section, tubal ligation, mother’s request, doctor’s choice, scheduled C-section). Maternal schooling was categorized as 0–4, 5–8, 9–11, and 12+ completed years of schooling. Skin color/race was self-reported, and originally recorded in fi ve categories (white, black, mixed, native and Asian). Given the very small number of mothers (<1%) in the latter two groups, they were recoded as white. The national wealth index (IEN), an asset-based economic indicator, was used for classifi cation of socioeconomic position (SEP).5 The
study sample was divided into groups based on cut-off points of the reference quintile for the city’s popula-tion. They are different from the sample quintiles, and percentages in each reference quintile differ from 20% since the fertility rate is inversely associated with SEP. The source of payment for birth was classifi ed as public (covered by the SUS) or private (including both private insurance and direct out-of-pocket payment).
The analysis was performed using Stata v.10.1 (StataCorp., Stata Statistical Software Release 10, College Station, TX, 2009). Standard descriptive
techniques were used, along with χ2 tests for comparing
proportions. A Poisson model4 was used to explore
the independent effect of C-section predictors and to estimate their adjusted prevalence ratios. The propor-tions of C-secpropor-tions by maternal schooling and source of payment for birth adjusted for other predictors were obtained with the use of a Poisson model using Stata’s margins command.
The study was approved by the Research Ethics Committees at the Universidade Federal de Pelotas Medical School and at WHO (Geneva). Prior to the interview, the study objectives, requirements for their participation and confi dentiality issues were explained to the mothers. They were given opportunity to ask questions and then were asked to sign an informed consent form. A copy was provided to them.
RESULTS
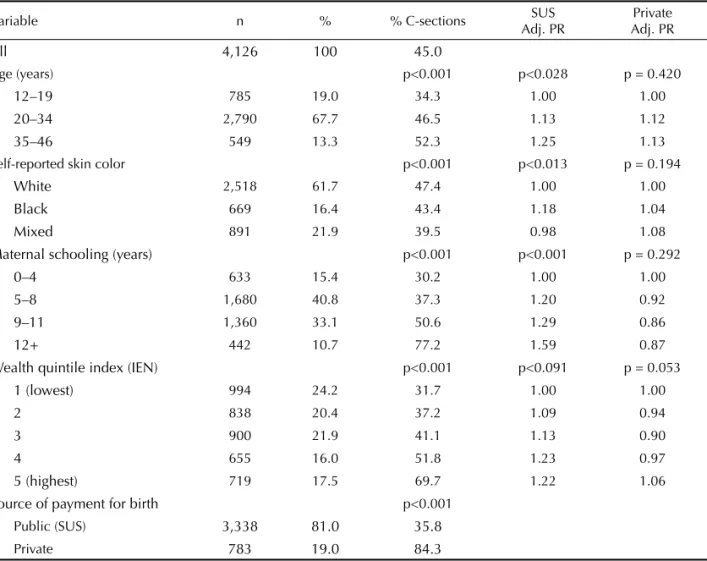
Table 1 shows sociodemographic characteristics of the mothers and source of payment for birth along with C-section proportions for each subgroup. Most mothers
Table 1. Characteristics of mothers and source of payment for birth with C-section prevalence by subgroup, plus adjusted prevalence ratios of C-section in the Brazilian National Health System (SUS) and private patients. Pelotas, Southern Brazil, 2004.
Variable n % % C-sections SUS
Adj. PR
Private Adj. PR
All 4,126 100 45.0
Age (years) p<0.001 p<0.028 p = 0.420
12–19 785 19.0 34.3 1.00 1.00
20–34 2,790 67.7 46.5 1.13 1.12
35–46 549 13.3 52.3 1.25 1.13
Self-reported skin color p<0.001 p<0.013 p = 0.194
White 2,518 61.7 47.4 1.00 1.00
Black 669 16.4 43.4 1.18 1.04
Mixed 891 21.9 39.5 0.98 1.08
Maternal schooling (years) p<0.001 p<0.001 p = 0.292
0–4 633 15.4 30.2 1.00 1.00
5–8 1,680 40.8 37.3 1.20 0.92
9–11 1,360 33.1 50.6 1.29 0.86
12+ 442 10.7 77.2 1.59 0.87
Wealth quintile index (IEN) p<0.001 p<0.091 p = 0.053
1 (lowest) 994 24.2 31.7 1.00 1.00
2 838 20.4 37.2 1.09 0.94
3 900 21.9 41.1 1.13 0.90
4 655 16.0 51.8 1.23 0.97
5 (highest) 719 17.5 69.7 1.22 1.06
Source of payment for birth p<0.001
Public (SUS) 3,338 81.0 35.8
Private 783 19.0 84.3
Missing information for each variable: age=2; skin color=48; schooling=11; IEN=20; source of payment for birth=5 IEN: wealth quintile index
were 20–34 years old, but 19% of them were teenagers. Most mothers reported being white (62%), and having 5–11 years of schooling (74%). Less than 7% had graduated. C-section rates were positively associated with age, schooling and socioeconomic position when all mothers were analyzed. C-sections were also more frequent among white women.
A total of 1855 (45%) mothers had C-sections. The vast majority of deliveries (81%) were fi nanced by the SUS. The C-section rate was 36% in deliveries paid by the SUS, compared to 84% among those paid by private sources. The adjusted effects of the predictors studied were estimated by Poisson regression that was fi tted separately for SUS and private patients. The results (Table 1) show no associations among private patients. Among SUS patients, however, C-sections were posi-tively associated with maternal age and schooling. More educated mothers had 59% more C-sections compared to those with less than fi ve years of schooling. Also, black mothers had 18% more C-sections than white ones. Figure 1 shows the proportions of C-sections by maternal schooling and source of payment, without adjustment for other covariates. Among women who had vaginal deliveries (N=2,271), 67% had an episi-otomy and 4% received analgesia.
Figure 2 shows that vaginal births did not vary according to day of week – all bars lie within the 95% distribution limits (p = 0.899). The same was not true for C-sections and a clear pattern was seen, with a larger number of births occurring on Tuesdays and Wednesdays, and fewer than expected births occurring on weekends (p<0.001).
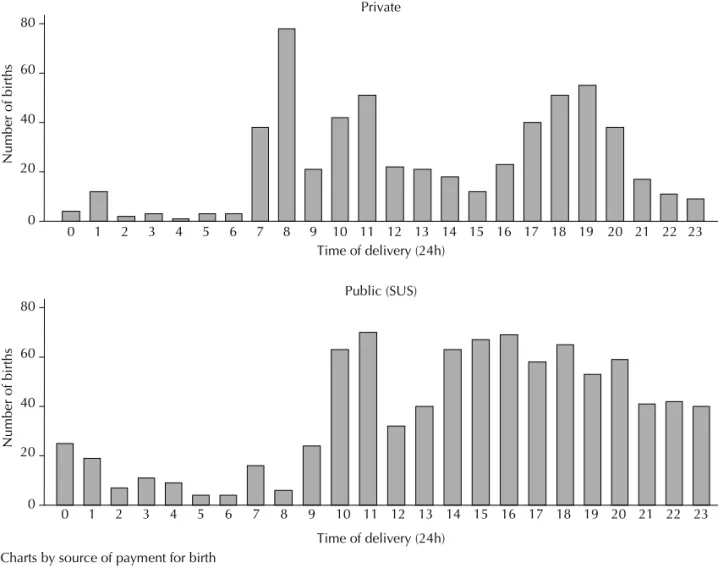
There was a similar pattern regarding time of the day. The mean number of deliveries by C-section from midnight to 6 am is less than a quarter of those between noon and 6 pm (p<0.001). Much less evident differences were seen during other times of the day. There were also strong differences of C-section time between private and public patients. Figure 3 shows peaks in the morning and late afternoon among private patients. Among public patients, C-sections increased after 10 am and then after 2 pm. In both groups, there was a clear reduction in the number of births during lunchtime (12 noon to 2 pm).
According to the reasons given by the mothers, 23% of C-sections were elective, 41% due to maternal causes and 36% due to fetal causes (Table 2). Signifi cant varia-tions were observed according to age, socioeconomic status and source of payment. Elective C-sections were reported more frequently by better-off and older than poor and younger women. Private patients also reported elective C-sections more often than SUS patients.
DISCUSSION
Since 1985 the general consensus is that the propor-tion of C-secpropor-tions should not be much higher than 15%.3 Althabe & Belizán (2006)2 have pointed out the
lack of any gain in terms of infant or maternal health where C-section rates are above 15%. In fact, recent studies have suggested that unnecessary C-sections can be detrimental,26,29 in contrast to what is commonly
believed.
Figure 1. C-section prevalence by maternal schooling and source of payment for birth (public or private). Pelotas, Sou-thern Brazil, 2004.
p<0.001 p = 0.442
0 .2 .4 .6 .8 1
SUS (public) private 0-4 5-8 9-11 12+ 0-4 5-8 9-11 12+
Proportion of C-section
Chart by maternal schooling (yrs) and source of payment for birth
Figure 2. Number of vaginal and C-section deliveries by weekday. Lines indicate the 95% distribution limits based on Poisson distribution. Pelotas, Southern Brazil, 2004.
0
100
200
300
400
Number of births
Mon Tue Wed Thu Fri Sat Sun Weekday
There is also an ongoing debate on the causes for increasing C-section rates. Much has been written about why and how much mothers-to-be request their doctors a C-section. The reasons include fear of childbirth pain, along with the perception that C-sections are safe,18 the
view that they are a superior form of medical care since they are so common among the better-off women, and also its use as a strategy to prevent low-quality care.11
But how frequently do mothers actually push their doctors into doing a C-section? And do they have the power to get it from their obstetricians if they are not willing to do so? Few studies sought to answer these questions. A study carried out in the UK found that, despite women reported the usual reasons such as fear of labor, and a traumatic previous experience, few of them actually requested a C-section,33 which was
confi rmed by most obstetricians.
A recent study in Brazil explored the views of pregnant women about type of delivery along the pregnancy and the observed outcome. Two private maternity hospitals were studied and an astonishing rate of 88% of C-sections was observed.16 In the beginning of
their pregnancies, a third of the women were already inclined to have a C-section, half reported a preference
for vaginal delivery and 17% were undecided. By the end of their pregnancies, the mothers in the original C-section group had not change their preference, but 56% in the vaginal delivery group had changed their minds towards a C-section, as well as ¾ of the undecided women. However, their preferences did not make much of a difference as C-section rates were greater than 90%, except in the group of women who kept their preference for a normal delivery among which “only” 73% had a C-section. The alert for an imminent cesarean section epidemic had already been given in 1991,10 when
inves-tigators from Pelotas were concerned about the 28% C-section rate recorded in the 1982 Pelotas Birth Cohort. Our study found a marked difference in C-section rates between public and private patients (36% and 84%, respectively), what has been well-documented in Brazil.1 Among public patients, these rates seem to be
limited only by the restrictions imposed by the SUS. Among private patients, the only limit for C-sections seems to be feasibility, since some parturients or their doctors may arrive too late at the hospital, when labor is so advanced that a C-section is no longer possible. In both groups C-section rates are well above those recom-mended by WHO despite several efforts to encourage
Table 2. Reported reasons for C-section by maternal and delivery characteristics. Pelotas, Southern Brazil, 2004.
Variable Fetal reasons
n (%)
Maternal reasons n (%)
Elective reasons
n (%) p-value
All 577 (36.3) 653 (41.1) 360 (22.6)
Age (years) p<0.001
12–19 101 (43.4) 120 (51.5) 12 (5.2)
20–34 398 (35.6) 453 (40.6) 266 (23.8)
35–46 78 (32.6) 80 (33.5) 81 (33.9)
Self-reported skin color
White 382 (37.9) 397 (39.4) 229 (22.7) p=0.150
Black 83 (31.7) 125 (47.7) 54 (20.6)
Mixed 105 (34.7) 125 (41.3) 73 (24.1)
Maternal schooling (years) p=0.049
0–4 53 (31.7) 67 (40.1) 47 (28.1)
5–8 203 (37.5) 241 (44.6) 98 (18.1)
9–11 215 (36.0) 239 (40,0) 144 (24.1)
12+ 104 (37.6) 103 (37.2) 70 (25.3)
Wealth quintile index (IEN) p<0.001
1 (lowest) 101 (36.6) 123 (44.6) 52 (18.8)
2 114 (40.7) 111 (39.6) 55 (19.6)
3 120 (37.2) 153 (47.4) 50 (15.5)
4 105 (36.8) 112 (39.3) 68 (23.9)
5 (highest) 132 (32.2) 147 (35.9) 131 (32.0)
Source of payment for birth p<0.001
Public (SUS) 409 (39.0) 470 (44.8) 170 (16.2)
Private 168 (31.1) 183 (33.8) 190 (35.1)
vaginal deliveries and limit C-sections: payment of delivery analgesia for SUS patients (1998), the Pact for C-section Rate Reduction between the Brazilian Ministry of Health and state health departments (2000), enforcement of a ceiling of 27% C-section rate for states that did not sign the Pact (2002), and a national mass campaign, “Humanization of Normal Childbirth and Reduction of Unnecessary Cesareans” (2006). The discussion of who is primarily responsible for the increase in C-sections – doctors or mothers – may be moot, but a historical perspective is useful. In Brazil, in the 1970s, the social security system that preceded SUS paid more for a C-section than for a vaginal delivery. Added to the fact that the former can be carried out in an hour or less, whereas a vaginal delivery requires several hours, there was a sharp increase in C-sections (from 15% in 1970 to 31% in 1980),9 that was concentrated
among middle class families that were social security users. Private doctors providing care to better-off families charged more for C-sections than for vaginal deliveries. Consequently C-sections also represented increased income, resulting in higher C-section rates for this group as well. As described by Béhague et al,11
and confi rmed in the present study, C-sections became associated to the better off and therefore were associated with the idea of high-quality care.
Today, in Pelotas, providing high-quality private care means that the same doctor provides both prenatal and delivery care. Except when a C-section is scheduled ahead, a patient will call her doctor when they go into labor. Because midwives do not carry out deliveries, the physician will have to go to the hospital specifi cally for this task. If it takes place during the day the doctor will have to cancel other appointments, and if it takes place during the night this result in lost sleep or leisure time. Therefore, it is not surprising that doctors prefer to perform quick scheduled C-sections rather than spending hours assisting their patients for a vaginal delivery. Although insurance payments for C-sections and vaginal deliveries are now virtually the same, the payment/time ratio is still markedly favorable to cesareans.
The pattern of C-sections reported here strongly supports the previous assertions. The concentration of deliveries in the middle of the week at specifi c times –differently for private and public patients–, almost never on Sundays or at early hours, all seem
0 20 40 60 80
0 1 2 3 4 5 6 7 8 9 10 11 12 13 14 15 16 17 18 19 20 21 22 23 Private
Number of births
Time of delivery (24h)
Time of delivery (24h) Charts by source of payment for birth
0 20 40 60 80
0 1 2 3 4 5 6 7 8 9 10 11 12 13 14 15 16 17 18 19 20 21 22 23 Public (SUS)
Number of births
to point to a situation that is defi ned by the doctor, in agreement with the mother. The change in the minds of mothers towards C-section is achieved along their pregnancy, with repeated contact with the doctor during prenatal care.9,16 In 1993, Faúndes & Cecatti were
already stressing that obstetricians who work individu-ally, rather than in a group, were hard pressed to save time and keep an organized schedule.18 Preference for
C-sections can easily arise from that.
The strong trend of increasing C-section rates with maternal schooling among public patients is consistent with two hypotheses. First, if maternal request is an important factor, maybe more educated mothers can be more persuasive and get the C-section they desire, as suggested by Béhague.11 Alternatively, doctors can
perceive them as closer to private patients and thus more deserving of “better” care. Or they can opt for a cesarean just to play safe, believing that C-sections are associated with fewer complications and lower risk of lawsuits (they are now increasing in Brazil). In any case, the study results show an appalling scenario of inequity within the public health service.
The situation in one Brazilian city is not much different from more prosperous parts of the country. A broad national picture of how delivery care is provided is given by Waniez et al (2006).31 Different from
countries where deliveries are mostly dealt with by midwives, or where doctors seem to believe that a vaginal birth is the best option,19 deliveries in Brazil
can only be performed by doctors. Analgesia during vaginal labor is seldom provided for public patients and thus mothers have to choose between labor without analgesia or a C-section, and the fear of pain is a common complaint among mothers of low socioeco-nomic condition.11 In our study only 4% of the mothers
received analgesia during a normal delivery, regard-less of their source of payment. Also, episiotomy was performed in two thirds of normal deliveries, adding discomfort to the puerperal period.
The present study provided strong evidence on a well-established culture of C-sections, which is corroborated by a study carried out in Switzerland with mothers of different nationalities. Brazilian mothers had the higher C-section rate (41%). There seems to be a vicious circle and only a dramatic change in child-birth policy can reverse this trend towards C-sections in a near future in Brazil. Barros et al (1986)9 and
Faúndes & Cecatti (1993)17 recommendations made
decades ago of reducing repeat C-sections, raising public awareness on the pros and cons of both types of childbirth deliveries, reorganizing obstetric care with the reintroduction of midwives when C-section rate in Brazil was 38% are still applicable.
1. Almeida S, Bettiol H, Barbieri MA, Silva AA, Ribeiro VS. Signifi cant differences in cesarean section rates between a private and a public hospital in Brazil. Cad Saude Publica. 2008;24(12):2909-18. DOI:10.1590/ S0102-311X2008001200020
2. Althabe F, Belizán JM. Caesarean section: the paradox.
Lancet. 2006;368(9546):1472-3. DOI:10.1016/S0140-6736(06)69616-5
3. Appropriate technology for birth. Lancet. 1985;2(8452):436-7. DOI:10.1016/S0140-6736(85)92750-3
4. Barros AJ, Hirakata VN. Alternatives for logistic regression in cross-sectional studies: an empirical comparison of models that directly estimate the prevalence ratio. BMC Med Res Methodol. 2003;3:21. DOI:10.1186/1471-2288-3-21
5. Barros AJ, Victora CG. A nationwide wealth score based on the 2000 Brazilian demographic census.
Rev Saude Publica. 2005;39(4):523-9. DOI:10.1590/ S0034-89102005000400002
6. Barros AJ, Santos IS, Victora CG, Albernaz EP, Domingues MR, Timm IK, et al. Coorte de nascimentos de Pelotas, 2004: metodologia e descrição. Rev Saude Publica. 2006;40(3):402-13. DOI:10.1590/S0034-89102006000300007
7. Barros AJ, Santos IS, Matijasevich A, Araújo CL, Gigante DP, Menezes AM, et al. Methods used in the 1982, 1993, and 2004 birth cohort studies from Pelotas, Rio
Grande do Sul State, Brazil, and a description of the socioeconomic conditions of participants’ families.
Cad Saude Publica. 2008;24(Suppl 3):S371-80. DOI:10.1590/S0102-311X2008001500002
8. Barros AJ, Santos IS, Bertoldi AD. Can mothers rely on the Brazilian health system for their deliveries? An assessment of use of the public system and out-of-pocket expenditure in the 2004 Pelotas Birth Cohort Study, Brazil. BMC Health Serv Res. 2008;8:57. DOI:10.1186/1472-6963-8-57
9. Barros FC, Vaughan JP, Victora CG. Why so many caesarean sections? The need for a further policy change in Brazil. Health Policy Plan. 1986;1(1):19-29. DOI:10.1093;heapol/1.1.19
10. Barros FC, Vaughan JP, Victora CG, Huttly SR. Epidemic of caesarean sections in Brazil. Lancet. 1991;338(8760):167-9.
11. Béhague DP, Victora CG, Barros FC. Consumer demand for caesarean sections in Brazil: informed decision making, patient choice, or social inequality? A population based birth cohort study linking ethnographic and epidemiological methods.
BMJ. 2002;324(7343):942-5. DOI:10.1136/ bmj.324.7343.942
12. Bergholt T, Ostberg B, Legarth J, Weber T. Danish obstetricians’ personal preference and general attitude to elective cesarean section on maternal request: a nation-wide postal survey. Acta Obstet Gynecol
The 2004 Pelotas Birth Cohort was supported by the World Health Organization (HQ/04/072979), the Conselho Nacional de Desenvolvimento Científi co e Tecnológico (CNPq - Grant No. 476727/2003-0), the Fundação Nacional de Saúde (MS/ FNS 4589/04) and Pastoral da Criança.
The authors declare no confl icts of interests.
Scand. 2004;83(3):262-6. DOI:10.1111/j.0001-6349.2004.0312.x
13. Betrán AP, Merialdi M, Lauer JA, Bing-Shun W, Thomas J, Van Look P, et al. Rates of caesarean section: analysis of global, regional and national estimates. Paediatr Perinat Epidemiol. 2007;21(2):98-113. DOI:10.1111/ j.1365-3016.2007.00786.x
14. Brown 3rd HS. Lawsuit activity, defensive medicine, and small area variation: the case of Cesarean sections revisited. Health Econ Policy Law. 2007;2(Pt 3):285-96. DOI:10.1017/S1744133107004136
15. Coleman VH, Lawrence H, Schulkin J. Rising cesarean delivery rates: the impact of cesarean delivery on maternal request. Obstet Gynecol Surv. 2009;64(2):115-9. DOI:10.1097/ OGX.0b013e3181932dda
16. Dias MAB, Domingues RMSM, Pereira APE, Fonseca SC, Gama SGN, Theme Filha MM, et al. Trajetória das mulheres na defi nição pelo parto cesáreo: estudo de caso em duas unidades do sistema de saúde suplementar do estado do Rio de Janeiro. Cienc Saude Coletiva. 2008;13(5):1521-34. DOI:10.1590/S1413-81232008000500017
17. Faúndes A, Cecatti JG. Which policy for caesarian sections in Brazil? An analysis of trends and consequences. Health Policy Plan. 1993;8(1):33-42. DOI:10.1093/heapol/8.1.33
18. Fenwick J, Staff L, Gamble J, Creedy DK, Bayes S. Why do women request caesarean section in a normal, healthy fi rst pregnancy? Midwifery. 2010;26(4):394-400. DOI:10.1016/j.midw.2008.10.011
19. Hemminki E, Klemetti R, Gissler M. Cesarean section rates among health professionals in Finland, 1990-2006. Acta Obstet Gynecol Scand. 2009;88(10):1138-44. DOI:10.1080/00016340903214957
20. Minkoff H, Chervenak FA. Elective primary cesarean delivery. N Engl J Med. 2003;348(10):946-50. DOI:10.1056/NEJMsb022734
21. Poma PA. Effects of obstetrician characteristics on cesarean delivery rates: a community hospital experience. Am J Obstet Gynecol. 1999;180(6 Pt 1):1364-72.
22. QuickStats: rates of cesarean deliveries: selected countries, 2005. Birth. 2008;35(4):336-7. DOI:10.1111/j.1523-536X.2008.00272.x
23. Robson S, Carey A, Mishra R, Dear K. Elective caesarean delivery at maternal request: a preliminary study of motivations infl uencing women’s
decision-making. Aust N Z J Obstet Gynaecol. 2008;48(4):415-20. DOI:10.1111/j.1479-828X.2008.00867.x
24. Ronsmans C, Holtz S, Stanton C. Socioeconomic differentials in caesarean rates in developing countries: a retrospective analysis. Lancet. 2006;368(9546):1516-23. DOI:10.1016/S0140-6736(06)69639-6
25. Souza JP, Gülmezoglu A, Lumbiganon P, Laopaiboon M, Carroli G, Fawole B, et al. Caesarean section without medical indications is associated with an increased risk of adverse short-term maternal outcomes: the 2004-2008 WHO Global Survey on Maternal and Perinatal Health. BMC Med. 2010;8:71. DOI:10.1186/1741-7015-8-71
26. Tita AT, Landon MB, Spong CY, Lay Y, Leveno KJ, Varner MW, et al. Timing of elective repeat cesarean delivery at term and neonatal outcomes. N Engl J Med. 2009;360(2):111-20. DOI:10.1056/NEJMoa0803267
27. Usha Kiran TS, Jayawickrama NS. Who is responsible for the rising caesarean section rate? J Obstet Gynaecol. 2002;22(4):363-5. DOI:10.1080/01443610220141263
28. van Roosmalen J, van der Does CD. Caesarean birth rates worldwide: a search for determinants. Trop Geogr Med. 1995;47(1):19-22.
29. Villar J, Valladares E, Wojdyla D, Zavaleta N, Carroli G, Velazco A, et al. Caesarean delivery rates and pregnancy outcomes: the 2005 WHO global survey on maternal and perinatal health in Latin America. Lancet. 2006;367(9525):1819-29. DOI:10.1016/S0140-6736(06)68704-7
30. Villar J, Carroli G, Zavaleta N, Donner A, Wojdyla D, Faundes A, et al. Maternal and neonatal individual risks and benefi ts associated with caesarean delivery: multicentre prospective study. BMJ. 2007;335(7628):1025. DOI:10.1136/ bmj.39363.706956.55
31. Waniez P, Wurtz B, Brustlein V. L’abus du recours à la césarienne au Brésil: dimensions geographiques d’une aberration médicale. Sante. 2006;16(1):21-31.
32. Wax JR, Cartin A, Pinette MG, Blackstone J. Patient choice cesarean: an evidence-based review. Obstet Gynecol Surv. 2004;59(8):601-16.