*e-mail: [email protected]
1. Introduction
The Cr-Nb matrix is of frequent reference in anti-corrosive and glass forming applications1. Cr-Nb has also been associated with the facility to create the basis of solid solutions via mechanical alloying such as high-energy ball milling2 and both ends of the Cr-Nb phase diagram have been investigated to that extent. For instance, in the Cr end (Cr67Nb33) the formation of a metastable bcc phase has been achieved by mechanical alloying3, yielding a periodic structure which involved the presence of the Cr2Nb intermetallic. Typically, alloys which contain Cr2Nb are candidates for high-temperature structural applications4 which require oxidation resistance5 and for compositions up to approximately 37 at.% Nb, Cr2Nb is naturally derived as it is the only stable phase in the Cr-Nb phase diagram, crystallizing either into the cubic or the hexagonal lattice. However, the Nb-rich end of the Cr-Nb phase diagram may lead to both crystalline and amorphous phases, the structure of the latter mostly unexplored. For example, the possibility of formation of crystalline and amorphous structures by ball milling in the Nb end of the phase diagram has been investigated6 and in that work, formation of an amorphous phase from a CrxNb1-x ideal solution with x up to 80 at.% was lagged as possibility, on the basis of activation energies of the order of 0.03 eV; activation energies were calculated via a thermodynamic model which took into account grain growth, grain boundary migration and nucleation of new phases. Model predictions were conirmed by the synthesis of a Cr25Nb75 amorphous compound via mechanical alloying.
The atomic topology of a Cr25Nb75 compound produced in6 was determined by Reverse Monte Carlo (RMC) itting of the experimental structure factor derived from the X-ray
diffraction (XRD) dataset. This enabled the determination of partial pair distribution functions and the extraction of the local atomic order in these glasses. As the RMC supercell is intractable quantum mechanically due to its size, here we have employed the facility of selecting clusters on the basis of the radial distribution of coordination features; the latter constitutes a novel and subtlety which we have presented previously7,8. We, hence, utilize this facility in order to use the local atomic order of the Cr25Nb75 glass towards a discussion of the system’s electronic structure and stability.
2. Methodology
The reference system of this study was a Cr25Nb75 glass synthesized by ball milling in the work of Lima et al.6. For the sake of completeness we note that the process involved sealing a mixture of high-purity Cr and Nb powders (both powder particle sizes < 10 mm) in a cylindrical steel vial together with several steel balls (maintaining a ball-to-powder weight ratio of 6:1), under an argon blanket. Selected ball milling durations were 10, 25, 41 and 53 h and the steel vial was kept at ambient temperature by continuous ventilation. The resulting powders were analyzed via XRD at a Cu-Kα wavelength. Analysis of the as-milled powder after 53 h of milling was done by energy dispersive X-rays analysis and revealed Cr and Nb contents of 25 at.% and 75 at.%, respectively. The material’s structure factor was computed from the XRD pattern after corrections for polarization, absorption, and inelastic scattering. The number density and density of the amorphous alloy were calculated as 0.0516 atoms/Å3 and 7.1 g/ml, respectively6. The experimental structure factor was itted via a molecular RMC simulation of a supercell of 5000 atoms.
Short Range Order and Stability of a Mechanically Alloyed Cr
25Nb
75Glass Determined by Total Scattering and First Principles
Georgios S.E. Antipas*
School of Mining Engineering and Metallurgy, National Technical University of Athens, Zografou Campus, Athens 15780, Greece
Received: September 2, 2014; Revised: October 25, 2014
The atomic environment and stability of an amorphous Cr25Nb75 alloy was studied on the basis of average atomic coordination, average cluster number density as well as cluster radial distribution of these quantities based on Reverse Monte Carlo itting of multiple total scattering datasets. A number of the most representative clusters of the RMC supercell were isolated and relaxed via Density Functional Theory. Average coordination of both Cr and Nb atoms was similar, possibly due to the similarity of their covalent radii. Also, the histograms of average coordination of both species suggested binomial distributions, possibly relecting two separate modes of atomic bonding. Cr-centered clusters were found to be more cohesive than Nb-centered ones and overall cluster stability appeared to be correlated to minority Cr valence populations.
into uncontracted Slater-type orbitals (STO) comprising a triple-ζ (TZ) basis set with two sets of polarization functions (2P). Henceforth, the level of theory will be referred to as BLYP/TZ2P. Calculations were all-electron for both the Cr ([Ar]3d54s1), and Nb ([Kr]4d45s1) atomic structures, corrected for relativistic effects using the zero-order regular approximation (ZORA)11-13; the latter is a requirement raised by the presence of Nb. Relaxation simulations were followed by single point and frequency calculations for all structures to ensure full self-consistent ield (SCF) convergence; however, some non-aufbau occupations did occur and these simulations were discarded. All DFT calculations were performed with the Amsterdam density functional (ADF) program14.
Clusters isolated from the RMC supercell do not correspond to any particular level of theory; they, hence, had to initially be relaxed into the BLYP/TZ2P level. Based on our previous studies of non-ferrous amorphous cluster relaxation7,8,15, we deemed that relaxation of the metal center while keeping the irst coordination neighbours frozen was suficient and it also provided good g(r) agreement with the un-relaxed geometries, both for charged and charge-neutral clusters. Hence, all results shown henceforth are based on DFT relaxed centers within frozen nearest neighbours, inclusive of the second coordination shell.
3. Results and Discussion
3.1. Pair distribution functions and average
coordination
The partial pair distribution functions, g(r), on the basis of the RMC supercell are shown in Figure 1, while for a more comprehensive assessment of the quality of the RMC solution, the reader is referred to the paper by Lima et al.6. Principal short-range ordering was owing to a combination of Nb–Nb and Cr–Nb interactions, as indicated by the presence of both partials in the irst coordination shell. As mentioned in the work by Lima et al.6, the average interatomic distances estimated by RMC were: rCr-Cr = 2.88 Å, rCr-Nb = 2.91 Å and rNb-Nb = 2.94 Å. All of the three partials were expressed within the irst coordination shell which peaked at 2.9 Å and extended up to 3.9 Å. The similarity in the contributions of both species into the irst shell might be attributed to their comparable covalent radii. Average coordination of both species by Cr and Nb atoms was approximately 3 and 12, respectively and this feature suggested that the two elements tended to bond very similarly. In fact, in accordance with the amorphous phase, cubic and hexagonal Cr2Nb phases have been known
to have six closest neighbours at interatomic distances of 2.89 Å; it is thus possible that, e.g., distorted such polyhedra may provide the basis of Cr-Nb contributions into the irst coordination peak upon cooling from the melt. Hence, the structure is characteristically dense.
3.2. Atomic environment statistics
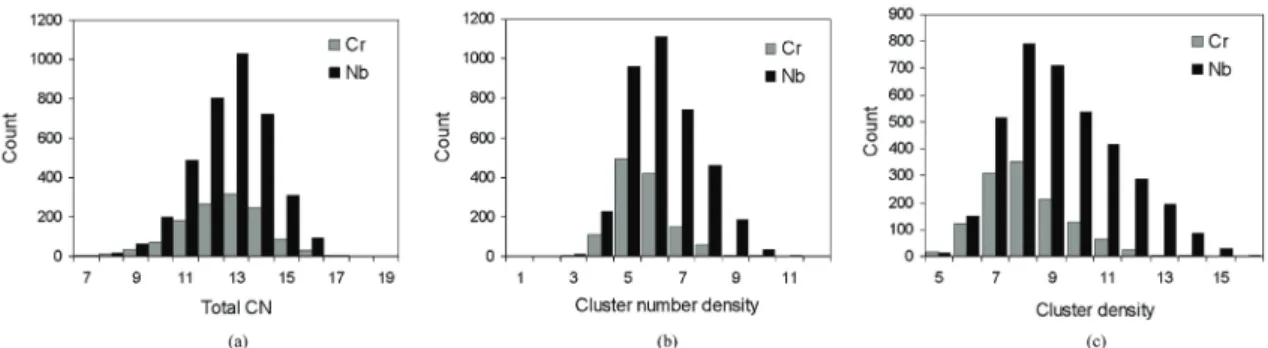
Histograms of atom coordination number, cluster number density and cluster mass density of atoms in the irst coordination shell are shown in Figure 2. Average coordination of the Cr and Nb species was 12.571 and 12.705, respectively (see Figure 2a). A feature that raised interest was regarding the shapes of both Figures 2b and 2c which were suggestive of binomial or binomial-like distributions. More speciically, cluster number density (Figure 2b) appeared to be centered on two distinct peaks, of 0.05 and 0.06 atoms/Å3. The same feature was valid for the Nb distribution, which was centered on 0.06 and 0.07 atoms/Å3. The indication of a binomial trend was more pronounced in the case of cluster density (Figure 2c); Both Cr and Nb could be argued as comprising two overlapping distributions, peaking at 8 and 9 g/ml, respectively. In fact, this trend was also noticeable in Figure 2a, where two separate peaks, at 13 and 14, might be tentatively assigned to Cr. Nb coordination distribution, on the other hand, did not appear as decidedly binomial. The feature of binomially distributed atomic environment statistics was also evident in our previous work on bulk metallic glasses7,8,15.
Cluster radial distributions were constructed by irst considering each of the Cr and Nb centers surrounded by irst coordination shell atoms. Then, each center’s average
and partial coordination numbers as well as the cluster’s number density and average density were binned based on the metal center’s distance from the center of the RMC supercell. The bin values were not normalized by the volume of the spherical shell corresponding to each bin so as to avoid creating a bias towards coordination features close to the RMC box center. As a result, the most intense features were located at distances beyond 10 Å of the RMC box center. The radial variation of metal center coordination number and cluster number density is shown in Figure 3.
3.3. Cluster selection
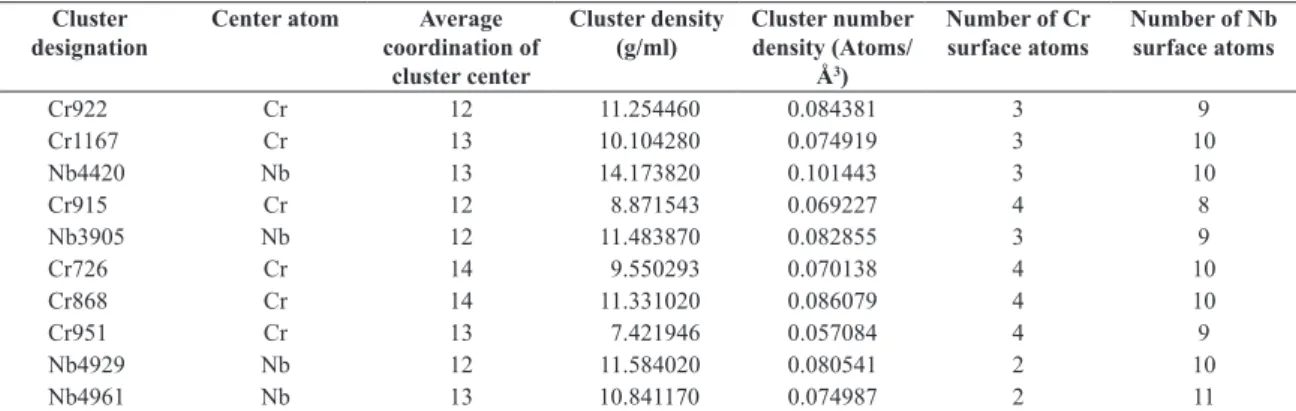
The highest-intensity feature of Cr-centered clusters was found to lie in the region of 20-22 Å and involved average cluster coordinations of between 12 and 14 (see Figure 3a). These moieties also had average number densities in the region of 0.05-0.06 atoms/Å3 (rounded up to two decimal points – see Figure 3c). Also, as seen in Figure 3b, the Cr clusters in this region were coordinated by roughly two to four Cr surface atoms. Interestingly, Cr surface atom coordination was the same for Nb-centered clusters (see Figure 3e) in spite the lower content of Cr atoms in the system. This probably serves as an indication of the increased collaboration between Cr-Cr and Cr-Nb. The most intense features of the radial distribution of cluster number density (Figures 3c and 3f) followed suite from coordination and were also observed within the region of 20-22 Å. On the basis of average atomic coordination, average cluster number density and of the radial distribution of these quantities we selected a number of clusters as representative of the RMC supercell.
Details of the selected clusters are listed in Table 1. The BLYP/TZ2P lowest energy state of each of the clusters selected was determined as the most negative value from the plot of cluster binding energy vs. spin polarization, while cluster charges varied in the range of –1 to 1.
3.4. Cluster relaxation
The variation of cluster binding energy over a wide polarization range (0 to 15) is shown in Figure 4. Cluster relaxation under charge neutrality did not, generally, yield the lowest of the energy states. In our previous studies of covalent glasses it was shown that the ground state of isolated metallic clusters was best described by negatively
charged moieties of rather high spin multiplicities (typically up to 12)7,8,15. A review of Figure 4 conirms that this is also true for the Cr25Nb75 system. More precisely, cluster ground states were always associated with a formal charge of –1 and spin compensations that ranged from 6 to 15. For the sake of completeness we have opted to report on both the negatively charged as well as the charge neutral moieties for each cluster. In both the charged and charge neutral geometries, the difference in stereochemistry between the most cohesive and the least cohesive clusters (designated as Cr922 and Nb4961, respectively) was due to the same feature: transition from Cr922 to Nb4961 involved a decrease in Cr coordination (from 3 to 2) and an increase in Nb coordination (from 9 to 11) of the metal centers and this coordination shift was instrumental to cluster stability in a wider context.
To illustrate this further for the case of charged and charge neutral lowest energy states respectively, we introduce the plots of cluster binding energy vs. cluster density (Figures 5a and 5d) and cluster binding energy vs. cluster center coordination (Figures 5b and 5e). Cluster binding energy generally increased with increasing cluster density and one would expect that, given the species’ similarity in their coordination requirements, this feature would be owing to both the Cr and Nb centers. However, this was not the case. Increased cluster cohesion was mediated exclusively by the solute-centered clusters upon increase of the number of coordinated atoms regardless of species; Nb-centered clusters appeared to behave in exactly the opposite manner and this solute-solvent competitive effect was in accordance with our own previous observations regarding Ge-Se glass clusters8.
3.5. Cluster energy decomposition and molecular
orbital interactions
Cluster binding energy decomposition into its constituent Pauli, electrostatic and orbital interaction parts is presented in Figures 5c and 5f for the case of charged and charged neutral clusters. Binding energy values corresponding to Figures 5c and 5f are listed in Table 2. From the graphs some consistent observations can be made, focusing on coarse-grained qualitative characteristics. Cluster stability (based on binding energy) was largely the same for both charges.
Figure 3. Surface plots of the radial distribution of coordination and number density for Cr- and Nb- centered clusters (the radial direction is measured from the origin of the RMC simulation box and is the vertical axis in units of Å). Panels (a) and (d) depict cluster average coordination, (b) and (e) portray cluster coordination by the matrix element, while (c) and (f) represent the variation of cluster number density for Cr- and Nb-centered clusters, respectively. Horizontal axis notation is as follows: CN: average coordination number, matrix CN:
average coordination of the cluster center by Cr (‘matrix’ refers to the irst atomic species in the chemical formula, i.e. Cr, by convention),
ND: number density (atoms/Å3) and D: density (g/ml).
Table 1. A list of the most characteristic clusters of the Cr25Nb75 system selected on the basis of the radial distributions of cluster center
average coordination, cluster center coordination by the matrix species (conventionally taken to be the irst element appearing in the
formula unit, i.e. Cr) and cluster number density. Cluster
designation
Center atom Average
coordination of cluster center
Cluster density (g/ml)
Cluster number density (Atoms/
Å3)
Number of Cr surface atoms
Number of Nb surface atoms
Cr922 Cr 12 11.254460 0.084381 3 9
Cr1167 Cr 13 10.104280 0.074919 3 10
Nb4420 Nb 13 14.173820 0.101443 3 10
Cr915 Cr 12 8.871543 0.069227 4 8
Nb3905 Nb 12 11.483870 0.082855 3 9
Cr726 Cr 14 9.550293 0.070138 4 10
Cr868 Cr 14 11.331020 0.086079 4 10
Cr951 Cr 13 7.421946 0.057084 4 9
Nb4929 Nb 12 11.584020 0.080541 2 10
Figure 4. Variation of cluster binding energy vs. spin polarization for the clusters listed inTable 2. Legend notation is as follows: cluster name (corresponding to the designation listed inTable 2) followed by the cluster’s formal charge; the later is represented by the letter ‘z’ and either of –1, 0 or 1, for negatively charged, charge neutral and positively charged clusters, respectively.
Table 2. Cluster spin polarization, number of electrons, Ne, and binding energy decomposition.
Cluster designation
Cluster charge Cluster spin
polarization
Ne Pauli (a.u.) Electrostatic
(a.u.)
Orbital Interactions
(a.u.)
Cr922 z-1 s10 –1 10 466 14.469 –7.018 –14.236
Cr1167 z-1 s15 –1 15 507 15.445 –7.436 –14.736
Nb4420 z-1 s6 –1 6 524 19.938 –9.438 –17.178
Cr915 z-1 s11 –1 11 449 12.591 –6.163 –13.086
Nb3905 z-1 s9 –1 9 483 16.369 –7.834 –15.165
Cr726 z-1 s10 –1 10 548 12.713 –6.200 –13.129
Cr868 z0 s0 0 0 530 16.310 –7.803 –15.101
Cr951 z-1 s8 –1 8 490 11.457 –5.588 –12.361
Nb4929 z-1 s8 –1 8 500 15.760 –7.604 –14.626
Nb4961 z-1 s9 –1 9 541 15.397 –7.461 –14.404
Cr922 z0 s9 0 9 466 14.469 –7.018 –14.114
Cr868 z0 s0 0 0 530 16.310 –7.803 –15.101
Nb4420 z0 s5 0 5 524 19.938 –9.438 –17.072
Nb3905 z0 s8 0 8 483 16.369 –7.834 –15.049
Cr726 z0 s11 0 11 548 12.713 –6.200 –13.017
Cr915 z0 s8 0 8 449 12.591 –6.163 –12.930
Cr1167 z0 s0 0 0 507 15.445 –7.436 –14.456
Cr951 z0 s9 0 9 490 11.457 –5.588 –12.263
Nb4929 z0 s5 0 5 500 15.760 –7.604 –14.521
of valence populations in both the lowest energy charged and charge neutral cases, a fact also conirmed by the similarity in molecular orbital-related energies in Figures 5c and 5f. Therefore, a side-by-side comparison of the charged and charge neutral moieties of Figure 6 would not offer insight towards the fundamentals of cluster stability. However, both charge states showed common features, beginning with increased contributions of Nb-t2g populations which transcended cluster stability over the whole spectrum of binding energies shown. Moreover, Nb-eg cooperation with Nb-t2g was always intense in both spins.
Cr majority population contributions were also high (typically 30% of the MO density) across the range of clusters studies, reaching up to 80% of MO density in certain instances; however, there was no detectable trend between MO energy, Cr α-spin contributions and cluster stability. However, a relation between cluster stability and β-spin Cr populations, particularly of Cr-eg character, might exist. As shown in Figure 6. a comparison of minority populations, e.g. between the least and most stable clusters (Nb4961 and Cr922 respectively) reveals that in the latter MO interactions between valence states of both atomic species are more pronounced, particularly in energies below –0.15 a.u.
2. The histograms of average elemental coordination and average cluster density for both atomic species revealed a tendency for binomial distributions. The latter may reflect two separate modes of atomic bonding or may be a systematic bias of the RMC itting. More work needs to be carried out to account for this effect.
3. Cluster stability was characterized by a) an inverse relationship between Pauli repulsion and electrostatic interactions and b) a covariance between and electrostatic and orbital interactions. Also, cluster cohesion was affected by solute-solvent interactions. More precisely, Cr centers were more stable than Nb centers and their stability increased with coordination. 4. A tentative case was made for the existence of a
relation between cluster stability and minority Cr populations.
Acknowledgements
The provision of the RMC coniguration iles by Dr J.C. de Lima is gratefully acknowledged.
References
1. Nagase T, Ueda M and Umakoshi Y. Preparation of Ni–Nb-based metallic glass wires by arc-melt-type melt-extraction method. Journal of Alloys and Compounds. 2009; 485(1-2):304-312. http://dx.doi.org/10.1016/j.jallcom.2009.05.122.
2. Castro JFR, Santos SF, Ishikawa T and Botta WJ. Processing
and microstructural characterization of a Ti-Cr-Nb alloy synthesized by high-energy ball-milling. Materials Research. 2012; 15(5):753-756. http://dx.doi.org/10.1590/S1516-14392012005000061.
3. Thoma DJ, Perepezko JH, Plantz DH and Schwarz RB.
Metastable b.c.c. phase formation in the Nb-Cr system.
Materials Science and Engineering A. 1994; 179-180:176-180.
http://dx.doi.org/10.1016/0921-5093(94)90188-0.
4. Takeyama M and Liu CT. Microstructure and mechanical properties of Laves-phase alloys based on Cr2Nb. Materials
Science and Engineering A. 1991; 132(0):61-66. http://dx.doi.
org/10.1016/0921-5093(91)90361-P.
5. Goldschmidt HJ and Brand JA. The constitution of the
chromium-niobium-molybdenum system. Journal of the
Less Common Metals. 1961; 3(1):44-61. http://dx.doi.
org/10.1016/0022-5088(61)90042-X.
6. Lima JC, Almeida TO, Jerônimo AR, Souza SM, Campos
CEM and Grandi TA. Reverse Monte Carlo simulations of an amorphous Cr25Nb75 alloy produced by mechanical alloying.
Journal of Non-Crystalline Solids. 2006; 352(2):109-115.
http://dx.doi.org/10.1016/j.jnoncrysol.2005.11.020.
7. Antipas GSE. Molecular orbital interactions in glass-forming Zr70Cu30 liquid quasicrystals. Journal of Alloys and
Compounds. 2013; 578:565-570. http://dx.doi.org/10.1016/j.
jallcom.2013.06.179.
8. Antipas GSE, Mangiorou E and Hristoforou E. Solute-solvent interactions and atomic cohesion in GeSe4 and GeSe4In5 metallic glasses. Materials Research Express. 2014; 1(1):015202. http://dx.doi.org/10.1088/2053-1591/1/1/015202. 9. Becke AD. Density-functional exchange-energy approximation
with correct asymptotic behavior. Physical Review A. 1988; 38(6):3098-3100. http://dx.doi.org/10.1103/ PhysRevA.38.3098. PMid:9900728
10. Lee C, Yang W and Parr RG. Development of the Colle-Salvetti correlation-energy formula into a functional of the electron density. Physical Review B: Condensed Matter and Materials
Physics. 1988; 37(2):785-789. http://dx.doi.org/10.1103/
PhysRevB.37.785. PMid:9944570
11. van Lenthe E, Baerends EJ and Snijders JG. Relativistic
total energy using regular approximations. The Journal of
Chemical Physics. 1994; 101(11):9783-9792. http://dx.doi.
org/10.1063/1.467943.
12. Belanzoni P, van Lenthe E and Baerends EJ. An evaluation
in small metal compounds. The Journal of Chemical Physics. 2001; 114(10):4421. http://dx.doi.org/10.1063/1.1345509.
13. Van Lenthe E, van der Avoird A and Wormer PES. Density functional calculations of molecular hyperfine interactions in the zero order regular approximation for relativistic effects.
The Journal of Chemical Physics. 1998; 108(12):4783. http://
dx.doi.org/10.1063/1.475889.
14. Scientific Computing & Modelling – SCM. Amsterdam Density
Functional program. Theoretical Chemistry. Amsterdam: Vrije
Universiteit; 2010.
15. Antipas GSE and Mangiorou E. Atomic topology and electronic structure of a melt-spun Al92U8 metallic glass. Computational
and Theoretical Chemistry. 2014; 1036:16-21. http://dx.doi.