RESUMO
Trata-se de um arigo teórico acerca do modelo de avaliação de qualidade em serviços de saúde proposto por Parasura -man, Zheitaml e Berry, a im de mensurar o grau de saisfação de usuários. Tal mo -delo baseia-se na análise de expectaivas e percepções de usuários de serviços de saúde, por meio de cinco dimensões: tan -gibilidade, coniabilidade, responsividade, garania e empaia. Da diferença entre o que é esperado pelo usuário e o serviço oferecido derivam os gaps, ou lacunas, que
podem ser o principal obstáculo para que os usuários percebam a prestação desses serviços com qualidade. Observou-se que a uilização da escala psicométrica deno -minada Service Quality (SERVQUAL), em alguns estudos sobre saisfação, obteve resultados bastante favoráveis nas insitui -ções em que foi empregado. Evidenciou-se a necessidade de aprimorar os modelos de avaliação existentes, bem como a impor -tância de medir a saisfação dos usuários nas insituições de saúde.
DESCRITORES
Qualidade da assistência à saúde Avaliação de Serviços de Saúde Saisfação do paciente Saisfação dos consumidores
The use of the quality model of
Parasuraman, Zeithaml and Berry in
health services
R
eflection
ABSTRACT
This is an aricle about the theoreical model for assessing quality in health ser -vices proposed by Parasuraman, Zheitaml and Berry, in order to measure the de -gree of saisfacion of users. This model is based on the analysis of expectaions and percepions of users of health services, by means of ive dimensions: tangibility, reliability, responsiveness, assurance and empathy. From the diference between what is expected by the user and the ser -vice ofered, gaps or shortcomings are derived that may be the main obstacle for users to perceive the provision of such services with quality. It was observed that the use of the psychometric scale called Service Quality (SERVQUAL) in some stud -ies about saisfacion, obtained very fa -vorable results in the insituions in which it was employed. The analysis revealed the need to improve the exising models of evaluaion, as well as the importance of measuring user saisfacion in health insituions.
DESCRIPTORS
Quality of health care Health Services Evaluaion Paient saisfacion Consumer saisfacion
RESUMEN
Arículo teórico sobre el modelo de eva -luación de la calidad en los servicios de salud, propuesto por Parasuraman, Berry y Zheitaml con el in de medir el grado de sa -isfacción de los usuarios. Tal modelo está basado en el análisis de las expectaivas y percepciones de los usuarios de los servi -cios de salud, y mide cinco dimensiones: la coniabilidad, la sensibilidad, la intangibili -dad, la garanía y la empaía. De la diferen -cia entre lo que el usuario espera y el ser -vicio ofrece, derivan las lagunas, o vacíos,
que pueden ser el principal obstáculo para que los usuarios perciban la prestación de esos servicios con calidad. Se observó que la uilización de la escala psicométrica, lla -mada Service Qualiy (SERVQUAL), uilizada
en algunos estudios de saisfacción, obtuvo resultados bastante favorables en las insi -tuciones en que fue uilizado. Se evidenció la necesidad de mejorar los modelos de evaluación existentes, así como la impor -tancia de medir la saisfacción de los usua -rios en las insituciones de salud.
DESCRIPTORES
Calidad de la atención de salud Evaluación de Servicios de Salud Saisfacción del paciente Saisfacción de los consumidores
Mileide Morais Pena1, Edenise Maria Santos da Silva2, Daisy Maria Rizatto Tronchin3, Marta Maria Melleiro4
O EMPREGO DO MODELO DE QUALIDADE DE PARASURAMAN, ZEITHAML E BERRY EM SERVIÇOS DE SAÚDE
EL EMPLEO DEL MODELO DE CALIDAD DE PARASURAMAN, ZEITHAML Y BERRY EN LOS SERVICIOS DE SALUD
1 Doctoral student in nursing, School of Nursing, University of São Paulo. São Paulo, SP, Brazil. [email protected] 2 Master’s in Nursing, School of
Nursing, Universidade de São Paulo. São Paulo, SP, Brazil. [email protected] 3 Associate Professor, School of Nursing, Universidade de São Paulo.
INTRODUCTION
Quality models emerged in the late 1970s, as a result of numerous studies proposing concepts, operaionalizaions and systemaizaion for quality services. Already the subjec
-ivity present in the percepion of quality is being incorpora
-ted through diferent approaches and their consequences. The irst essays on the topic of quality in service su
-ggested staring from comparisons between what users considered that they should be ofered by the provider and what he actually ofered(1). In this direcion, quality
service can be considered the raio of the level of service efeciveness and expectaions of the user. Thus, to pro
-mote quality service means to meet the needs and expec
-taions of a user in an efecive manner(1).
To evaluate a service is more complex than to evaluate a product, because the product is tangible and its defects can be detected, its funcioning assessed and its durability compared. Conversely, service is irst purchased and then it is produced and consumed simultaneously, and then the possible nonconformiies are produced and experien
-ced, characterizing their inseparability(2).
Services are intangible and heteroge
-neous, at the same ime being judged by the performance and the experience of those who use them, with the possibility of interpretaion and diferent judgments, according to the provider and the user in quesion. Besides the intangibility, servi
-ces present three other characterisics that afect program development: inseparability, variability and perishability(3).
The intangibility is characterized by the activities which cannot be seen, felt, heard or proven before they are acquired. The inseparability translates to the simultaneity in which services are produced and con
-sumed. The professionals responsible for providing the service are part of it and interaction with users is a spe
-cial characteristic of services. The variability concerns to whom, where and when services are provided. The perishability reinforces that services cannot be stored in advance, so it is necessary that strategies are esta
-blished for the balance between existing demand and provision of services(3).
The objecive of this study was to relect on the asses
-sment model of service quality of Parasuraman, Zheitaml and Berry, and to demonstrate its applicability in the eva
-luaion of health services, in order to measure the degree of user saisfacion.
The evaluaion of the model of service quality of Parasuraman, Zheitaml and Berry
In order to understand how users perceived and as
-sessed the quality of services, a study was developed
in 1985 involving twelve focus groups, three in each of the four different services investigated - retail banking, credit cards, securities brokerage, and repairs and maintenance. Based on common perceptions among the groups, the authors formally defined service qua
-lity as the degree and type of discrepancy between the perceptions and expectations of users, suggesting that they all, in general, employed similar aspects of service by which quality could be assessed(4).
The results obtained from these focus groups con
-firmed that users were influenced by the dimensions of the process and not only by the results of the eva
-luation of service quality. In this study, the pattern of responses revealed ten evaluative criteria by which the user can evaluate, regardless of the service inves
-tigated, namely: tangibility: the physical appearance
of the facilities, equipment, framework for employees and normative materials; reliability: ability to perform
the promised service dependably and accurately; res-ponsiveness: the ability to help users promptly; com-petence: appropriation of the abilities and knowledge
required to perform services; cordiality: politeness,
respect, consideration and friendliness of the employees; credibility: trust, truth and
honesty; safety: absence of danger, risk
or doubt; accessibility: proximity and em
-pathic contact; communication: keeping
users informed in appropriate language;
and, comprehension: endeavoring to un
-derstand the user and his needs.
By submitting the results to statisti
-cal analysis to determine the interrela
-tionships between these dimensions, three of them remained intact: tangibility, reliability and responsive
-ness. The seven remaining dimensions were included in two others: assurance and empathy(4). The analysis
of these five dimensions demonstrated that users were using them as criteria for judging the quality of service. The dimensions are not mutually exclusive, yet provide an important framework for understanding the expec
-tations of users, and issues that delineate the service from the point of view of those who will judge it(1).
Ater this reinement, the following deiniions were used:
• Tangibility: concerns the physical faciliies, equip -ment, personnel and materials that can be perceived by
the ive human senses;
• Reliability: translated into the ability of the supplier
to execute the service in a safe and eicient manner. It de
-picts the consistent performance, free of non-compliance, in which the user can trust. The supplier must comply with what was promised, without the need for rework.
• Responsiveness: refers to the availability of the
provider to atend voluntarily to users, providing a
...quality service can be considered the ratio
of the level of service effectiveness and expectations of the
service in an atenive manner, with precision and spe
-ed of response. It concerns the availability of employe
-es of the insituion to assist users and provide the ser
-vice promptly;
• Assurance: it is ideniied as the courtesy, knowledge
of employees and their ability to convey trust;
• Empathy: related to whether the organizaion cares
for the user and assists him in an individualized manner, referring to the ability to demonstrate interest and per
-sonal atenion. Empathy includes accessibility, sensiivity and efort in understanding the needs of users.
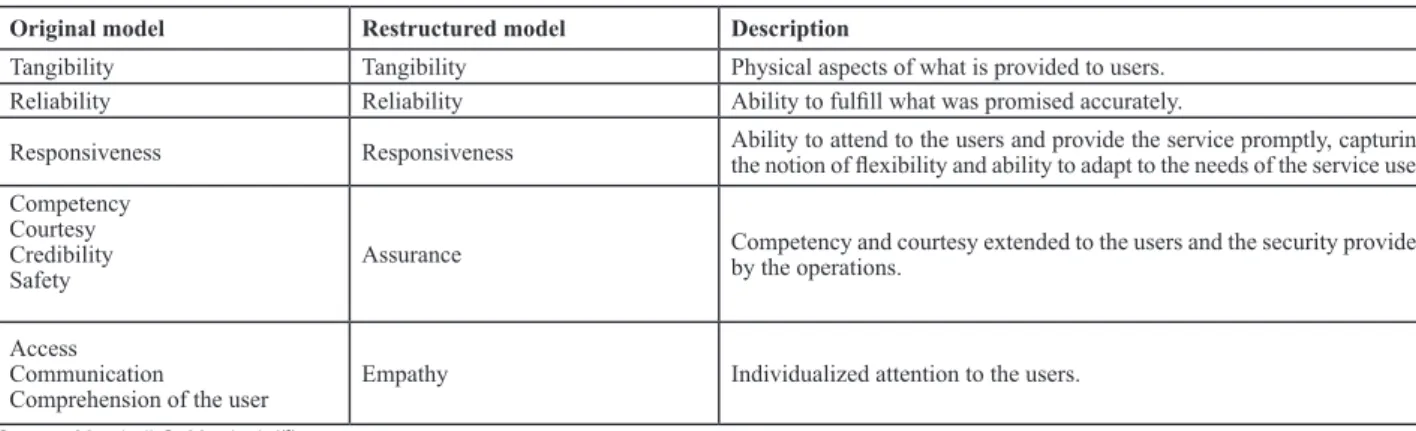
Chart 1 presents a comparison between the original mo
-del and the restructured mo-del of the quality dimensions.
Chart 1 – Original model compared to the restructured model of the ive dimensions of Parasuraman, Zeithaml & Berry Original model Restructured model Description
Tangibility Tangibility Physical aspects of what is provided to users. Reliability Reliability Ability to fulill what was promised accurately.
Responsiveness Responsiveness Ability to attend to the users and provide the service promptly, capturing the notion of lexibility and ability to adapt to the needs of the service user. Competency
Courtesy Credibility
Safety Assurance
Competency and courtesy extended to the users and the security provided by the operations.
Access Communication
Comprehension of the user
Empathy Individualized attention to the users.
Source: Marshall G, Murdoch I(6)
Investigations have confirmed that reliability is the most important dimension, and tangibility is less rele
-vant to the quality of service from the perception of the
user(4). In view of this, some dimensions may be more
accentuated than others, depending on the type of ser
-vice provided.
The result of the analysis as a whole verified that there is a set of key discrepancies or gaps, consisting of the differences between users’ expectations and what is actually offered. These gaps can be the main obstacle for users to perceive the provision of such services as high-quality(5).
When percepions are higher than expectaions, the gaps are narrow and there are high levels of saisfacion, considering the excellent service and quality. Five corpo
-rate gaps are emphasized that are usually encountered between the expectaions and percepions of users(5-6).
These are:
• Gap 1: refers to consumer expectaions and the per
-cepion of management towards them. The service provi
-ders do not always un-derstand what requirements conno
-te excellence of quality for consumers;
• Gap 2: is the speciicaion of the quality of the servi
-ces deined by the translaion of percepions that mana
-gement has of the expectaions of users. This discrepancy is due to the lack of speciicaion of the ofer, adjusted to the wishes of the consumers;
• Gap 3: relates to the actual performance of service in
the face of previously established speciicaions;
• Gap 4: relates to the service actually provided and
external communicaions (service speciicaions announ
-ced in the media or other communicaion channels); • Gap 5: This was established as a funcion of the four
previous shortcomings, namely
Gap 5 = f [gap 1, gap 2, gap 3, gap 4].
In summary, one can consider the following deiniions for the gaps:
Gap 1- Not knowing what users want to receive; Gap 2- Not selecing the right design of the service and
established standards;
Gap 3- Not delivering the standard service; Gap 4- Not marrying performance with promises; Gap 5- Established according to the four previous gaps; Gap 5 = f [gap 1, gap 2, gap 3, gap 4].
Figure 1 illustrates the shortcomings or gaps in service quality.
To perform the measurement of user saisfacion it is necessary to focus on the expectaions and percepions that the user has about the ofered services(5). The con
-cept of perceived quality, used both for services as well as for products, has been understood as superiority or excellence, while the concept of service quality is more abstract and intangible. In the absence of objecive me
-asures, it may be considered appropriate that the evalu
Interpersonal
communicaion
Personal
necessiies Past experience
Expectaions of
Service
Percepion of service
Service delivery
(including contacts before and ater) communicaion External
with the users
Translaions of the percepions in speciicaions of quality of the service
Management percepion of user expectaions
GAP 4 GAP 3
GAP 2
GAP 5
USER
MANAGER
Figure 1 – GAP Model of Service Quality
Service quality: a psychometric scale of the dimension of quality and its use in health services
A psychometric scale of the dimensions of quality cal
-led Service Quality (SERVQUAL) was the irst atempt to operaionalize the construct of user saisfacion. The sca
-le was developed with the assistance of the Markeing Science Insitute (MSI), whose purpose was to provide a tool to derive funcional quality, applied to numerous ser
-vice providers(8).
The SERVQUAL instrument is composed of 44 ques
-ions, divided into two sec-ions, the irst containing 22 airmaions about user expectaions regarding the servi
-ce, and the second with 22 airmaions related to user percepions within the speciic categories of service(6).
The users must supply two scores for each atribu
-te, one relecing their expectaions of the level of ser
-vice that was to be delivered by the insituions and the other showing their percepions of the service delivered by a speciic unit within that insituion. The scores range from totally disagree to totally agree(1-7). The diferences
obtained between expectaion and percepion scores can be used to improve the quality of services.
Developed in 1988, ater two decades of use, the SER
-VQUAL scale has been found to be eicient for measuring percepions and expectaions of the users about service quality(6), including in health services.
In the health area, several authors have employed the aforementioned scale, consolidating it as an impor
-tant tool to get to know the expectations and needs of users as well as to support decision making in the institutions. In Brazil, several studies have proposed it for gauging satisfaction levels of users and managers of health services(2, 9-13).
The SERVQUAL scale was validated in Brazil, invol
-ving both demographic data such as users’ perception about the care received, and building on the five di
-mensions, with all variables grouped into 35 attributes of care(9). This framework, as previously mentioned, has
When researching user saisfacion at the University Hospital of USP related to the atributes of care, and com
-paring it to the percepion that the management team had of saisfacion, there was a big diference between what the user ideniied as quality and what the manager con
-sidered to be quality, demonstraing divergences between the two percepions. The rate of saisfacion manifested by users was higher than that perceived by the managers and they, in turn, had a higher expectaion than the actual performance of the operaional area. As to the atributes of the care, it became clear that the user considered the iniial care and treatment outcome as the important at
-tributes for his saisfacion, portrayed predominantly in the dimensions of empathy and reliability. The study also ideniied that the quality of services of the nursing team was a posiive diference in the insituion(9).
The quality of an ambulatory ophthalmological ser
-vice provided to users of the Naional Health System in the city of Belo Horizonte (MG) was evaluated using two structured quesionnaires, adapted from the modiied SERVQUAL scale. A slight general dissaisfacion was de
-tected regarding the quality of care, and safety and re
-liability were the atributes of greatest importance; the authors concluded there was a need for planning and implementaion of acions to improve this service(10).
The quality of health services in the public and private networks in Ribeirão Preto-SP was analyzed focusing on analysis of the ime for the medical consultaion. The stu
-dy ideniied fragility in the system of scheduling appoint
-ments, especially in public insituions, and delays in wai
-ing for medical care. Insituions that presented shorter imes of medical consultaion also received a lower score on the quality assessment in relaion to others(11).
The expectaions and percepions of chronic renal paients, in relaion to the dialysis treatment programs, were measured using the SERVQUAL scale, in the city of Taichung, in Taiwan, and demonstrated that elderly users had a level of percepion of the service that was lower than younger people. With regard to educaion, users wi
-th higher levels of educaion demonstrated lower expec
-taions and percepions in relaionship to the programs. A posiive correlaion was present between expectaions and percepions, loyalty and percepions of the service; however there was no posiive correlaion between ex
-pectaion and loyalty(12).
Levels of saisfacion in a private hospital the city of São Paulo were analyzed and the atributes that reached the hi
-ghest levels of saisfacion corresponded to educaion and commitment of medical and nursing staf, the explanaions and guidance about the health problem of the user, respect for privacy and guidance for coninuing care ater hospital discharge. Assurance and reliability were the dimensions that most inluenced saisfacion, followed by responsiveness and empathy. There was also the need to adopt strategies in the nutriion service and in the iniial care of the users(2).
Another study employing the SERVQUAL was con
-ducted at a university hospital in the interior of the state of São Paulo, with the objecives of verifying the levels of user saisfacion and knowing the factors involved in their saisfacion . Findings indicated that the dimen
-sions of reliability and assurance represented the atri
-butes with the highest degree of saisfacion and that the dimensions of responsiveness and empathy were the atributes with lower levels of saisfacion(13).
In the cited studies, an elevated level of user saisfac
-ion was observed in rela-ionship to the respecive health services. The authors menioned above iterated the im
-portance of health services couning on assessment tools that enabled managers to plan improvements, and indica
-ted the need for enhancement of such instruments. Despite the recogniion that every theoreical model is always parial and approximate, it is necessary to recogni
-ze the relevance of the criicism that indicates important theoreical and conceptual inconsistencies within the area of user saisfacion studies. Finally, the establishment of a consensus of experts should be encouraged, to seek a vali
-daion for the concept of user saisfacion and operaionali
-zaion for its measurement(14).
Consequently, on the opion of a paricular model of evaluaion, it is necessary to remember that, depending on the type of assessment to be developed, one can choose or adapt one or more approaches in the design process. Ho
-wever, the success of the evaluaion process is condiional on efecive planning that meets the speciics of each orga
-nizaion and the context in which it operates.
FINAL CONSIDERATIONS
The absence of objective measures to assess the quality of services increases the degree of complexity in relation to its assessment. There are several models proposed in the literature to evaluate such an attribute, during and after the experience of acquisition, ranging in numerical representation, principle characteristics and conclusions about their applicability.
In this article, the employment of an evaluation mo
-del developed in the context of marketing and applied to the area of health demonstrates the growing concern of health institutions and professionals themselves re
-garding user satisfaction. Furthermore, it reinforces the possibility of using existing models, adapting them to the the health segment, in order to obtain a model that most closely approximates the reality of these services.
The monitoring of the quality of services, accor
-ding to the various existing models, not only permits the planning of assertive, highly effective strategies of intervention, but also the monitoring of the responses to these actions, contributing to scientific and techno
REFERENCES
1. Zeithaml V, Parasuraman A. Service quality. Cambridge: Ma
-rkeing Science Insitute; 1990.
2. Cruz WBS, Melleiro MM. Assessment levels of the user’s sa
-isfacion in a private hospital. Rev Esc Enferm USP [Internet]. 2010 [cited 2012 Sept 17];44(1):147-53. Available from: ht
-tp://www.scielo.br/pdf/reeusp/v44n1/en_a21v44n1.pdf
3. Kloter P, Keller KL. Administração de markeing. São Paulo: Pe
-arson Prenice Hall; 2006.
4. Parasuraman A, Zheitmal VA, Berry LL. SERVQUAL: a concep
-tual model of service quality and its implicaions for future research. J Mark. 1985;49(1):41-50.
5. Parasuraman A, Berry LL, Zheitmal VA. Reinement and re
-assessement of the SERVQUAL dimensions. J Retailing.
1991;67(4):420-50.
6. Marshall G, Murdoch I. Service quality in consuling markeing engineers. Int J Constr Mark. 2001;3(1):41-9.
7. Zeithaml V, Parasuraman A, Berry LL. Delivering service qua
-lity: balancing customers percepions and expectaions: New York: The Free Press; 1990.
8. Parasuraman A, Zheitmal VA, Berry LL. SERVQUAL: a
muliple-item scale for measuring consumer percepions of service quality. J Retailing. 1998;64(1):12-40.
9. Castellanos PL.Comparação entre a saisfação do usuário com os serviços oferecidos num hospital geral e a percepção ge
-rencial dessa saisfação[dissertação]. São Paulo: Escola de Administração de Empresas de São Paulo, Fundação Getúlio Vargas; 2002.
10. Hercos BVS, Berezovsky A. Qualidade do serviço otalmoló
-gico prestado aos pacientes ambulatoriais do Sistema Único de Saúde – SUS. Arq Bras Otamol. 2006; 69(2):213-9.
11. Arroyo CS.Qualidade de serviços de assistência à saúde: o tempo de atendimento da consulta médica [tese doutora
-do]. São Paulo: Faculdade de Economia, Administração e Contabilidade, Universidade de São Paulo; 2007.
12. Lin DJ, Li YH, Pai JY, Sheu IC, Glen R, Chou MJ, et al. Chronic kidney-disease screening service quality: quesionnaire sur
-vey research evidence from Taichung City. BMC Health Serv Res. 2009;9:239.
13. Pena MM, Melleiro MM. Degree of saisfacion of users of a private hospital. Acta Paul Enferm [Internet]. 2012 [cited 2012 Sept 19];25(2):197-203. Available from: htp://www. scielo.br/pdf/ape/v25n2/en_a07v25n2.pdf
14. Esperidião AM, Trad LAB. Avaliação de saisfação dos usuá