Internal consistency of the self-reporting
questionnaire-20 in occupational groups
Kionna Oliveira Bernardes SantosI, Fernando Martins CarvalhoII,Tânia Maria de AraújoIIII Departamento de Biofunção. Universidade Federal da Bahia. Salvador, BA, Brasil
II Departamento de Medicina Preventiva. Universidade Federal da Bahia. Salvador, BA, Brasil III Departamento de Saúde. Universidade Estadual de Feira de Santana. Feira de Santana, BA, Brasil
ABSTRACT
OBJECTIVE: To assess the internal consistency of the measurements of the Self-Reporting Questionnaire (SRQ-20) in diferent occupational groups.
METHODS:A validation study was conducted with data from four surveys with groups of workers, using similar methods. A total of 9,959 workers were studied. In all surveys, the common mental disorders were assessed via SRQ-20. he internal consistency considered the items belonging to dimensions extracted by tetrachoric factor analysis for each study. Item homogeneity assessment compared estimates of Cronbach’s alpha (KD-20), the alpha applied to a tetrachoric correlation matrix and stratiied Cronbach’s alpha.
RESULTS: The SRQ-20 dimensions showed adequate values, considering the reference parameters. he internal consistency of the instrument items, assessed by stratiied Cronbach’s alpha, was high (> 0.80) in the four studies.
CONCLUSIONS:he SRQ-20 showed good internal consistency in the professional categories evaluated. However, there is still a need for studies using alternative methods and additional information able to reine the accuracy of latent variable measurement instruments, as in the case of common mental disorders.
DESCRIPTORS:Mental Health. Questionnaires, utilization. Reproducibility of Results. Validation Studies. Mental Disorders, diagnosis. Workers.
Correspondence:
Kionna Oliveira Bernardes Santos Av. Miguel Calmon, s/n Vale do Canela 40110-100 Salvador, BA, Brasil E-mail: kionna.bernardes@ufba.br
Received: 5 Jan 2015
Approved: 21 May 2015
How to cite: Santos KOB, Carvalho FM, Araújo TM. Internal consistency of the self-reporting questionnaire-20 in occupational groups. Rev Saude Publica. 2016;50:6.
Copyright: This is an open-access article distributed under the terms of the Creative Commons Attribution License, which permits unrestricted use, distribution, and reproduction in any medium, provided that the original author and source are credited.
INTRODUCTION
In the early 1970s, the World Health Organizationa built the Self-Reporting Questionnaire
(SRQ) to assess the impacts of mental health problems in primary health care in periphery countries. his instrument was composed of 30 questions evaluating psycho-emotional symptoms, alcohol abuse, psychotic disorders and seizures. he target population was primary health service users. In 198012, a version with 20 questions (SRQ-20) was developed,
covering only psycho-emotional aspects. It was proposed for screening of common mental disorders (CMD), which are nonpsychotic symptoms characterized by insomnia, fatigue, irritability, forgetfulness, trouble concentrating, and somatic complaints8.
he SRQ-20 has been widely used and the performance of its measurements has been evaluated in populations of health service users22. However, few studies have assessed the
validity and consistency of SQR-20 measurements regarding occupation21.
Instruments for assessment of behavioral traits or sets of symptoms need item homogeneity to capture diferent aspects of the same variable. Internal consistency evaluations of instruments are considered a reliability criterion for a measurement. However, this interpretation has its limits because measurements of internal consistency are based on management of the scale at a speciic point, not considering sources of variation throughout time or among observers24.
he concept of validity is related to the quality of a given measurement. Reliability relects the set of random and systematic errors inherent in a measurement. he relationship between validity and reliability can be analyzed by the consistency of external (validity) and internal (reliability) criteria25.
Reliability relects a necessary but insuicient condition for the validity of a particular measurement. his condition does not characterize a property of a research instrument; essentially, reliability refers to the ability of the measurement produced by the instrument to be consistent in time and space or among diferent observers16. In addition, the conditions
to evaluate reliability are relative, since every measurement has a degree of reliability when applied to a particular population under speciic conditions24.
In the reliability assessment, three procedures can be adopted, depending on the type of the instrument and form of measurement. he stability evaluation of the measurement considers the consistency over time (test-retest), a technique related to the concept of reproducibility of measurements. The second procedure concerns measurement equivalence by considering different forms of measurement (interobserver). The measurement can also be evaluated by the internal consistency of the set of items used to estimate a certain latent variable or dimension15. hus, the internal consistency of the
instrument shows the degree of homogeneity of the measurement when the items or subscales measure the same variable16.
This study aimed to assess the internal consistency of SRQ-20 measurements in occupational groups.
METHODS
A validation study was conducted with four surveys that used similar methodologies in diferent occupational categories in the state of Bahia, Northeastern Brazil.
Study 1 – Informal workers. An epidemiological survey, with systematic sampling of 1,458 stallholders, street vendors and motorcycle taxi drivers in Feira de Santana, Bahia, in 20081.
Study 2 – Teachers. A census of the 4,496 teachers from the 365 public preschools and elementary schools in Salvador, Bahia, 20064.
Study 3 – Health care workers. A cross section of a multicenter study using the same sampling procedures of a survey carried out in Belo Horizonte2, Minas Gerais, among primary health care
workers from four municipalities of Bahia (Feira de Santana, Jequié, Santo Antônio de Jesus and a health district of Salvador). Its proportional stratiied sampling considered: the distribution of the number of workers by geographical area; deinition of events of interest estimates; composition of the sample according to the percentage of workers in each geographical area of the participating municipalities; and the draw, by random procedure, of the workers included in the study in each region. hroughout the 2012-2013 period, 2,448 workers were evaluated.
Study 4 – Urban workers. A random sample of 1,557 individuals, representing workers over 15 years of age, stratiied by subdistricts of the urban area of Feira de Santana, in 200720.
In all studies, common mental disorders were evaluated with the use of the Self-Reporting Questionnaire (SRQ-20). To analyze the internal consistency of the dimensions (subscales) of the instrument, a tetrachotric correlation factor analysis was previously performed using the method of principal components with factor extraction, according to the Kaiser criterion of eigenvalue greater than 1. he scree plot technique was used to conirm the amount of factors to be extracted. he items presenting load greater than 0.40 were retained for composition of the factors11. PROMAX oblique rotation was applied for better interpretation of the values,
using the Stata program, version 11.0.
To compare estimates of internal consistency of subscales (dimensions) extracted by tetrachoric factor analysis, we used alpha (α) values by the Kuder-Richardson formula (KD-20), α for the tetrachoric correlations matrix, and stratiied α6, to investigate a possible
underestimation of internal consistency.
Stratified α was estimated using Microsoft Excel (2007), employing the formula in which
S2
i is the variance of the items that constitute the factor i (i = 1, ..., f), αi is Cronbach’s
alpha for the factor i and S2
T is the total variance of the instrument, according to the
equation below. The variation of 0.65-0.90 was adopted as the reference parameter of satisfactory performance17.
∑
α
α
S
i2
= −
−
=
S
i
2
1
(
1
)
Estr
i f
1
The four studies were evaluated and approved by research ethics committees when they were conducted. The present study was approved by the Research Ethics Committee of the Instituto de Saúde Coletiva da Universidade Federal da Bahia (CAAE 18723813.9.0000.5030).
RESULTS
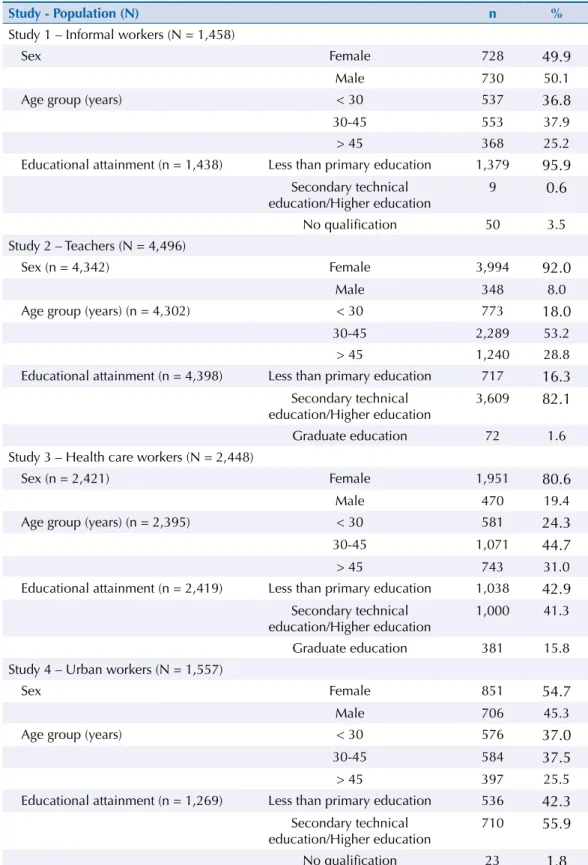
Most evaluated workers were female, especially among teachers (92.0%; study 2) and health workers (80.6%; study 3). In the four studies, the predominant age group was 30 to 45 years (Table 1). he educational attainment of the workers difered among studies. Most informal workers (study 1) reported less than primary educational attainment (95.9%). In study 3, 42.9% reported elementary educational attainment and 41.3% secondary technical education or higher education. Secondary technical education or higher education was reported by 82.1% of teachers (study 2) and 55.9% of workers in general (study 4).
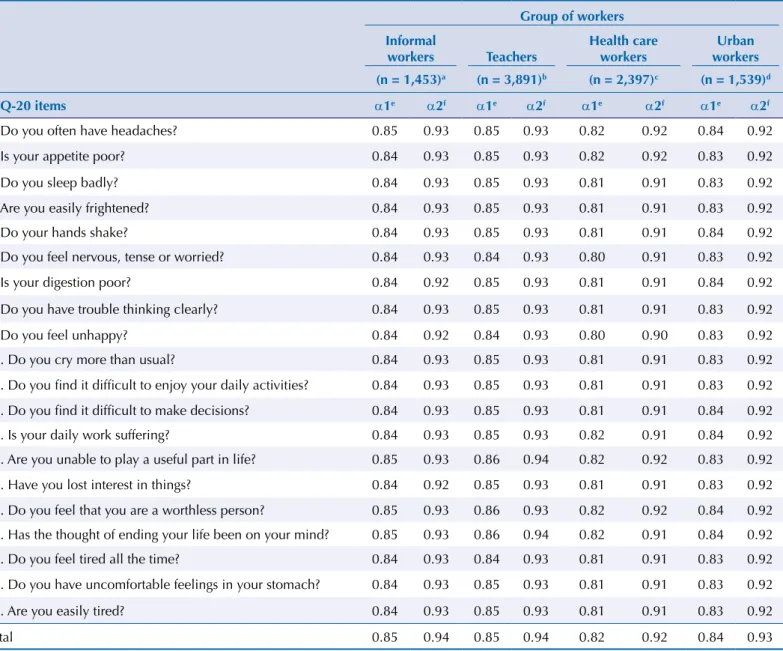
he α values of SRQ-20 dimensions of the occupational groups evaluated showed signiicant variations. he use of the alpha adjusted by the tetrachoric correlation matrix allowed more robust coeicients, considering the sample size.
In studies 1 and 2, we observed similar KD-20 and tetrachoric matrix α values (0.85
and 0.94, respectively). Study 3 (health workers) showed the lowest value of internal consistency for both estimators (0.82 and 0.92). In study 4, standardized values of the item set were 0.84 for the KD-20 estimate and 0.93 for the tetrachoric correlation α. In
Table 1. Sociodemographic characteristics of the populations of the four studies. Bahia, Northeastern Brazil, 2006-2013.
Study - Population (N) n %
Study 1 – Informal workers (N = 1,458)
Sex Female 728 49.9
Male 730 50.1
Age group (years) < 30 537 36.8
30-45 553 37.9
> 45 368 25.2
Educational attainment (n = 1,438) Less than primary education 1,379 95.9
Secondary technical education/Higher education
9 0.6
No qualification 50 3.5
Study 2 – Teachers (N = 4,496)
Sex (n = 4,342) Female 3,994 92.0
Male 348 8.0
Age group (years) (n = 4,302) < 30 773 18.0
30-45 2,289 53.2
> 45 1,240 28.8
Educational attainment (n = 4,398) Less than primary education 717 16.3
Secondary technical education/Higher education
3,609 82.1
Graduate education 72 1.6
Study 3 – Health care workers (N = 2,448)
Sex (n = 2,421) Female 1,951 80.6
Male 470 19.4
Age group (years) (n = 2,395) < 30 581 24.3
30-45 1,071 44.7
> 45 743 31.0
Educational attainment (n = 2,419) Less than primary education 1,038 42.9
Secondary technical education/Higher education
1,000 41.3
Graduate education 381 15.8
Study 4 – Urban workers (N = 1,557)
Sex Female 851 54.7
Male 706 45.3
Age group (years) < 30 576 37.0
30-45 584 37.5
> 45 397 25.5
Educational attainment (n = 1,269) Less than primary education 536 42.3
Secondary technical education/Higher education
710 55.9
all studies, removing items did not change substantially the global values of internal consistency estimates of the instrument.
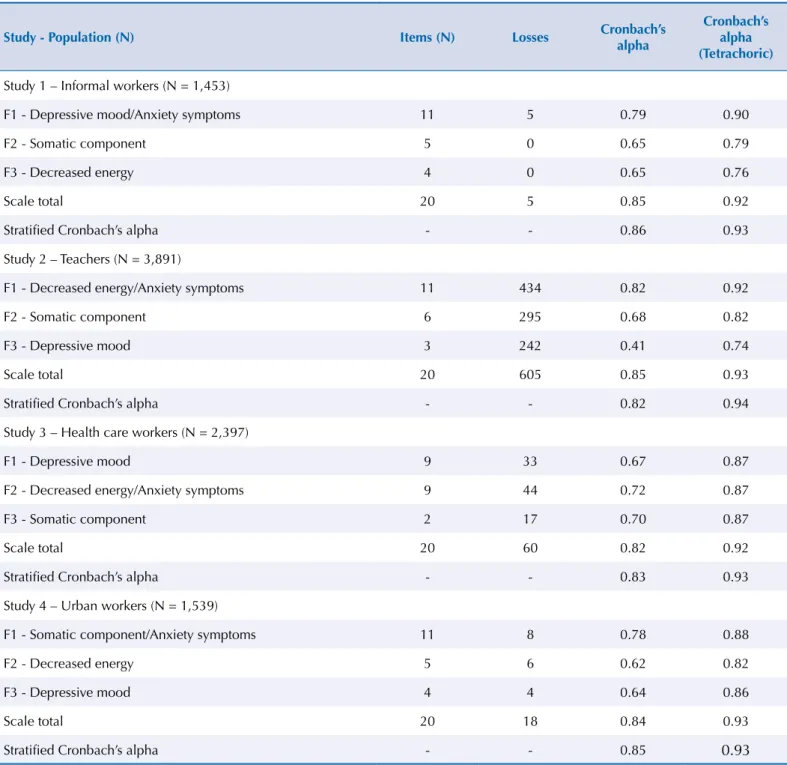
he factor analysis allowed the extraction of three factors that difered as to classiication of the dimensions and number of items in each dimension among studies (Table 3).
he Cronbach’s α estimated for tetrachoric correlation matrix produced higher values for
all dimensions of the studies. he internal consistency of the instrument items, assessed by stratiied Cronbach’s α, was high (> 0.80) in most studies.
In study 1, the dimension represented by factor 1 (F1 - depressive mood or anxiety symptoms) concentrated the largest number of items (11) and higher internal consistency according to both estimation methods (0.79 and 0.90). Factor 2 (F2) represented the somatic dimension and factor 3 (F3), the dimension “decreased energy”. hese last two dimensions showed
Table 2. Cronbach’s alpha (KD-20) and tetrachoric correlation matrix alpha values of the items composing SRQ-20, according to group of workers. Bahia, Northeastern Brazil, 2006-2013.
Group of workers
Informal
workers Teachers
Health care workers
Urban workers (n = 1,453)a (n = 3,891)b (n = 2,397)c (n = 1,539)d
SRQ-20 items α1e α2f α1e α2f α1e α2f α1e α2f
1. Do you often have headaches? 0.85 0.93 0.85 0.93 0.82 0.92 0.84 0.92
2. Is your appetite poor? 0.84 0.93 0.85 0.93 0.82 0.92 0.83 0.92
3. Do you sleep badly? 0.84 0.93 0.85 0.93 0.81 0.91 0.83 0.92
4. Are you easily frightened? 0.84 0.93 0.85 0.93 0.81 0.91 0.83 0.92
5. Do your hands shake? 0.84 0.93 0.85 0.93 0.81 0.91 0.84 0.92
6. Do you feel nervous, tense or worried? 0.84 0.93 0.84 0.93 0.80 0.91 0.83 0.92
7. Is your digestion poor? 0.84 0.92 0.85 0.93 0.81 0.91 0.84 0.92
8. Do you have trouble thinking clearly? 0.84 0.93 0.85 0.93 0.81 0.91 0.83 0.92
9. Do you feel unhappy? 0.84 0.92 0.84 0.93 0.80 0.90 0.83 0.92
10. Do you cry more than usual? 0.84 0.93 0.85 0.93 0.81 0.91 0.83 0.92
11. Do you find it difficult to enjoy your daily activities? 0.84 0.93 0.85 0.93 0.81 0.91 0.83 0.92
12. Do you find it difficult to make decisions? 0.84 0.93 0.85 0.93 0.81 0.91 0.84 0.92
13. Is your daily work suffering? 0.84 0.93 0.85 0.93 0.82 0.91 0.84 0.92
14. Are you unable to play a useful part in life? 0.85 0.93 0.86 0.94 0.82 0.92 0.83 0.92
15. Have you lost interest in things? 0.84 0.92 0.85 0.93 0.81 0.91 0.83 0.92
16. Do you feel that you are a worthless person? 0.85 0.93 0.86 0.93 0.82 0.92 0.84 0.92
17. Has the thought of ending your life been on your mind? 0.85 0.93 0.86 0.94 0.82 0.91 0.84 0.92
18. Do you feel tired all the time? 0.84 0.93 0.84 0.93 0.81 0.91 0.83 0.92
19. Do you have uncomfortable feelings in your stomach? 0.84 0.93 0.85 0.93 0.81 0.91 0.83 0.92
20. Are you easily tired? 0.84 0.93 0.85 0.93 0.81 0.91 0.83 0.92
Total 0.85 0.94 0.85 0.94 0.82 0.92 0.84 0.93
a 0.3% losses.
b 13.5% losses.
c 2.4% losses.
d 1.2% losses.
e Cronbach’s alpha (KD-20), if the item is removed.
identical Cronbach’s α values (0.65), but difered in estimates assessed for tetrachoric matrix correlation, with a higher value for F2 (α = 0.79).
Among teachers (study 2), dimension “depressive mood” presented limitations in internal consistency (α = 0.41). However, this same dimension stayed within the reference standard (α = 0.74) when the tetrachoric matrix was considered.
he three dimensions extracted by factor analysis in study 3 presented similar estimates of reliability (α = 0.87) when the tetrachoric matrix was considered.
Study 4 showed the smallest reliability estimates among SRQ-20 dimensions. Factor 2 (“decreased energy”) and factor 3 (“depressive mood”) presented Cronbach’s α coeicients below the reference value (α = 0.62 and α = 0.64, respectively). However, when using the method of tetrachoric correlation matrix, all factors (dimensions) reached coeicients greater than 0.80.
Table 3. Number of items, number of losses, estimates of Cronbach’s alpha and of stratified Cronbach’s alpha of the SQR-20 dimensions extracted by tetrachoric factor analysis among groups of workers. Bahia, Northeastern Brazil, 2006-2013.
Study - Population (N) Items (N) Losses Cronbach’s
alpha
Cronbach’s alpha (Tetrachoric)
Study 1 – Informal workers (N = 1,453)
F1 - Depressive mood/Anxiety symptoms 11 5 0.79 0.90
F2 - Somatic component 5 0 0.65 0.79
F3 - Decreased energy 4 0 0.65 0.76
Scale total 20 5 0.85 0.92
Stratified Cronbach’s alpha - - 0.86 0.93
Study 2 – Teachers (N = 3,891)
F1 - Decreased energy/Anxiety symptoms 11 434 0.82 0.92
F2 - Somatic component 6 295 0.68 0.82
F3 - Depressive mood 3 242 0.41 0.74
Scale total 20 605 0.85 0.93
Stratified Cronbach’s alpha - - 0.82 0.94
Study 3 – Health care workers (N = 2,397)
F1 - Depressive mood 9 33 0.67 0.87
F2 - Decreased energy/Anxiety symptoms 9 44 0.72 0.87
F3 - Somatic component 2 17 0.70 0.87
Scale total 20 60 0.82 0.92
Stratified Cronbach’s alpha - - 0.83 0.93
Study 4 – Urban workers (N = 1,539)
F1 - Somatic component/Anxiety symptoms 11 8 0.78 0.88
F2 - Decreased energy 5 6 0.62 0.82
F3 - Depressive mood 4 4 0.64 0.86
Scale total 20 18 0.84 0.93
DISCUSSION
Internal consistency estimates of SRQ-20 dimensions and global scores, using a tetrachoric correlation matrix, showed adequate values consistent with the literature17.
However, the high proportion of losses in study 2 may have compromised Cronbach’s
alpha estimates. Both losses affecting α values and differences among occupational
groups show that the reliability of a measurement, evaluated by the reproducibility or homogeneity of measurement items, cannot be interpreted as an inherent or immutable property of an instrument because it depends on the interaction between the instrument and a specific assessed group24.
Internal consistency has been considered a suitable measurement to describe traits, characteristics of behaviors or disorders in a particular context, but not necessarily to identify groups possessing such attributes or not25. Thus, group characteristics may
affect the homogeneity of measurement items. Intra- or inter-subject differences related to the variability of the data affects the α value. Generally, the smaller the variability of intra-subject responses and the larger the variability of inter-subject responses, the greater the α value16.
In this study, most occupational groups had a predominance of females, with an average age of 30 to 45 years and diferences in educational attainment. Low educational attainment can be a barrier to express emotional disorders7. However, the stratiication used here hampers
a detailed analysis of this characteristic in the interpretation of the scale.
In addition to the diferences between the groups, the high degree of consistency in the measurements of a scale denotes ease of interpretation of the inal score, as a relection of the items composing the instrument. To do this, the items should be moderately correlated with each other and maintain a correlation with the total score of scale13.
The interpretation of internal consistency measurements produced by SRQ-20 has
been discussed in the literature. Most studies use Cronbach’s α (KD-20) as a reference
measurement to evaluate the consistency of SRQ-209,14,21,22. The total scores of the
instrument have been interpreted as satisfactory; however, when evaluating the dimensions that represent groups of symptoms, Cronbach’s α coeicients show smaller values. he multidimensionality of the variable measured by SRQ-20 limits homogeneous relations among items and justiies the irregular performance of internal consistency instrument measurements21.
Some aspects should be considered when evaluating the results related to internal consistency estimates of an instrument. Uncritical acceptance of α values, as a relex of high levels of internal consistency, can lead to impaired judgment of the real scale homogeneity.
The α value depends not only on the magnitude of the correlation of the items in a scale, but also on the number of items that compose it. Thus, the greater the number of items in a scale, the greater the estimated internal consistency. Another condition that requires greater caution when interpretating internal consistency is the combination of scales that assess independent constructs, because the increase in the items will elevate α estimates. In addition, high α values may be related to redundancy of the scale items, compromising content validity, since an item set can assess the same conditions in different ways25.
In this study, most dimensions extracted by tetrachoric factor analysis showed internal consistency estimates within the assumed reference parameter (α = 0.65-0.90). However, the parameters used as reference for the estimates of α are also the target of criticism.
There are several reference values to evaluate the internal consistency of scales17,21.
and α = 0.70 are considered of good internal consistency in their measurements. On the other hand, if the scale has more items and a sample size greater than 300, α = 0.90 must be used as a parameter25. Despite the proposed parameters, critical evaluations must
be stimulated. Estimates of α are affected by the amount of items and dimensionality
of the scales. Values higher than 0.90 suggest redundancy of scale items and a need to reduce the instrument26.
his study provides evidence to characterize SRQ-20 as a multidimensional instrument, with dimensions varying among the diferent occupational groups investigated. Estimates of α cannot be interpreted as a property of the instrument, since they are conditioned by scale scores in a given population24.
In general, one-dimensional measurements feature high levels of internal consistency (high homogeneity). However, high internal consistency values represent conditions necessary
but insuicient to ensure the unicity of a scale5. hus, multidimensional instruments
featuring high internal consistency levels for a particular measurement show that, although there are diferent dimensions, the components are strongly interrelated16.
he α values may underestimate the true internal consistency of the measurementss of a multidimensional instrument because the α estimate suggests equivalent distinction among the questionnaire items18,19,b. Congeneric scales, characterized by correlation of
items among themselves, are also afected by the underestimation of alpha values10. For
multidimensional instruments, the stratiied α has showed better performance for the
estimates than conventional estimators, although the diferences are not so expressiveb.
herefore, the principle of tau equivalence must be considered when analyzing estimates of Cronbach’s α among multidimensional instruments. In these cases, the assumption that each item of test measures the same latent trait in an instrument is violated by the dimensions extracted by factor analysis. In this way, the α values of a multidimensional instrument will be underestimated26.
In the context of psychometric assessments, we highlight the debate on the superiority of measurements used as reliability criteria3. Cronbach’s α measurements are widely used
uncritically and often considered a reference for scale reliability. However, it is necessary to deepen the analysis of α values and to compare the indexes based on repetition of measurements (test-retest)10.
Operational and theoretical limitations relect a low threshold of internal consistency for estimates produced by Cronbach’s α. here are also the diiculties of interpretation and judgement of its measurements. Alpha estimates correlate with other statistics, which can confuse results when very low and very high values of this coeicient are found in one-dimensional or multidimensional instruments. hus, additional information is required to assess α estimates separatedly as an internal consistency measurement23.
Despite the extensive use of Cronbach’s α in the internal consistency evaluation of SRQ-20, the discussion about the real implications of its measurements for multidimensional instruments is still recent. Studies are needed to critically assess Cronbach’s α estimates, comparing them with alternative methods and additional information to reine the accuracy of latent variable measurement instruments, as in the case of mental disorders.
REFERENCES
1. Araújo TM, Karasek R. Validity and reliability of the job content questionnaire in formal and informal jobs in Brazil. Scand J Work Environ Health. 2008;34(supll 6):52-9.
2. Barbosa REC, Assunção AA, Araújo TM. Distúrbios musculoesqueléticos em trabalhadores do setor saúde de Belo Horizonte, Minas Gerais, Brasil. Cad Saude Publica. 2012;28(8):1569-80. DOI:10.1590/S0102-311X2012000800015
3. Brennan RL. Generalizability theory. New York: Springer; 2001.
4. Cardoso JP, Araújo TM, Carvalho FM, Oliveira NF, Reis EJFB. Aspectos psicossociais do trabalho e dor musculoesquelética em professores. Cad Saude Publica. 2011;27(8):1498-506. DOI:10.1590/S0102-311X2011000800005
5. Cortina J. What is coefficient alpha: an examination of theory and applications. J Appl Psychol. 1993;78(1):98-104. DOI:10.1037/0021-9010.78.1.98
6. 6. Cronbach lJ, Schönemann P, Mckie D. Alpha coefficients for stratified parallel tests. Educ Psychol Meas. 1965;25(2):291-312. DOI:10.1177/001316446502500201
7. Glubash R, Daradkeh T, El-Rufaie, OF, About-Saleh MT. A comparison of the validity of two psychiatric screening questionnaires: the Arabic General Health Questionnaire (AGHQ) and Self-Reporting Questionnaire (SRQ-20) in UAE, using Receiver Operating Characteristic (ROC) analysis. Eur Psychiatr. 2001;16(2):122-6. DOI:10.1016/S0924-9338(01)00549-1
8. Goldberg D, Huxley P. Common mental disorders:a bio-social model. London: Tavistock; 1992.
9. Gonçalves DM, Stein AT, Kapczinsk F. Avaliação de desempenho do Self-Reporting Questionnaire como instrumento de rastreamento psiquiátrico: um estudo comparativo com o Structured Clinical Interview for DSM-IV-TR. Cad Saude Publica. 2008;24(2):380-90. DOI:10.1590/S0102-311X2008000200017
10. Graham J. Congeneric and (essentially) tau-equivalent estimates of scorer reliability: what they are and how to use them. Edu Psychol Meas. 2006;66(6):930-44. DOI:10.1177/0013164406288165
11. Hair Junior JF, Black WC, Babin BJ, Anderson RE, Tatham RL. Análise multivariada de dados. 6a ed. Porto Alegre: Bookman; 2009.
12. Harding TW, De Arango MV, Baltazar J, Climent CE, Ibrahim HHA, Ladrido-Ignacio L et al. Mental disorders in primary health care: a study of their frequency and diagnosis in four developing countries. Psychol Med. 1980;10(2):231-41. DOI:10.1017/S0033291700043993
13. Henson RK. Understanding internal consistency reliability estimates: a conceptual primers on coefficient alpha. Meas Eval Couns Dev. 2001:34(3):177-88.
14. Iacoponi E, Mari JJ. Reability and factor structure of the Portuguese version of Self-Reporting Questionnaire. Int J Soc Psychiatry. 1989;35(3):213-22. DOI:10.1177/002076408903500301
15. Krathwohl DR. Methods of educational and social science research: an integrated approach. 2nd ed. New York: Longman; 1998.
16. Maroco J, Garcia-Marques T. Qual a fiabilidade do alpha de Cronbach? Questões antigas e soluções modernas? Lab Psicol. 2006;4(1):65-90.
17. Nunnaly J. Psychometric theory. New York: McGraw-Hill; 1978.
18. Osburn HG. Coefficient alpha and related internal consistency reliability coefficients. Psychol Methods. 2000;5(3):343-55. DOI:10.1037/1082-989X.5.3.343
19. Ponterotto JG, Ruckdeschel D. An overview of coefficient alpha and a reliability matrix for estimating adequacy of internal consistency coefficients with psychological research measures. Percept Mot Skills. 2007;105(3):997-1014. DOI:10.2466/pms.105.3.997-1014
20. Prisco AP, Araújo TM, Almeida MMG, Santos KOB. Prevalência de transtornos alimentares em trabalhadores urbanos de município do Nordeste do Brasil. Cienc Saude Coletiva. 2013;18(4):1109-18. DOI:10.1590/S1413-81232013000400024
21. Santos KOB, Araújo TM, Oliveira NF. Estrutura fatorial e consistência interna do Self Reporting Questionnaire (SRQ-20) em população urbana. Cad Saude Publica. 2009;25(1):214-22. DOI:10.1590/S0102-311X2009000100023
22. Scazufca M, Menezes PR, Vallada H, Araya R. Validity of the self reporting
questionnaire-20 in epidemiological studies with older adults: results from the Sao Paulo Ageing & Health Study. Soc Psychiatry Psychiatr Epidemiol. 2009;44(3):247-54. DOI:10.1007/s00127-008-0425-y
23. Sijtsma K. On the use, the misuse, and the very limited usefulness of Cronbach’s alpha.
Psychometrika. 2009;74(1):107-20. DOI:10.1007/s11336-008-9101-0
25. Streiner DL, Norman GR. Health measurement scales:a practical guide to their development and use. 4th ed. Oxford: Oxford University Press; 2008.
26. Tavakol M, Dennick R. Post-examination analysis of objective tests. Med Teach. 2011;33(6):447-58. DOI:10.3109/0142159X.2011.564682
Funding: Conselho Nacional do Desenvolvimento Cientíico e Tecnológico (CNPq – Process 304563/2014-5).
Author’s Contribution: Drafting of the manuscript: KOBS, FMC, and TMA. Analysis and interpretation of data: KOBS, FMC, and TMA. Critical review of the manuscript: KOBS, FMC, and TMA.