Predicting Pharmacodynamic Drug-Drug
Interactions through Signaling Propagation
Interference on Protein-Protein Interaction
Networks
Kyunghyun Park1, Docyong Kim1, Suhyun Ha1, Doheon Lee1,2*
1Department of Bio and Brain Engineering, KAIST, 291 Daehak-ro, Yuseong-gu, Daejeon 305–701, Republic of Korea,2Bio-Synergy Research Center, KAIST, 291 Daehak-ro, Yuseong-gu, Daejeon 305–701, Republic of Korea
*dhlee@kaist.ac.kr
Abstract
As pharmacodynamic drug-drug interactions (PD DDIs) could lead to severe adverse effects in patients, it is important to identify potential PD DDIs in drug development. The sig-naling starting from drug targets is propagated through protein-protein interaction (PPI) net-works. PD DDIs could occur by close interference on the same targets or within the same pathways as well as distant interference through cross-talking pathways. However, most of the previous approaches have considered only close interference by measuring distances between drug targets or comparing target neighbors. We have applied a random walk with restart algorithm to simulate signaling propagation from drug targets in order to capture the possibility of their distant interference. Cross validation with DrugBank and Kyoto Encyclo-pedia of Genes and Genomes DRUG shows that the proposed method outperforms the pre-vious methods significantly. We also provide a web service with which PD DDIs for drug
pairs can be analyzed athttp://biosoft.kaist.ac.kr/targetrw.
Introduction
According to the Centers for Disease Control and Prevention, National Center for Health Sta-tistics, from 1999–2000 to 2007–2008, the percentage of the US population taking two or more prescription drugs increased from 25.4% to 31.2% [1]. In addition, the percentage taking five or more prescription drugs increased from 6.3% to 10.7% [1]. Interestingly, in 2007–2008, less than 10% of children under 12 years of age took two or more prescription drugs, and only 1% took five or more prescription drugs [1]. On the other hand, in the same period more than 76% of older Americans aged 60 and over took two or more prescription drugs and 37% took five or more prescription drugs [1]. The survey results illustrate that more people take multiple medi-cations with passing time and older people take more of them than younger people. One conse-quence of the growing use of multiple prescription drugs is the potential for interaction OPEN ACCESS
Citation:Park K, Kim D, Ha S, Lee D (2015) Predicting Pharmacodynamic Drug-Drug Interactions through Signaling Propagation Interference on Protein-Protein Interaction Networks. PLoS ONE 10(10): e0140816. doi:10.1371/journal.pone.0140816
Editor:Miguel Angel Medina, Universidad de Malaga, SPAIN
Received:May 4, 2015
Accepted:September 29, 2015
Published:October 15, 2015
Copyright:© 2015 Park et al. This is an open access article distributed under the terms of the
Creative Commons Attribution License, which permits unrestricted use, distribution, and reproduction in any medium, provided the original author and source are credited.
Data Availability Statement:All relevant data are within the paper and its Supporting Information files.
Funding:This work was supported by the Bio-Synergy Research Project
(NRF-2012M3A9C4048758) of the Ministry of Science, ICT, and Future Planning through the National Research Foundation.
between drugs, which can lead to serious side effects. In practice, critical drug-drug interactions (DDIs) have resulted in the withdrawal of drugs from usage [2,3]. For example, mibefradil and cerivastatin were withdrawn from the US market due to adverse effects from severe DDIs [3, 4]. In addition to such potential health risks, the pharmaceutical industry invests much time and money in drug development. Therefore, identifying possible DDIs at an early stage of drug development is crucial for the safety of patients and the success of a drug.
DDI is defined as a change in efficacy of a drug by the co-administration of two or more drugs [5]. DDIs are categorized into pharmacodynamic and pharmacokinetic interactions [6]. The pharmacodynamic DDI (PD DDI) occurs when one drug interferes with another drug at a target site or affects another protein within the same pathway [7,8]. One drug can alter the effects of another drug if they have same signaling pathway [8]. It is interference with pharma-codynamics by affecting mechanism of action of the drug without altering pharmacokinetics. The pharmacokinetic DDI (PK DDI) occurs when one drug changes the absorption, distribu-tion, metabolism, or excretion property of another drug [7].
To analyze a large number of DDI candidates, computational approaches have been devel-oped with methods that can predict possible DDIs using various types of drug information (e.g., chemical structure, target proteins, and side effects) [6,9]. Here, we categorize those pre-vious computational approaches into similarity-based, knowledge-based, and mechanism-based methods. The similarity-mechanism-based method assumes that drugs with similar properties will have similar DDIs. Based on this assumption, Vilaret al. measured drug similarity using the Tanimoto coefficient between the interaction profile fingerprints of drug pairs [9]. Chenget al. integrated chemical, side effect, therapeutic, and genomic properties and constructed a data-base of adverse drug events [10–13]. Liet al. developed a Bayesian network integrating drug similarity using drug molecular and pharmacological phenotypes [14]. In addition, Gottlieb
et al. used seven kinds of methods for calculating drug similarity (e.g., chemical-based, ligand-based, side-effect ligand-based, annotation-ligand-based, sequence-ligand-based, closeness-based in a protein-pro-tein interaction (PPI) network, and Gene Ontology-based similarity) [6]. The knowledge-based method uses the literature and the FDA Adverse Event Reporting System (FAERS) to predict DDIs [15,16]. Segura-Bedmaret al. predicted the DDIs from text information on drugs and their interactions in DrugBank using a shallow linguistic kernel [16]. Tatonettiet al. identified drug effects and interactions using FAERS. The mechanism-based method predicts the PD DDIs using drug target associations in molecular level. Yildirimet al. constructed a drug network by connecting drugs if they shared target proteins [17]. Recently, Huanget al. developed a target-center system for each drug, which consists of drug targets and their first neighbors in the PPI network and human tissue gene expression [18]. To predict as well as pre-vent the PD DDIs, it is necessary to identify the mechanism of the interactions. Therefore, this study focused on the mechanism-based approaches.
Signaling starting from drug targets would propagate through the PPI network because the PPI network transfers the biological function through the assembly of a protein signal cascade [19,20]. Therefore, PD DDIs could occur by affecting the close interference as well as distant interference between drug effects. However, most of the previous mechanism-based
approaches have considered only the close interference. The aim of this study is to predict PD DDIs by considering both close and distant interferences of signaling propagation through the PPI network.
Materials and Methods
databases [21–27]. Second, in the algorithm part, we applied our method and the shortest path length average (SPA) method using drug-target associations and the PPI network. Last, in the validation and analysis part, we compared the area under a receiver operating characteristic curve (AUC) and fold enrichment of our method with those of the previous methods. In addi-tion, the PD DDI candidates were analyzed by drug side effects and significant PD DDI-associ-ated genes were analyzed by functional annotation analysis.
Overview of an algorithm for predicting PD DDIs
A random walk with restart (RWR) algorithm can simulate that the random walker from its nodes (proteins) randomly transits to the neighbor nodes on the PPI network starting from drug targets (Fig 1) [28]. The probability of being at each protein was calculated by the RWR algorithm. We took the probability of proteins to represent the influence initiated by drug tar-gets on the PPI network. The RWR algorithm simulates the random walker until the satura-tion of probability for all of the proteins on the PPI network. Next, we calculated the
ProteinScore, which represents the overlapping influence on the same proteins from two drugs. In addition, we calculated theDDIScoreby summation of theProteinScoreof all pro-teins. We used theDDIScoreas the possibility measurement for the occurrence of PD DDIs between the drugs.
Fig 1. Overview of the algorithm for predicting PD DDIs.The signaling propagation starting from drug targets (DrugA: Protein 2 and DrugB: Protein 4) through the PPI network is simulated by RWR algorithm. The
ProteinScoreis defined as the values of the protein profile of drug pairs after finishing the simulation of RWR algorithm. TheDDIScoreis calculated by the summation of theProteinScoreof all proteins. TheDDIScore
represents the interference of signaling propagation through PPI network between drugs.
Data sets
4,085 drugs in DrugBank were used in this study [27]. 14,516 drug-target associations were used in DrugBank [27]. We used 281 pathways from Kyoto Encyclopedia of Genes and Genomes (KEGG) [25]. Previous studies used non- cytochrome P450 (CYP)-related DDIs that are not metabolized by the same CYP between drugs in known DDIs and DDIs from a semi-automatic text mining method as PD DDIs [6,18]. We thought that their PD DDIs would include many false-positive PD DDIs. The PD DDI occurs when one drug interferes with another drug at a target site or affects another protein within the same pathways [7,8]. To make more precise PD DDIs, we used known DDIs as PD DDIs when their targets were same or within the same pathway. The known DDIs were downloaded from DrugBank and KEGG DRUG [25,27]. We used two sources of PD DDIs, namely, 2,348 PD DDIs and 13,357 PD DDIs from DrugBank and KEGG DRUG, respectively [25,27]. The KEGG identifier (ID) was converted to DrugBank ID using their data (ftp://ftp.genome.jp/pub/kegg/medicus/drug/drug). We used three human protein interaction networks, Human Protein Reference Database (HPRD) (9,117 proteins and 36,248 interactions), Interologous Interaction Database (I2D) (9,478 proteins and 43,593 interactions), and IntAct (10,942 proteins and 58,303 interactions) from Human Integrated Protein-Protein Interaction rEference (HIPPIE) [21–24,26]. In addi-tion, we used the integrated PPI network (12,492 proteins and 82,694 interactions) by HPRD, I2D, and IntAct from HIPPIE [21–24,26]. A rule format based on our previous work was used to describe the PPI network [29]. The DDI side effects were downloaded from TWOSIDES (http://www.pharmgkb.org/downloads/) [15]. In addition, the drug side effects were down-loaded from SIDER (http://sideeffects.embl.de/download/) [30]. To identify associations between drugs, we used STITCH that provides the interactions of chemicals from various data sources such as the result of text mining and the knowledge of the other associated databases [31]. The STITCH drug ID in TWOSIDES and SIDER was converted to the DrugBank ID using the STITCH file (chemical.sources.tsv.gz) [31].
An algorithm for predicting PD DDIs
The RWR algorithm could simulate the signaling propagation starting from drug targets through the PPI network. We assumed that the probability of being at each protein according to the RWR algorithm is the value of the influence starting from drug targets on the PPI net-work. The probability vector of being each node at time stept+1 by RWR algorithm was defined as
pðtþ1Þ ¼ ð1 rÞWT pðtÞ þrpð0Þ ð1Þ
whererrepresents the restarting probability of the random walker at each time step,W repre-sents the normalized adjacency matrix of the PPI network,p(t)is the probability vector of being each node at time stept, andp(0) represents initial probability vector [32–34].
The initial probability of drug targets among proteins on the PPI network is 1 and the others are 0. In addition, the RWR algorithm was simulated until the sum of the absolute differences of each protein probability between the previous step and current step was less than 1.0E-5 with the restarting probability of 0.7. TheProteinScoreandDDIScoreare defined as
ProteinScoreiðDrugA;DrugBÞ ¼
ffiffiffiffiffiffiffiffiffiffiffiffiffiffiffiffiffiffiffiffiffiffiffiffiffiffiffiffiffiffiffiffiffiffiffiffiffiffiffiffiffiffiffiffiffi ViðDrugAÞ ViðDrugBÞ
p
ð2Þ
DDIScoreðDrugA;DrugBÞ ¼
XN
i¼1
whereirepresents the index of proteins,vi(DrugA)represents the probability of being at the proteiniofDrugAafter thefinishing simulation of RWR algorithm, andNrepresents the num-ber of proteins on the PPI network.
TheProteinScorerepresents the overlapping influence on the same proteins between drugs. In addition, theDDIScorerepresents the interference score between drugs as determined by the summation of theProteinScoreof all proteins.
Comparison with previous methods
In this study, we evaluated performance using two DDI databases, DrugBank and KEGG DRUG [25,27], and three PPI network databases, HPRD, I2D, and IntAct in HIPPIE [21–24, 26]. For evaluation, our method was compared with the SPA method used in the Gottliebet al. study and the target-center system in the Huanget al. study [6,18].
Gottliebet al. used SPA among the targets of drugs on the PPI network, one of various simi-larity methods [6]. The SPA measured how close drug targets were on the PPI network. Con-sidering this, we thought that the SPA method does not exploit the distant interference of signaling propagation through the PPI network between drugs. Therefore, the comparison between our method and the SPA method could identify the importance of distant interference of signaling propagation for predicting PD DDIs. The SPA was defined as
SPAðDrugA;DrugBÞ ¼
X
a2TðDrugAÞ
X
b2TðDrugBÞ
Sðpa
;pb
Þ
jTðDrugAÞj jTðDrugBÞj
ð4Þ
TðDrugÞ ¼ fxjxis target protein of Drugg ð5Þ
Sðp;p0Þ ¼
1
Ae Dðp;p0Þ
if pis equal to p0
otherwise
ð6Þ
(
whereAis assigned a value of 0.9 e,pandp0are two proteins on the PPI network, andD(p,p0) is the shortest path length betweenpandp0on the PPI network.
In addition, our study was compared with Huanget al.’smethod [18]. They used the local topology of the PPI network and gene expression profiles across human tissues. We down-loaded the S-score from the study, which describes the connection between the target-centered system of two drugs, from their website (http://www.picb.ac.cn/hanlab/DDI) [18]. To fairly compare our method with Huanget al.’smethod, we used the same PD DDI candidates (217,743 PD DDIs) in both of them.
Evaluation methods of predicted PD DDIs
DDI side effects in TWOSIDES [15]. The fold enrichment was defined as
Fold enrichment¼ m=n
M=N ð7Þ
wheremis the number of known DDIs (or DDIs with the highest confidence score in TWO-SIDES) in the top 5% of PD DDI candidates,nis the number of the top 5% of PD DDI candi-dates,Mis the number of known DDIs (or DDIs with the highest confidence score in TWOSIDES) of all PD DDI candidates, andNis the number of all PD DDI candidates.
The PD DDIs with the highest scores in our method were analyzed by TWOSIDES, SIDER, and STITCH [15,30,31]. The Jaccard index of side effects of a drug pair was defined as below.
SEsimðDrugA;DrugBÞ ¼
jSEðDrugAÞ \SEðDrugBÞj
jSEðDrugAÞ [SEðDrugBÞj
ð8Þ
SEðDrugÞ ¼ fxjxis no placebo and frequent effects ofDrugin SIDERg ð9Þ
We identified the significant PD DDI-associated genes and PD DDI candidates using the empirical p-value. For estimating the empirical p-value, we determined the empirical distribu-tion ofProteinScorefrom randomly selected proteins and randomly selected drug pairs, repeat-ing 100,000 times. In addition, to make the empirical distribution of theDDIScoreas well, we also measured theDDIScorefrom randomly selected drugs for each protein, repeating 100,000 times. The selected significant genes (empirical p-value<1.0E-4) were analyzed by functional annotation analysis using DAVID [35].
Results
Performance evaluation
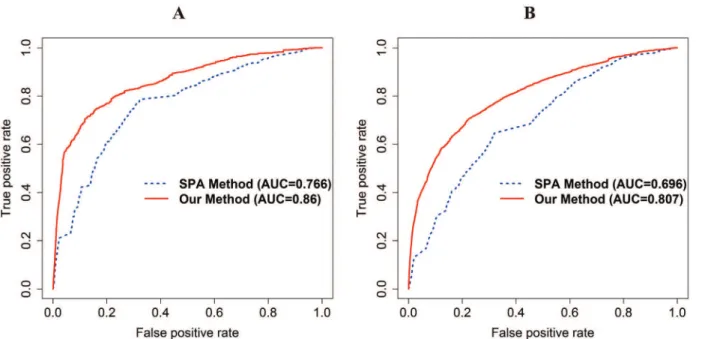
Our method and SPA method are evaluated by the same candidate drug pairs in each PPI net-work (HPRD: 739,936 PD DDIs; I2D: 735,078 PD DDIs; IntAct: 591,328 PD DDIs; integrated PPI network (HPRD, I2D, and IntAct): 779,376 PD DDIs). The AUC of our method is 0.86 and 0.807 and that of the SPA method is 0.766 and 0.696 using the integrated PPI network in DrugBank and KEGG DRUG, respectively (Fig 2A and 2B). The fold enrichment of the top 5% of the PD DDI candidates of our method and the SPA method is 11.573 and 4.492 in DrugBank and 7.946 and 3.082 in KEGG DRUG, respectively. In addition, in DrugBank and KEGG DRUG, our method has also higher accuracy than the SPA method using HPRD, I2D, and IntAct, respectively (S2–S4Figs).
Fig 2. A receiver operating characteristic (ROC) curve with AUC in DrugBank and KEGG DRUG for comparison with the SPA method using integrated PPI network.The red and blue lines represent our method and the SPA method, respectively. (A) The ROC curve with the AUC of our method and the SPA method in DrugBank. (B) The ROC curve with the AUC of our method and the SPA method in KEGG DRUG. The AUC of our method and the SPA method in each DDI database are 0.86 and 0.766 in DrugBank, 0.807 and 0.696 in KEGG DRUG.
doi:10.1371/journal.pone.0140816.g002
Fig 3. ROC curve with AUC in DrugBank and KEGG DRUG for comparison with Huanget al.’smethod using the integrated PPI network.The red and blue lines represent our method and Huanget al.’smethod, respectively. (A) The ROC curve with the AUC of our method and Huanget al.’smethod in DrugBank. (B) The ROC curve with the AUC of our method and Huanget al.’smethod in KEGG DRUG. The AUC of our method and Huanget al.’smethod in
each DDI database are 0.842 and 0.786 in DrugBank and 0.803 and 0.702 in KEGG DRUG. The performance of our method generally outperforms that of Huanget al.’smethod.
Evaluation of predicted PD DDIs using the number of drug targets and
ATC codes
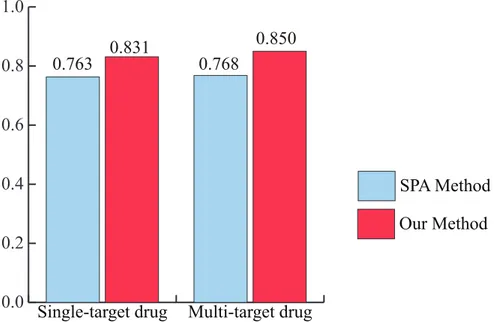
Recently, the paradigm in drug discovery has shifted from single-target drugs to multi-target drugs [36]. Therefore, it becomes necessary to identify the performance of PD DDIs for multi-target drugs. To evaluate the performance of our method for this purpose, the drugs were first categorized into single-target drugs and multi-target drugs by the number of drug targets.Fig 4 shows that our method has more accurate predictions than the SPA method for both of the sin-gle-target drug and multi-target drug categories using the integrated PPI network. For single-target drugs, the AUC of our method and SPA method is 0.831 and 0.763. For multi-single-target drugs, the AUC of our method and SPA method is 0.850 and 0.768. In addition, to evaluate performance robustness, the drugs were categorized into 14 ATC codes. We also identified the performance of our method and the SPA method for these 14 ATC codes using the integrated PPI network. The result shows that our method has higher accuracy than the SPA in overall ATC codes (Fig 5). The“B”code (the first part of the ATC code) represents blood and blood forming organs. Our method and the SPA method have a similar performance. In this case, PD DDIs could occur by the close interference between drugs because the drug might directly bind to disease-associated proteins. For example, lepirudin (B01AE02) is used for the treatment of heparin-induced thrombocytopenia. The drug binds directly to thrombin to prevent thrombus [27]. The“P”code represents antiparasitic products, insecticides and repellents. It should be noted that the comparison between our method and the SPA method might not be appropriate for non-human of drug target organisms because human protein interactions in HIPPIE were only used in this study [22]. For example, the target organisms of metronidazole (P01AB01) are bacteria and protozoa in DrugBank [27]. Nonetheless, from these results, we propose that our method would be an effective approach for predicting PD DDIs in both single-target drugs and multi-target drugs as well as various ATC codes.
Fig 4. The AUC of our method and the SPA method for single-target drug and multi-target drug categories.The AUC of our method outperforms that of the SPA method in both single-target drug and multi-target drug categories.
Evaluation of predicted PD DDIs using known DDIs and DDI side effects
We measured fold enrichment with our method and the SPA method using both types of known DDIs including both PD and PK DDIs in DrugBank and KEGG DRUG as a positive gold standard because using the selected PD DDIs as the positive gold standard could cause a bias of performance. The fold enrichment of the top 5% of the PD DDI candidates of our method and the SPA method is 3.522 and 1.918 in DrugBank and 3.913 and 1.703 in KEGG DRUG, respectively. In addition, we also calculated the fold enrichment of DDI side effects with the highest confidence score in TWOSIDES because unreported DDIs could cause DDI side effects [15]. The fold enrichments of the top 5% of the PD DDI candidates of our method and the SPA method are 2.252 and 0.827, respectively. From these results, we note that the known DDIs and DDI side effects in the top 5% of the PD DDI candidates of our method are more enriched than those of the SPA method.
Case study
For a case study, we selected ziprasidone-quetiapine, olanzapine-quetiapine, and aripiprazole-quetiapine interactions, which had the highest PD DDIs scores. Their scores are the same because ziprasidone, olanzapine, and aripiprazole have identical target proteins in DrugBank [27]. Ziprasidone, olanzapine, aripiprazole, and quetiapine are used for the treatment of schizo-phrenia in DrugBank [27]. Ziprasidone-quetiapine interaction is reported in DrugBank and KEGG DRUG and olanzapine-quetiapine and aripiprazole-quetiapine interactions are reported in KEGG DRUG [25,27]. We analyzed these interactions by using TWOSIDES, SIDER, and STITCH [15,30,31]. Olanzapine-quetiapine and aripiprazole-quetiapine interac-tions have significant DDI side effects (p-value: 1.08E-249 and 9.65E-123) in TWOSIDES. Campilloset al. suggested that drug targets could be identified by similarity of side effects [37]. Therefore, we identified whether drugs that have similar side effects would have also the same target proteins, which is one of the mechanisms causing PD DDIs. The Jaccard index of ziprasi-done-quetiapine, olanzapine-quetiapine, and aripiprazole-quetiapine interactions using the side effects of each drug in SIDER is 0.288 (p-value: 1.25E-27), 0.390 (p-value: 1.04E-41), and 0.317 (p-value: 9.46E-35). In practice, 25 of 26 targets of quetiapine are the same targets as those of ziprasidone, olanzapine, and aripiprazole in DrugBank (S1 Table) [27]. In STITCH, a Fig 5. The AUC of our method and the SPA method for 14 ATC codes.For all of the ATC codes except J (antiinfectives for systemic use), B (blood and blood forming organs), and P (antiparasitic products, insecticides and repellents) codes, our method outperforms the SPA method.
score greater than 0.7 is considered to be a high confidence score based on their criteria [31]. The confidence scores of ziprasidone-quetiapine, olanzapine-quetiapine, and aripiprazole-que-tiapine interactions are 0.798, 0.83, and 0.77, respectively [31]. In addition, we identified 306 PD DDI-associated genes (empirical p-value<1.0E-4) from a permutation test (S2 Table). Table 1shows the significant KEGG pathways (False Discovery Rate (FDR)<5.0E-3) based on a functional annotation analysis using the Database for Annotation, Visualization and Inte-grated Discovery (DAVID), except for the O75970 protein, which had no mapped identifier in DAVID [35]. From these results, we suggest that the interfered pathways could change the effi-cacy of the drugs.
Discussion
Signaling transduction starting from the drug targets propagates to their neighbor nodes through the PPI network [19,20]. Therefore, PD DDIs could occur by both close and distant interferences of signaling propagation through the PPI network. However, previous methods for predicting PD DDIs have only the close interference. The SPA method measured the short-est path length between the targets of drugs on the PPI network [6]. The shortshort-est path length only considers how close drug targets are on the PPI network. In addition, the target-centered system in Huanget al. study used the PPI sub-network consisting of drug targets and their first neighbors and human tissue gene expression [18]. They calculated a system connection score (S-score) between drugs for predicting PD DDIs. It also considers close interference by reflect-ing tightness of connections between two target-centered systems. In this study, we propose that both close and distant interferences of signaling propagation through the PPI network are important features for predicting potential PD DDIs.
Our method exploited the global topology of the PPI network [28]. The score of drug pairs was calculated by the amount of overlapped signaling propagation starting from the drug tar-gets through the PPI network. For evaluation, the performance of our method was compared with that of the SPA method and a recent PD DDI prediction method [6,18]. We identified that the AUC and fold enrichment of our method outperformed those of the SPA method and the recent method.
Developing multi-target drugs is a new paradigm in drug discovery [36]. Recently, Zheng
et al. proposed a weighted ensemble similarity algorithm to predict the drug-target direct Table 1. The significant KEGG pathway lists (FDR<5.00E-03) from 305 PD DDI-associated genes (except O75970 protein) using DAVID.
KEGG pathways p-value FDR
Neuroactive ligand-receptor interaction 4.19E-42 4.68E-39
Calcium signaling pathway 6.66E-28 7.43E-25
Gap junction 1.39E-12 1.56E-09
Long-term depression 6.39E-12 7.14E-09
Long-term potentiation 4.05E-09 4.52E-06
Vascular smooth muscle contraction 7.57E-09 8.44E-06
Chemokine signaling pathway 4.38E-08 4.89E-05
Glioma 8.62E-08 9.62E-05
Neurotrophin signaling pathway 2.36E-07 2.64E-04
We suggest that these significant pathways affected the drug effects through signaling propagation interference between drugs.
interactions [38]. Therefore, we evaluated the performance of our method for multi-target drugs. Drugs were categorized into single-target drugs and multi-target drugs by the number of drug targets. The AUC of our method outperformed the SPA method in each category. In addi-tion, we showed that the top 5% of the PD DDI candidates of our method had a higher fold enrichment of DDI side effects than did the SPA method. DDI side effects can occur by an unknown DDI. Therefore, the results indicated that our method could predict novel PD DDIs in the new paradigm in drug discovery.
DDIs are conventionally categorized into PD DDIs and PK DDIs [6]. As DDIs are predicted by the pharmacodynamic properties, it is hard to predict PK DDIs. In addition, PD DDIs could have antagonistic, synergistic, or additive effects [8,18]. However, in this study, our method could not classify the effect of PD DDIs. In the future, we are going to solve these limi-tations and improve our method.
Our method more accurately predicts PD DDIs than previous methods. In addition, PD DDI-associated genes from our method can be used to interpret the causes of PD DDIs and prevent them. Therefore, we expect that our method will be helpful in predicting and prevent-ing PD DDIs at an early stage of drug development.
Supporting Information
S1 Fig. Research framework.Our research framework can be categorized into three parts such as data preprocessing part, algorithm part, and validation and analysis part.
(EPS)
S2 Fig. ROC curve with AUC in DrugBank and KEGG DRUG for comparison with the SPA method using HPRD.The red and blue line represents our method and SPA method. (A) The ROC curve with the AUC of our method and SPA method in DrugBank. (B) The ROC curve with the AUC of our method and SPA method in KEGG DRUG. The AUC of our method and SPA method in each PD DDI database: 0.863 and 0.783 in DrugBank, 0.812 and 0.719 in KEGG DRUG. The result showed that our method outperformed the SPA method. (EPS)
S3 Fig. ROC curve with AUC in DrugBank and KEGG DRUG for comparison with the SPA method using I2D.The red and blue line represents our method and SPA method. (A) The ROC curve with the AUC of our method and SPA method in DrugBank. (B) The ROC curve with the AUC of our method and SPA method in KEGG DRUG. The AUC of our method and SPA method in each PD DDI database: 0.856 and 0.773 in DrugBank, 0.81 and 0.714 in KEGG DRUG. The result showed that our method outperformed the SPA method. (EPS)
S4 Fig. ROC curve with AUC in DrugBank and KEGG DRUG for comparison with the SPA method using IntAct.The red and blue line represents our method and SPA method. (A) The ROC curve with the AUC of our method and SPA method in DrugBank. (B) The ROC curve with the AUC of our method and SPA method in KEGG DRUG. The AUC of our method and SPA method in each PD DDI database: 0.832 and 0.721 in DrugBank, 0.748 and 0.616 in KEGG DRUG. The result showed that our method outperformed the SPA method. (EPS)
S1 Table. Target proteins of ziprasidone, olanzapine, aripiprazole, and quetiapine.25 of 26 targets of quetiapine are the same targets as those of ziprasidone, olanzapine, and aripiprazole in DrugBank.
S2 Table. 306 PD DDI-associated genes of ziprasidone-quetiapine, olanzapine-quetiapine and aripiprazole-quetiapine.Three PD DDIs have same PD DDI-associated genes because ziprasidone, olanzapine, and aripiprazole have same target proteins.
(XLS)
Acknowledgments
We thank members of the Bio-Information System Lab at Korea Advanced Institute of Science and Technology for helpful discussions.
Author Contributions
Conceived and designed the experiments: KP DL. Performed the experiments: KP. Analyzed the data: KP DK SH DL. Contributed reagents/materials/analysis tools: KP DK SH. Wrote the paper: KP DL.
References
1. Gu Q, Dillon CF, Burt VL. Prescription drug use continues to increase: US prescription drug data for 2007–2008. NCHS data brief. 2010;( 42):1–8. PMID:20854747
2. Huang S, Temple R, Throckmorton D, Lesko L. Drug interaction studies: study design, data analysis, and implications for dosing and labeling. Clinical Pharmacology & Therapeutics. 2007; 81(2):298–304.
3. Staffa JA, Chang J, Green L. Cerivastatin and reports of fatal rhabdomyolysis. New England Journal of Medicine. 2002; 346(7):539–40.
4. Meinertz T. Mibefradil—a drug which may enhance the propensity for the development of abnormal QT prolongation. European Heart Journal Supplements. 2001; 3(suppl K):K89–K92.
5. Crowther NR, Holbrook AM, Kenwright R, Kenwright M. Drug interactions among commonly used medi-cations. Chart simplifies data from critical literature review. Canadian Family Physician. 1997; 43:1972. PMID:9386884
6. Gottlieb A, Stein GY, Oron Y, Ruppin E, Sharan R. INDI: a computational framework for inferring drug interactions and their associated recommendations. Molecular systems biology. 2012; 8(1).
7. Percha B, Altman RB. Informatics confronts drug—drug interactions. Trends in pharmacological sci-ences. 2013. doi:10.1016/j.tips.2013.11.005
8. Hinder M. Pharmacodynamic Drug—Drug Interactions. Drug Discovery and Evaluation: Methods in Clinical Pharmacology: Springer; 2011. p. 367–76.
9. Vilar S, Harpaz R, Uriarte E, Santana L, Rabadan R, Friedman C. Drug—drug interaction through molecular structure similarity analysis. Journal of the American Medical Informatics Association. 2012; 19(6):1066–74. doi:10.1136/amiajnl-2012-000935PMID:22647690
10. Lu W, Cheng F, Jiang J, Zhang C, Deng X, Xu Z, et al. FXR antagonism of NSAIDs contributes to drug-induced liver injury identified by systems pharmacology approach. Scientific reports. 2015; 5.
11. Cheng F, Li W, Wang X, Zhou Y, Wu Z, Shen J, et al. Adverse drug events: database construction and in silico prediction. Journal of chemical information and modeling. 2013; 53(4):744–52. doi:10.1021/ ci4000079PMID:23521697
12. Cheng F, Li W, Wu Z, Wang X, Zhang C, Li J, et al. Prediction of polypharmacological profiles of drugs by the integration of chemical, side effect, and therapeutic space. Journal of chemical information and modeling. 2013; 53(4):753–62. doi:10.1021/ci400010xPMID:23527559
13. Cheng F, Zhao Z. Machine learning-based prediction of drug—drug interactions by integrating drug phenotypic, therapeutic, chemical, and genomic properties. Journal of the American Medical Informat-ics Association. 2014; 21(e2):e278–e86. doi:10.1136/amiajnl-2013-002512PMID:24644270
14. Li P, Huang C, Fu Y, Wang J, Wu Z, Ru J, et al. Large-scale exploration and analysis of drug combina-tions. Bioinformatics. 2015: btv080.
15. Tatonetti NP, Patrick PY, Daneshjou R, Altman RB. Data-driven prediction of drug effects and interac-tions. Science translational medicine. 2012; 4(125):125ra31. doi:10.1126/scitranslmed.3003377 PMID:22422992
17. Yıldırım MA, Goh K-I, Cusick ME, Barabási A-L, Vidal M. Drug—target network. Nature biotechnology. 2007; 25(10):1119. PMID:17921997
18. Huang J, Niu C, Green CD, Yang L, Mei H, Han J-DJ. Systematic Prediction of Pharmacodynamic Drug-Drug Interactions through Protein-Protein-Interaction Network. PLoS computational biology. 2013; 9(3):e1002998. doi:10.1371/journal.pcbi.1002998PMID:23555229
19. Kelley BP, Sharan R, Karp RM, Sittler T, Root DE, Stockwell BR, et al. Conserved pathways within bac-teria and yeast as revealed by global protein network alignment. Proceedings of the National Academy of Sciences. 2003; 100(20):11394–9.
20. Yeh C-Y, Yeh H-Y, Arias CR, Soo V-W. Pathway detection from protein interaction networks and gene expression data using color-coding methods and A*search algorithms. The Scientific World Journal. 2012; 2012.
21. I2D: Interologous Interaction Databasehttp://ophid.utoronto.ca/ophidv2.204/.
22. Schaefer MH, Fontaine J-F, Vinayagam A, Porras P, Wanker EE, Andrade-Navarro MA. HIPPIE: Inte-grating protein interaction networks with experiment based quality scores. PLoS One. 2012; 7(2).
23. Hermjakob H, Montecchi-Palazzi L, Lewington C, Mudali S, Kerrien S, Orchard S, et al. IntAct: an open source molecular interaction database. Nucleic acids research. 2004; 32(suppl 1):D452–D5.
24. Brown KR, Jurisica I. Online predicted human interaction database. Bioinformatics. 2005; 21(9):2076– 82. PMID:15657099
25. Kanehisa M, Goto S. KEGG: kyoto encyclopedia of genes and genomes. Nucleic acids research. 2000; 28(1):27–30. PMID:10592173
26. Prasad TK, Goel R, Kandasamy K, Keerthikumar S, Kumar S, Mathivanan S, et al. Human protein refer-ence database—2009 update. Nucleic acids research. 2009; 37(suppl 1):D767–D72.
27. Knox C, Law V, Jewison T, Liu P, Ly S, Frolkis A, et al. DrugBank 3.0: a comprehensive resource for ‘omics’research on drugs. Nucleic acids research. 2011; 39(suppl 1):D1035–D41.
28. Köhler S, Bauer S, Horn D, Robinson PN. Walking the interactome for prioritization of candidate dis-ease genes. The American Journal of Human Genetics. 2008; 82(4):949–58. doi:10.1016/j.ajhg.2008. 02.013PMID:18371930
29. Hwang W, Hwang Y, Lee S, Lee D. Rule-based multi-scale simulation for drug effect pathway analysis. BMC medical informatics and decision making. 2013; 13(Suppl 1):S4. doi: 10.1186/1472-6947-13-S1-S4PMID:23566173
30. Kuhn M, Campillos M, Letunic I, Jensen LJ, Bork P. A side effect resource to capture phenotypic effects of drugs. Molecular systems biology. 2010; 6(1).
31. Kuhn M, Szklarczyk D, Franceschini A, von Mering C, Jensen LJ, Bork P. STITCH 3: zooming in on pro-tein—chemical interactions. Nucleic acids research. 2012; 40(D1):D876–D80.
32. Li Y, Patra JC. Genome-wide inferring gene—phenotype relationship by walking on the heterogeneous network. Bioinformatics. 2010; 26(9):1219–24. doi:10.1093/bioinformatics/btq108PMID:20215462
33. Re M, Valentini G. Random walking on functional interaction networks to rank genes involved in cancer. Artificial Intelligence Applications and Innovations: Springer; 2012. p. 66–75.
34. Lovász L. Random walks on graphs: A survey. Combinatorics, Paul erdos is eighty. 1993; 2(1):1–46.
35. Huang DW, Sherman BT, Lempicki RA. Bioinformatics enrichment tools: paths toward the comprehen-sive functional analysis of large gene lists. Nucleic acids research. 2009; 37(1):1–13. doi:10.1093/nar/ gkn923PMID:19033363
36. Hopkins AL. Network pharmacology: the next paradigm in drug discovery. Nature chemical biology. 2008; 4(11):682–90. doi:10.1038/nchembio.118PMID:18936753
37. Campillos M, Kuhn M, Gavin A-C, Jensen LJ, Bork P. Drug target identification using side-effect similar-ity. Science. 2008; 321(5886):263–6. doi:10.1126/science.1158140PMID:18621671