Albanian j. agric. sci. 2014 (Special edition) Agricultural University of Tirana
RESEARCH ARTICLE
(Open Access)
Morphological characterization of pea (
Pisum sativum
L.) genotypes
stored in Albanian genebank
BELUL GIXHARI1*, HEKURAN VRAPI2, VALBONA HOBDARI1
1
Albanian Gene Bank, Agricultural University of Tirana, Tirana, Albania
3
Plant Protection Departments, Agricultural University of Tirana, Tirana, Albania
* Corresponding author e-mail: gixharibelul@ubt.edu.al
Abstract
Study for characterization of genetic diversity present in the pea germplasm stored in Albanian genebank was carried out in the Experimental Field of Agriculture University of Tirana during three growing seasons (2010, 2011, and 2012). The study analyzed 12 local pea (Pisum sativum L.) genotypes of different origins for 23 quantitative morphological characters and had the objective to characterize and select those with favourable characteristics for use in breeding programs. ANOVA, PCA and cluster analysis reveal considerable extent of diversity, and the association among different traits. Most of the quantitative morphological characters showed significant differences among important agro economic traits. Cluster analysis for morphological data divide the whole pea genotypes into three groups in respect of genetic diversity and similarity among pea accessions of different origin. Relationships analysis between the morphological characters and pea genotypes using Principal Coordinates’ analyses show that there are nine morphological characters with larger values in PC1 that account for 57.4% of total variance. The study identifies traits with agronomic interest which account for genetic diversity and the demarcation of distinguishable morphological groups which will facilitate the maintenance and agronomic evaluation of the collections.
Key-words: Clusters analysis, genetic diversity, morphological pea characters.
1. Introduction
Pea (Pisum sativum L.) is an important food legume in the temperate and elevated sub-tropical cropping zones, grown as dry grain, green unripe fresh grain for vegetable use and for canning, and as green leaves [11] and for fodder. The total world grain production fluctuates 10 – 12 million metric tonnes, with Canada as the leading producer, followed by USA, India, Russia, France, and China [16].
Four centres of origin based on genetic diversity proposed by Vavilov [20] were Central Asia, the near East, Abyssinia (Ethiopia) and the Mediterranean. Pea (Pisum sativum L.) is one among the most old plant crops used by humankind. Archaeological evidence dates the existence of pea back to 10,000 B.C. in Near East and Central Asia [1, 22]. Pea among other grain legumes accompanied cereals and formed important dietary components of early civilizations in Middle East and Mediterranean. In Europe, it has been cultivated since the Stone and Bronze Ages and in India from 200 B.C. [5].
The demand for productivity and homogeneity in pea, as in other crops, has resulted in a limited number of standard, high-yielding varieties, at the price of the loss of heterogeneous traditional local varieties (landraces), a process known as genetic erosion. Zong
et al. [23] reports the presence of significant gaps of the wild and landraces of pea forms collected and stored in ex situ status in genebanks. Baranger et al., [2] also report considerable loss of pea landraces and of genetic variability in European countries and other areas.
Traditionally, germplasm diversity is evaluated by morphological descriptors [18, 19]. Morphological characterization is the first step in the description and classification of the germplasm [14]. An understanding of morphological characters facilitate the identification, selection of desirable traits, designing new populations, in transferring their desirable genes into widely grown food legumes through biotechnological means, resistance to biotic and a biotic stresses that are known to individual accessions increase the importance of the germplasm [12]. Different studies about genetic diversity in the
realized based on characterization and evaluation of morphological quantitative and qualitative characters.
The aim of the study was to identify the similarity and to analyse the level of genetic diversity among and within of pea (P. sativum L.) accessions stored ex situ collection of legumes in Albania genebank, using morphological traits, to aid in the selection and more efficient use of this germplasm in breeding programs.
2. Material and methods
Plant materials and experimental site: Twelve peas (P. sativum L.) genotypes, six with known and six with unknown origin were used for characterization and evaluation of genetic diversity. Three pea genotypes (BGJR5, BGJR10, BGJR12) were from Albania, one from Russia (BGJ1590), one from Germany (BGJR137), one from Sweden (BGJR2507) and six other (BGJR1583, BGJR1585, BGJR1586, BGJR1587, BGJR1588, BGJR1589) have unknown origin. The study was carried out at the experimental field of Agriculture University of Tirana (latitude: 402405N; longitude: 0194108E; elevation: 40m) during three growing seasons (2010, 2011 and 2012) to characterize 12 accession of pea from different origin. The experimental scheme was randomized block design with four replications. All observations and measurement were realized on 20 plants per plot (80 plants per accessions) situated under the same field and soil conditions.
Morphological characters: Twenty three following morphological quantitative characters: the stem length (STL), number of nodes including first fertile node (NNod), maximum number of leaflets (MxNLL), leaflet size (LLS), leaflet length (LLL) and width (LLW), leaflet position of broadest part (LLP), Stipule length (StL), stipule width (StW), stipule size (StS), stipule length from axil to tip (StLax-t), length of lobe below axil (StLlob-ax), petiole length from axil to first tendril (PtLax-firstT) and petiole length from axil to last tendril (PtLax-lastT), peduncle length of spur (PedLsp), peduncle length from stem to first pod (PedL-1P) and peduncle length between first and second pods (PedL1P-2P), pod length (PL) and width (PW), number of seed per pod (NSP), Weight of seeds per plant (WSpPL), weight of 1000 seeds (W100-S) and yield per genotype (YpG), were used to characterize and estimate genetic diversity of local pea genotypes stored in genebank, using pea (Pisum sativum L.) UPOV method [19].
Statistical analysis: To identify the weight of each character principal component analysis (PCA)
was used. The number of principal components to retain in the analysis was determined using the minimum eigenvalue criterion proposed by Kaiser [9]. Cluster analysis carried out on the matrix of Euclidean distances generates a dendrogram using Ward method. All the statistical procedures for morphological traits were obtained using the SAS Institute Inc. JMP® 10 [13].
3. Results and discussion
ANOVA analysis shows the presence of an important variability in the study materials. High degree of variation was observed for all the morphological characters. There were significant differences between pea genotypes related to NNod, leaflets characters (LLL, LLW and LLP), PtLax-firstT, PtLax-lastT, PedLST-1P and PedL1P-2P, pod characters (PL, PW and NSP), W100-S, StW and YpG. All these characters were significant at the probability 0.0001* < 0.005. There were also significant differences between pea genotypes related to STL, LLS, and WSpPL characters (significant at the respectively probabilities 0.0013*, 0.0476*, 0.0435*, < 0.005).
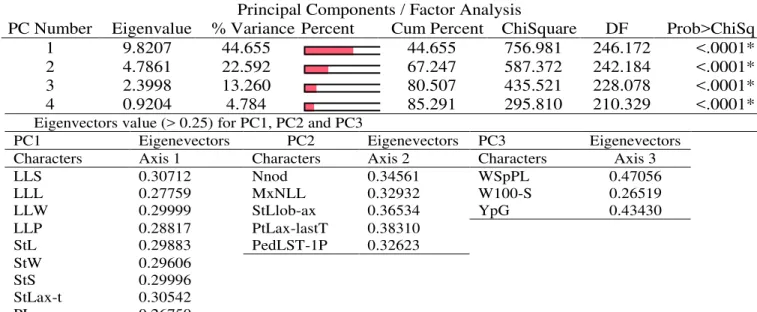
Tale 1. Matrix of eigenvalues and vectors of three PC (12 pea genotypes x 17 quantitative characters)
Three-dimensional scaling of the most important morphological characters relationships that accounts for the larger proportion of the total variance in PC1, PC2, and PC3 revealed by Principal Cordinates (PCo) analyses show that the morphological characters with larger values in PC1 were LLL, LLS, LLP, LLW, StS,
StL, StW, StLax-t and PL that account for 57.4% of PC1 variance. There are five characters in PC2 (NNod, MxNLL, PtLax-lastT, PedLST-1P and StLlob-ax) that account for 36.5% of PC2 variance (Figure 1).
Figure 1. Three-dimensional relationship among the most important morphological characters
Analysis of genetic distances and the relationships comparisons between 12 pea genotypes and the most important morphological characters using Principal Cordinates (PCo) analyses allow for a more efficient plant evaluation by reducing the number of plant biometric characteristics using the factorial analysis methods (PCA, PCo, and cluster) (Figure 2). This along with the similarity index between pea genotypes would increase the breeding efficiency by focusing only on the unique genetic traits, which could reduce the number of accession
stored in genebank for further consideration. Genetic similarity/dissimilarity distances evaluated by combination of morphological quantitative characters using cluster analysis (Ward method) show the presence of similarity and differences/distances between Albanian local pea genotypes registered in database with known or unknown origin (Figure 2). Cluster analysis (Ward method), range pea genotypes into three different cluster groups. There are three sub-clusters in the first cluster group. Relationship between 12 pea genotypes and morphological Principal Components / Factor Analysis
PC Number Eigenvalue % Variance Percent Cum Percent ChiSquare DF Prob>ChiSq
1 9.8207 44.655 44.655 756.981 246.172 <.0001*
2 4.7861 22.592 67.247 587.372 242.184 <.0001*
3 2.3998 13.260 80.507 435.521 228.078 <.0001*
4 0.9204 4.784 85.291 295.810 210.329 <.0001*
Eigenvectors value (> 0.25) for PC1, PC2 and PC3
PC1 Eigenevectors PC2 Eigenevectors PC3 Eigenevectors
Characters Axis 1 Characters Axis 2 Characters Axis 3
LLS 0.30712 Nnod 0.34561 WSpPL 0.47056
LLL 0.27759 MxNLL 0.32932 W100-S 0.26519
LLW 0.29999 StLlob-ax 0.36534 YpG 0.43430
LLP 0.28817 PtLax-lastT 0.38310
StL 0.29883 PedLST-1P 0.32623
StW 0.29606
StS 0.29996
StLax-t 0.30542
quantitative traits (Figure 2) show that nine pea genotypes included in PC1 account for 29.8% of the total variance and generate 3 clusters: first sub-cluster include BGj1586, BGjR10 and BGjR5 genotypes; second sub-cluster BGj1589, BGj2507 and BGj1587, and the third sub-cluster BGj1583, BGj1590 and BGj137. On the first sub-cluster pea genotypes similar among them as BGjR10 and BGjR5 (from Albania), show similarity with BGj1586 genotype (with unknown origin). On the second sub-cluster two genotypes with unknown origin (BGj1589,
BGj1587) show similarity with BGj2507 originated from Sweden, and on the third sub-cluster there were similarity between three pea genotypes (BGj1590 from Russia, BGj137 from Germany and BGj1583 with unknown origin). Pea genotypes as BGj1585and BGj1588 (with unknown origin) seem to be different from others as they form each one a cluster (Figure 2). These pea genotypes show different characteristics and significant differences with pea genotypes originated from Albania.
Figure 2. Relationship among pea genotypes revealed by Principal Cordinates and cluster analyses
4. Conclusion
The study results permitted the first characterization of the most important morphological characters, analysed genetic diversity, and determination of the patterns or variation of pea genotypes with high value. Factorial analysis results show that the first three PCs account for a substantial proportion of total variation, 80.5%. The percentages of total variation accounted for by each of the fourth PCs were 44.6%, 22.6%, and 13.3% respectively. Three-dimensional scaling for relationships between the morphological characters show that there are nine morphological characters with larger values in PC1 (LLL, LLS, LLP, LLW, StS, StL, StW, StLax-t and PL) that account for 57.4% of total variance and five characters in PC2 (NNod, MxNLL, PtLax-lastT, PedLST-1P and StLlob-ax) that account for 36.5% of total variance. Cluster analysis clearly range pea genotypes into three different cluster groups and allows the identification of similarities between pea genotypes with ‘unknown’ origin or ‘donation’ from
other countries, recorded in pea database without specific origin.
5. References
1. Baldev B, Origin, distribution, taxonomy, and morphology. In: Pilsecrops: Baldev B, Ramanujam S, and Jain H.H, New Delhi, India: Oxfordant IBH Publshing Co.; 1988, Pp. 3-5.
2. Baranger A, Aubert G, Arnau G, Laine A.L, Denoit G, Potier J, Weinachter C, Lejeune-Henaut I, Lallemand J, Burstin J, Genetic diversity within Pisum sativum using protein- and
PCR-based markers. Theor. Appl. Genet. 2004, (108): 1309-1321.
3. Cadima J.F.C.L, Jolliffe I.T: Variable selection and the interpretation of principal subspaces.
J. Agri. Biol. Environ. Statist: 2001, (6): 62–79. 4. Cupic T, Tucak M, Popovic S, Bolaric S, Grljusic
S, and Kozumplik V: Genetic diversity of pea
(Pisum sativum L.) genotypes assessed by
5. De Candolle A: Origine des plantes cultivées. Paris, Germer Baillière. 1882: (8): 368-379. 6. Hoey B.K, Crowe K.R, Jones V.M, and Polans
N.O: A phylogenetic analysis of Pisum based on
morphological characters, and allozyme and RAPD markers. Theor. Appl. Genet. 1996, (92): 92–100.
7. Jing R, Ambrose M.A, Knox M.R, Smykal P, Hybl M, Ramos A, Caminero C, Burstin J, Duc G, van Soest L.J.M, Swiecicki W.K, Pereira M.G, Vishnyakova M, Davenport G.F, Flavell A.J, Ellis T.H.N: Genetic diversity in European Pisum germplasm collections. Theor. Appl. Genet. 2012, (125-2): 367-380.
8. Jolliffe I.T: Principal Component Analysis,
Second edition, p.cm-Springer Series in Statistics. USA, 2002.
9. Kaiser H.F: The application of electronic computers to factor analysis. Educational and Psychological Measurement, 1960, (20), 141-151. 10. Loridon K, McPhee K, Morin J, Dubreuil P,
Pilet-Nayel M.L, Aubert G, Rameau C, Baranger A, Coyne C, Lejeune-He`naut I, Burstin J:
Microsatellite marker polymorphism and mapping in pea (Pisum sativum L.). Theor.
Appl. Genet. 2005, (111): 1022-1031.
11. Muehlbauer F.J, Redden R.J, Nassib A.M, Robertson L.D, and Smithson J.B: Population improvement in pulse crops: an assessment of methods and techniques. In: Summerfield R.J, (ed.), World Crops: Cool Season Food Legumes. Kluwer Academic Publishers, Dordrecht, The Netherlands. 1988, Pp. 943-966.
12. Santalla M, Amurrio J.M, De Ron A.M, 2001.
Food and feed potential breeding value of green, dry and vegetable peagermplasm. Can. J. Plant Sci. 2001, (81): 601-610.
13. SAS Institute Inc. JMP® 10 Modeling and Multivariate Methods. Cary, NC: SAS Institute Inc. 2012, (10): 469-512
14. Smith J.S, and Smith O.S: The description and assessment of distance between inbreed lines of maize. The utility of morphological, biochemical and genetic descriptors and a
scheme for testing of distinctiveness between inbreed lines. Maydica, 1989, (34): 151-161. 15. Smýkal P, Hybl M, Corander J, Jarkovsky J,
Andrew J. F, Griga M: Genetic diversity and population structure of pea (Pisum sativum L.)
varieties derived from combined retrotransposon, microsatellite and morphological marker analysis. Theor. Appl. Genet., 2008, (117): 413-424.
16. Smýkal P, Aubert G, Burstin J, Coyne C.J, Ellis N.T.H, Flavell A.J, Rebecca F, Hybl M, Macas J, Neumann P, McPhee K.E, Redden R.J, Rubiales D, Weller J.L, and Warkentin T. D: Pea (Pisum
sativum L.) in the Genomic Era, Agronomy,
2012, (2): 74-115.
17. Tar’an B, Zhang C, Warkentin T, Tullu A, and Vanderberg A: Genetic diversity among varieties and wild species accessions of pea
(Pisum sativum) based on molecular markers,
and morphological and physiological characters. Genome, 2005 (48): 257-272.
18. UPOV: Guidelines for the Conduct of Tests for Distinctness, Homogeneity, and Stability.
Document UPOV TG/4/7. Geneva, Switzerland, 1990.
19. UPOV: International Union for the protection of New Varieties of Plants. Guidelines for the conduct of tests for distinctness, uniformity and stability. UPOV TG/7/10. Geneva, Switzerland, 2009.
20. Vavilov N.I: Studies on the origin of cultivated plants. Bulletin of Applied Botany Leningrad. 1926, (26):
21. Zohary D, Hopf M: Domestication of pulses in the old world. Science, 1973, (182):887-894.
22.
Zohary D, Hopf M: Domestication of plants in the Old World. New York: Oxford University Press. 2000.23.
Zong X, Redden R, Liu Q, Wang S, Guan J, Liu J, Xu Y, Liu X, Gu J, Yan L, Ades P, Ford R:Analysis of a diverse global Pisum sp.
collection and comparison to a Chinese local P.
sativum collection with microsatellite markers.