Genetic diversity analysis in the section
Caulorrhizae
(genus
Arachis
)
using microsatellite markers
Darío A. Palmieri
1, Marcelo D. Bechara
2, Rogério A. Curi
3, Jomar P. Monteiro
4, Sérgio E.S. Valente
5,
Marcos A. Gimenes
6and Catalina R. Lopes
71
Departamento de Ciências Biológicas, Faculdade de Ciências e Letras de Assis,
Universidade Estadual Paulista, UNESP, Assis, SP, Brazil.
2
Universidade de Marília, Marília,SP, Brazil.
3Departamento de Melhoramento e Nutrição Animal, Faculdade de Medicina Veterinária e Zootecnia,
Universidade Estadual Paulista ‘Júlio de Mesquita Filho’, Botucatu, SP, Brazil.
4
Department of Medicine, Division of Infectious Diseases and Geographic Medicine, Stanford University,
Stanford, CA,USA.
5
Departamento de Biologia, Centro de Ciências da Natureza, Universidade Federal do Piauí, Teresina,
PI, Brazil.
6
Embrapa Recursos Genéticos e Biotecnologia, Brasília, DF, Brazil.
7
Departamento de Genética, Instituto de Biociências,
Universidade Estadual Paulista ‘Júlio de Mesquita Filho’, Botucatu, SP, Brazil.
Abstract
Diversity in 26 microsatellite loci from sectionCaulorrhizae germplasm was evaluated by using 33 accessions of A. pintoi Krapov. & W.C. Gregory and ten accessions of Arachis repens Handro. Twenty loci proved to be polymorphic and a total of 196 alleles were detected with an average of 9.8 alleles per locus. The variability found in those loci was greater than the variability found using morphological characters, seed storage proteins and RAPD markers previ-ously used in this germplasm. The high potential of these markers to detect species-specific alleles and discriminate among accessions was demonstrated. The set of microsatellite primer pairs developed by our group forA. pintoi are useful molecular tools for evaluating SectionCaulorrhizae germplasm, as well as that of species belonging to other Arachis sections.
Key words: Arachis, genetic diversity, germplasm, microsatellites, molecular markers.
Received: December 9, 2008; Accepted: October 7, 2009.
Introduction
The genusArachis comprises nine taxonomic sec-tions, viz., Arachis, Caulorrhizae, Erectoides, Extranervosae, Heteranthae, Procumbentes, Rhizomatosae, Trierectoides and Triseminatae, (Krapovickas and Gregory (1994), and includes both an-nual and perennial species. In this genus, most secies are acceptable as versatile forage plants. Nevertheless, more recent studies have provided abundant information on the potential and effective commercial use of accessions from the sections Caulorrhizae and Rhizomatosae (Loch and Ferguson, 1999; Teguia, 2000). Section Caulorrhizae is
represented by only two stoloniferous species, Arachis pintoi Krapov. & Gregory and Arachis repens Handro. Both are native of valleys of the rivers Jequitinhonha, Araçuai, São Francisco and Paranã, the latter a tributary of the Tocantins, in Central Brazil.
Arachis pintoiis assuming increasing importance in the production of forage in tropical and sub-tropical areas, whereasA. repensis used as an ornamental plant, as well as for ground-cover in substitution of several species of com-mon grass. Most of their cultivars were based on the two original accessions, A. pintoi GK12787 and A. repens GKP10538, which apparently represent extreme morpho-logical types, with the occurrence of intermediate forms (Valls and Simpson, 1994). The basic use of theA. pintoi GK 12787 accession has been for developing forage cultivars in Australia, Bolivia, Brazil, Colombia, Costa Rica, Honduras and Venezuela (Valls, 1996).
www.sbg.org.br
Send Correspondence to Darío A. Palmieri. Departamento de Ciências Biológicas, Faculdade de Ciências e Letras de Assis, Universidade Estadual Paulista ‘Júlio de Mesquita Filho’, Av. Dom Antônio 2100, Parque Universitário, 19806-900 Assis, SP, Brazil. E-mail: [email protected].
Lately, the number of accessions available in both species has increased, with the current maintenance of over 150 in the Arachis Germplasm Bank (EMBRAPA Recursos Genéticos e Biotecnologia, Brasília, DF, Brazil). Furthermore, a program for agronomic appraisal and pro-duction of intra- and inter-specific hybrids from section Caulorrhizae, as well as progenies from accessions with high forage potential, has been developed (Carvalho S, PhD Thesis, UNESP, São Paulo, 2000). The significant ge-netic variability in available germplasm, both in accessions and hybrids, requires conservation, investigation and eco-nomical exploitation (Gimeneset al., 2000).
Several genetic markers have been used to estimate the genetic variability in species of sectionCaulorrhizae, including morphological characters (Monçato L, MSc Dis-sertation, UNESP, São Paulo, 1995), seed storage proteins (Bertozo and Valls, 2001), isozymes (Maasset al., 1993) and RAPDs (Gimenes et al., 2000) These markers were useful for the characterization of genetic variation in both species, but they offered limited informative content since some detected low levels of polymorphism (morphological characters, isozymes and seed proteins). RAPDs, on the other hand, yielded more complex band patterns (RAPDs). Due to their limitations, these markers were incapable of providing relevant information regarding important points for the conservation and use of the species, such as an esti-mate of the cross-pollination rate, identification of hybrids among species, and accurate estimation of genetic variabil-ity.
Microsatellites or simple sequence repeats (SSRs), the most informative molecular markers, have not been ex-tensively used with sectionCaulorrhizaespecies (Palmieri et al., 2002; 2005). These sequences, besides being abun-dant and distributed throughout eukaryotic genomes, are highly polymorphic, inherited codominantly and reproduc-ible, with simple screening requirements (Rosseto et al., 2002). The high polymorphism in microsatellite loci is due to DNA polymerase slippage during replication, and (or) unequal crossing-over, thereby resulting in differences in the copy numbers of the core sequences (Schlötterer and Tautz, 1992). Microsatellites have been extensively used in genetic mapping and genome analysis (Brondani et al., 1998; Liet al., 2000), genotype identification, variety pro-tection (Giancola et al., 2002), seed purity evaluation, germplasm characterization (Brownet al., 1996; Hokanson et al., 1998), diversity studies (Métais et al., 2002), marker-assisted breeding (Weissinget al., 1998), and gene and quantitative trait loci analysis (Fahima et al., 1998; Brondaniet al., 2002).
From recent studies, 18 microsatellite markers from A. pintoihave been described. The utility of these markers in evaluating genetic variability in sectionCaulorrhizae (20 accessions ofA. pintoiand five ofA. repens) has been demonstrated (Palmieriet al., 2002, 2005). In the present study, we used 19 previously described microsatellite
markers and seven new primer pairs to estimate genetic variation in accessions ofA. pintoiandA. repens.
Material and Methods
Plant material
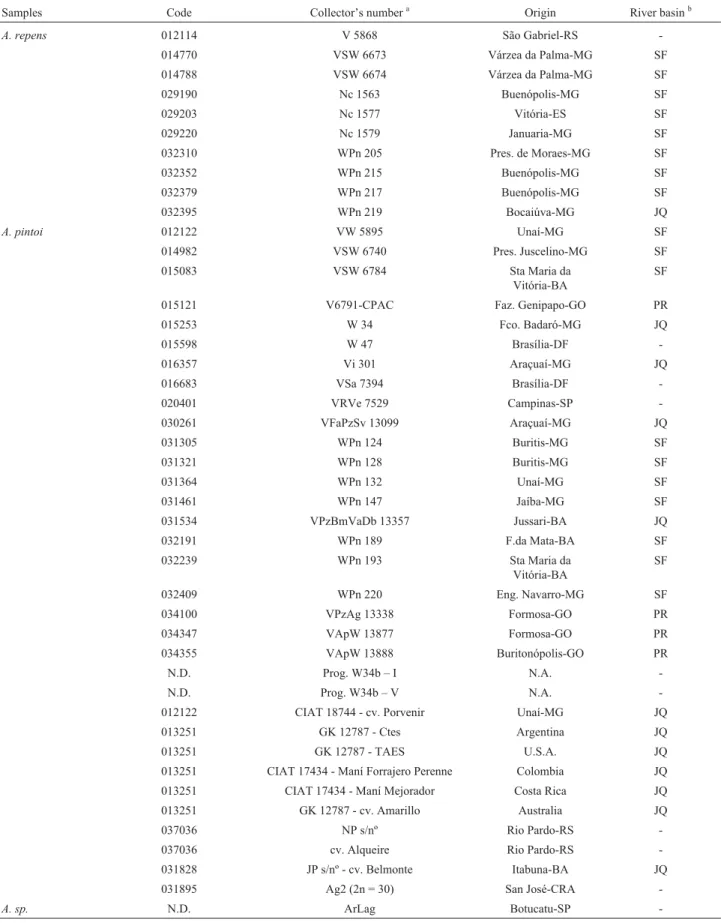
Thirty-three accessions of A. pintoi and ten of A. repens were analyzed (Table 1). The samples were ob-tained from Dr. José F.M. Valls, curator of WildArachis Germplasm Bank, EMBRAPA Recursos Genéticos e Bio-tecnologia, Brasília, DF, Brazil, and from Dr. Sandremir de Carvalho, the Fundação Faculdade de Agronomia “Luiz Meneghel”, Bandeirantes, PR, Brazil. In the ArLag (Arachis sp.) accession, collected at Botucatu, SP, Brazil, the morphological type appeared to be closer toA. repens accessions, although definitive botanical identification was not possible.
Source of microsatellites primer pairs
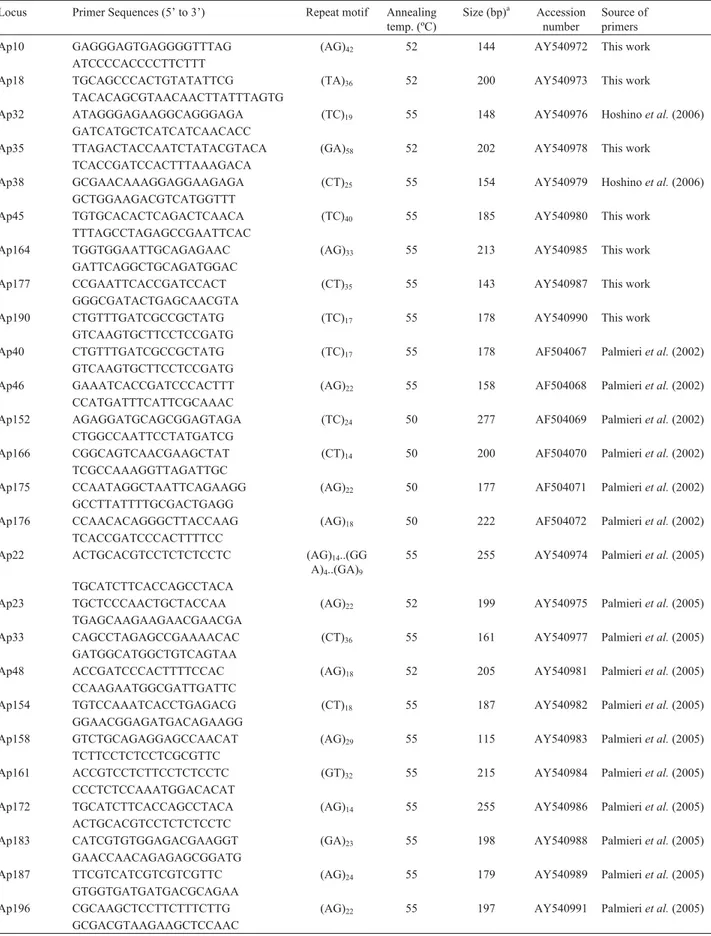
Nineteen primer pairs had already been described by Palmieriet al.(2002, 2005) and Hoshinoet al.(2006), and seven new ones are described herein (Table 2). All the microsatellites used were isolated by applying library-enrichment protocol adapted from Kijaset al.(1994). The Primer 3 (Rozen and Skaletsky, 2000) program was em-ployed for designing all the primer pairs, according to the following criteria: Tm of 50 to 60 °C (Tm difference be-tween each primer within a pair was maintained below 3 °C), length of PCR products ranging from 100 to 350 bp and GC-content maintained around 50%. All primer pairs were synthesized by Invitrogen, SP, Brazil. BLAST searches were performed for all microsatellite sequences using blastx program to determine whether the micro-satellites were associated with conserved gene regions (Altschulet al., 1997). These searches were based on the full-length sequence from which the primer pairs were de-signed.
DNA extraction
Genomic DNA was extracted using the protocol de-scribed by Grattapaglia and Sederoff (1994) with minor modifications as to DNA precipitation. DNA quality was checked with electrophoresis in 1% agarose gels, and con-centration estimated by spectrophotometry (Spectronic, Inc., Rochester, NY, USA).
DNA amplification and electrophoresis
PCR reactions contained 15 ng of genomic DNA, 1U ofTaqDNA polymerase (Amersham Biosciences), 1x PCR buffer (200 mM Tris pH 8.4, 500 mM KCl), 1.5-2.0 mM MgCl2, 200mM of each dNTP, and 0.4mM of each primer,
Table 1- Germplasm of sectionCaulorrhizaeanalyzed in this study.
Samples Code Collector’s numbera Origin River basinb
A. repens 012114 V 5868 São Gabriel-RS
-014770 VSW 6673 Várzea da Palma-MG SF 014788 VSW 6674 Várzea da Palma-MG SF
029190 Nc 1563 Buenópolis-MG SF
029203 Nc 1577 Vitória-ES SF
029220 Nc 1579 Januaria-MG SF
032310 WPn 205 Pres. de Moraes-MG SF
032352 WPn 215 Buenópolis-MG SF
032379 WPn 217 Buenópolis-MG SF
032395 WPn 219 Bocaiúva-MG JQ
A. pintoi 012122 VW 5895 Unaí-MG SF
014982 VSW 6740 Pres. Juscelino-MG SF 015083 VSW 6784 Sta Maria da
Vitória-BA
SF
015121 V6791-CPAC Faz. Genipapo-GO PR
015253 W 34 Fco. Badaró-MG JQ
015598 W 47 Brasília-DF
-016357 Vi 301 Araçuaí-MG JQ
016683 VSa 7394 Brasília-DF
-020401 VRVe 7529 Campinas-SP
-030261 VFaPzSv 13099 Araçuaí-MG JQ
031305 WPn 124 Buritis-MG SF
031321 WPn 128 Buritis-MG SF
031364 WPn 132 Unaí-MG SF
031461 WPn 147 Jaíba-MG SF
031534 VPzBmVaDb 13357 Jussari-BA JQ
032191 WPn 189 F.da Mata-BA SF
032239 WPn 193 Sta Maria da Vitória-BA
SF
032409 WPn 220 Eng. Navarro-MG SF
034100 VPzAg 13338 Formosa-GO PR
034347 VApW 13877 Formosa-GO PR
034355 VApW 13888 Buritonópolis-GO PR
N.D. Prog. W34b – I N.A.
-N.D. Prog. W34b – V N.A.
-012122 CIAT 18744 - cv. Porvenir Unaí-MG JQ 013251 GK 12787 - Ctes Argentina JQ
013251 GK 12787 - TAES U.S.A. JQ
013251 CIAT 17434 - Maní Forrajero Perenne Colombia JQ 013251 CIAT 17434 - Maní Mejorador Costa Rica JQ 013251 GK 12787 - cv. Amarillo Australia JQ
037036 NP s/nº Rio Pardo-RS
-037036 cv. Alqueire Rio Pardo-RS -031828 JP s/nº - cv. Belmonte Itabuna-BA JQ 031895 Ag2 (2n = 30) San José-CRA
-A. sp. N.D. ArLag Botucatu-SP
-a
Collectors – Ap = A. Peñaloza, Bm = B. Maass, Db = M. Bechara, Fa = L. Faraco, Nc = N. Costa, NP = N. Perez, Pn = P. Pinheiro, Pz = E. Pizarro, R = V. Rao, S = C. Simpson, Sa = J. Santos, Sv = Silva, Ve = R. Veiga, Vi = J. Vieira, V = J. Valls, Va = S. Valente, W = W. Werneck.
b
Table 2- Primer sequences, characteristics and source of the 26 microsatellite loci used in estimating genetic variation in germplasm of section
Caulorrhizae.
Locus Primer Sequences (5’ to 3’) Repeat motif Annealing temp. (ºC)
Size (bp)a Accession number
Source of primers Ap10 GAGGGAGTGAGGGGTTTAG (AG)42 52 144 AY540972 This work
ATCCCCACCCCTTCTTT
Ap18 TGCAGCCCACTGTATATTCG (TA)36 52 200 AY540973 This work
TACACAGCGTAACAACTTATTTAGTG
Ap32 ATAGGGAGAAGGCAGGGAGA (TC)19 55 148 AY540976 Hoshinoet al.(2006)
GATCATGCTCATCATCAACACC
Ap35 TTAGACTACCAATCTATACGTACA (GA)58 52 202 AY540978 This work
TCACCGATCCACTTTAAAGACA
Ap38 GCGAACAAAGGAGGAAGAGA (CT)25 55 154 AY540979 Hoshinoet al.(2006)
GCTGGAAGACGTCATGGTTT
Ap45 TGTGCACACTCAGACTCAACA (TC)40 55 185 AY540980 This work
TTTAGCCTAGAGCCGAATTCAC
Ap164 TGGTGGAATTGCAGAGAAC (AG)33 55 213 AY540985 This work
GATTCAGGCTGCAGATGGAC
Ap177 CCGAATTCACCGATCCACT (CT)35 55 143 AY540987 This work
GGGCGATACTGAGCAACGTA
Ap190 CTGTTTGATCGCCGCTATG (TC)17 55 178 AY540990 This work
GTCAAGTGCTTCCTCCGATG
Ap40 CTGTTTGATCGCCGCTATG (TC)17 55 178 AF504067 Palmieriet al.(2002)
GTCAAGTGCTTCCTCCGATG
Ap46 GAAATCACCGATCCCACTTT (AG)22 55 158 AF504068 Palmieriet al.(2002)
CCATGATTTCATTCGCAAAC
Ap152 AGAGGATGCAGCGGAGTAGA (TC)24 50 277 AF504069 Palmieriet al.(2002)
CTGGCCAATTCCTATGATCG
Ap166 CGGCAGTCAACGAAGCTAT (CT)14 50 200 AF504070 Palmieriet al.(2002)
TCGCCAAAGGTTAGATTGC
Ap175 CCAATAGGCTAATTCAGAAGG (AG)22 50 177 AF504071 Palmieriet al.(2002)
GCCTTATTTTGCGACTGAGG
Ap176 CCAACACAGGGCTTACCAAG (AG)18 50 222 AF504072 Palmieriet al.(2002)
TCACCGATCCCACTTTTCC
Ap22 ACTGCACGTCCTCTCTCCTC (AG)14..(GG
A)4..(GA)9
55 255 AY540974 Palmieriet al.(2005)
TGCATCTTCACCAGCCTACA
Ap23 TGCTCCCAACTGCTACCAA (AG)22 52 199 AY540975 Palmieriet al.(2005)
TGAGCAAGAAGAACGAACGA
Ap33 CAGCCTAGAGCCGAAAACAC (CT)36 55 161 AY540977 Palmieriet al.(2005)
GATGGCATGGCTGTCAGTAA
Ap48 ACCGATCCCACTTTTCCAC (AG)18 52 205 AY540981 Palmieriet al.(2005)
CCAAGAATGGCGATTGATTC
Ap154 TGTCCAAATCACCTGAGACG (CT)18 55 187 AY540982 Palmieriet al.(2005)
GGAACGGAGATGACAGAAGG
Ap158 GTCTGCAGAGGAGCCAACAT (AG)29 55 115 AY540983 Palmieriet al.(2005)
TCTTCCTCTCCTCGCGTTC
Ap161 ACCGTCCTCTTCCTCTCCTC (GT)32 55 215 AY540984 Palmieriet al.(2005)
CCCTCTCCAAATGGACACAT
Ap172 TGCATCTTCACCAGCCTACA (AG)14 55 255 AY540986 Palmieriet al.(2005)
ACTGCACGTCCTCTCTCCTC
Ap183 CATCGTGTGGAGACGAAGGT (GA)23 55 198 AY540988 Palmieriet al.(2005)
GAACCAACAGAGAGCGGATG
Ap187 TTCGTCATCGTCGTCGTTC (AG)24 55 179 AY540989 Palmieriet al.(2005)
GTGGTGATGATGACGCAGAA
Ap196 CGCAAGCTCCTTCTTTCTTG (AG)22 55 197 AY540991 Palmieriet al.(2005)
GCGACGTAAGAAGCTCCAAC
45 s, 72 °C for 1 min, with a final extension of 10 min at 72 °C. The X value for each primer pair is shown in Table 2. PCR reactions were mixed with equal volumes of loading buffer (95% formamide, 0.01% bromophenol blue, 0.01% xylene cyanol, 0.5% NaOH 0.2 M), denatured at 95 °C for 5 min, cooled on ice and loaded onto the gel. PCR products were separated in denaturing polyacrylamide gels (6% acrylamide/bisacrylamide, 29:1, 5 M urea in TBE, pH 8.3) at 60 W for 4 h in 1x TBE buffer. DNA fragments were vi-sualized by silver staining. The silver staining procedure consisted of 10 min in 10% ethanol/1% acetic acid solution, staining for 15 min in 0.2% (w/v) silver nitrate solution, and rinsing for 30 s in deionized water, and developing in 30 g/L of NaOH/10 mL/L of 37% formaldehyde solution for about 10 min or until bands became visible.
Data collection and analysis
Fragment sizes were estimated by comparison with a 10-bp DNA ladder (Life Technologies) using Gene Profiler 4.03 for Windows software, evaluation edition (Scan-alytics, Inc., Fairfax, VA, USA). Bands with the same mo-bility were considered identical. Assuming the absence of null alleles, the presence of only one fragment of a given microsatellite indicated homozygosis. The Ap172 primer pair amplified a putative duplicate locus, and for this reason the amplification of two independent loci for this marker was considered. PopGene software (version 1.31; Yehet al., 1999) was used to estimate genetic diversity based on the following indexes: polymorphic information content, allele number (observed and effective) per locus, allelic fre-quencies, observed (HO) and expected (HE) heterozygo-sities. Allelic polymorphic information content (PIC) was calculated for each microsatellite locus using the formula: PIC= -1
å
2-å
2 2 2pi i j p pi j
i , , wherepiandpjare the
fre-quencies of theithandjthalleles in the population (Weber, 1990). PIC values provided an estimate of the discrimina-tory power of a marker by taking into account, not only the number of alleles at a locus, but also their relative frequen-cies in the population under study. Markers with a large number of alleles occurring at equal frequencies will al-ways have the highest PIC values (Senioret al., 1998). Ef-fective alleles per locus (ne) were calculated according to
Weir (1989) with the formula 1/(1 -HE).HE,the expected heterozygosity per locus, is equal to 1 2
-
å
ipi, wherepiisthe frequency of theithallele at the locus. The Unweighted Pair-Group Method was applied for cluster analysis, using Arithmetic Averages (UPGMA) based on unbiased genetic distance measures (Nei, 1978).
Results and Discussion
Twenty six microsatellite primer pairs were tested. Nineteen pairs (73%; Ap18, Ap22, Ap23, Ap33, Ap40, Ap45, Ap48, Ap152, Ap154, Ap158, Ap161, Ap166, Ap172, Ap175, Ap176, Ap183, Ap187, Ap190 and Ap196) allowed the detection of polymorphism while seven did not
(27%; Ap10, Ap32, Ap35, Ap38, Ap46, Ap164 and Ap177) when all samples of the two species were consid-ered. Sequences of Ap10, Ap18, Ap35, Ap45, Ap164, Ap177 and Ap190 are being presented for the first time. Lo-cus Ap45 was mono-morphic only in A. pintoi,whereas Ap48 was monomorphic only inA. repensaccessions (Ta-ble 2). Polymorphism in Ap40 (17 repeats) and Ap176 (18 repeats) had already been revealed in previous studies on Arachisgenetic variability (Bravoet al., 2006; Hoshinoet al., 2006; Angeliciet al., 2008), as well as in the present study.
The number of monomorphic loci was high by ac-counting that each primer pair that did not allow detection of polymorphism was adjacent to regions containing a high number of repeats, these ranging from 19 (Ap32) to 58 (Ap35) repeats. Among the ones that did not detect any polymorphism four are described in this paper and two (Ap32 and Ap38) were previously used in three studies on genetic variability inArachis(Bravoet al., 2006; Hoshino et al., 2006; Angeliciet al., 2008), all with similar results. We tested the latter two primer pairs because Hoshinoet al. (2006) studied only one accession of each species of sec-tionCaulorrhizae, whereas Bravoet al.(2006) and Ange-liciet al.(2008) used these two primers in other sections of genusArachis. Thus, we expected additional information from these primers by using samples of the species from which they had been isolated. It may be that the areas tar-geted by the two primer pairs are within conserved regions of the genome. There was no similarity between the se-quences used to design primers for these six microsatellites and any nucleotide or protein sequence in GenBank.
The Ap172 primer pair amplified a putative dupli-cated locus. At first, the double-band pattern was inter-preted as a technical artifact, but after several attempts to optimize the amplification reaction, the band pattern still remained, thereby implying locus duplication. Amplifica-tion of duplicated loci has been observed in several species, such asGlycine max(L.) Merr. (Powellet al., 1996; Peakall et al., 1998), Zea mays L. (Senior et al., 1998), Vigna radiata(Kumaret al.2002) andCicer arietinumL. (Sethy et al., 2003). In rice and sunflowers, the amplification of double-band patterns has also been attributed to the occur-rence of a duplication process within the genome itself, as well as to the evolution of families of repetitive sequences (Akagiet al., 1998; Paniego et al., 2002). In the amphi-diploidA. hypogaea, amplification of duplicated loci was reported by Hopkinset al.(1999), and duplication at sev-eral genomic regions by Burowet al.(2001). DespiteA. pintoiandA. repensbeing diploid species, gene duplication is not rare in the genusArachis, and it could have happened to Ap172.
respec-tively. These stretches of similarity are localized adjacent to microsatellite sequences (data not shown). A like occur-rence was reported by Peakall et al. (1998) in soybean. These authors found a similarity of 96% at the amino acid level between a microsatellite sequence and a seryl-tRNA synthetase ofArabidopsis thaliana. These data seem to be in agreement with observations from several authors (Tóth et al., 2000; Liet al., 2002; Morganteet al., 2002), in the sense that microsatellite sequences are present both in cod-ing and non-codcod-ing regions of nuclear and organellar genomes.
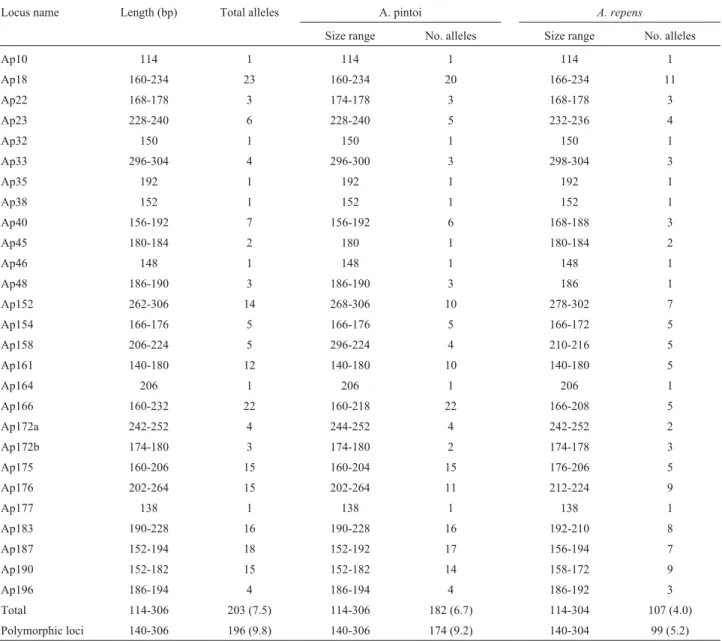
A total of 196 putative alleles were detected at 20 polymorphic loci. It was assumed that fragments of differ-ent lengths were differdiffer-ent alleles. The number of alleles ranged from two at Ap45 to 23 at Ap18 (a mean of 9.8 al-leles/locus) (Table 3). The effective number of alleles
ranged from 1.07 at Ap45 to 16.7 at Ap18 (Table 4). InA. pintoi, 174 alleles were detected distributed among the 19 polymorphic loci (mean of 9.2 alleles/locus), their frag-ment sizes ranging from 140 bp (Ap161) to 306 bp (Ap152). InA. repensaccessions, 99 alleles, with fragment sizes ranging from 140 bp (Ap161) to 304 bp (Ap33), were detected among 19 polymorphic loci (mean 5,2 alleles/lo-cus) (Table 3). Ninety-nine alleles (49%) were exclusively present inA. pintoi and twenty-one alleles (10.7%) were found in A. repens accessions only. Seventy-ninealleles (40.3%) were shared between the two species (data not shown). On using RAPDs, Gimeneset al.(2000) obtained lower values for exclusive fragments for these two species (22% inA. pintoiand 5% inA. repens) and a higher value for shared fragments (73%). Based on these results, they discussed the difficulty in justifying the separation into two
Table 3-E xpected size (bp) and total number of alleles of the 26 microsatellite loci in the sectionCaulorrhizae. The size-range and number of alleles
fromA. pintoiandA. repensaccessions are presented. Numbers between parentheses represent mean numbers of alleles/locus.
Locus name Length (bp) Total alleles A. pintoi A. repens
Size range No. alleles Size range No. alleles
Ap10 114 1 114 1 114 1
Ap18 160-234 23 160-234 20 166-234 11
Ap22 168-178 3 174-178 3 168-178 3
Ap23 228-240 6 228-240 5 232-236 4
Ap32 150 1 150 1 150 1
Ap33 296-304 4 296-300 3 298-304 3
Ap35 192 1 192 1 192 1
Ap38 152 1 152 1 152 1
Ap40 156-192 7 156-192 6 168-188 3
Ap45 180-184 2 180 1 180-184 2
Ap46 148 1 148 1 148 1
Ap48 186-190 3 186-190 3 186 1
Ap152 262-306 14 268-306 10 278-302 7
Ap154 166-176 5 166-176 5 166-172 5
Ap158 206-224 5 296-224 4 210-216 5
Ap161 140-180 12 140-180 10 140-180 5
Ap164 206 1 206 1 206 1
Ap166 160-232 22 160-218 22 166-208 5
Ap172a 242-252 4 244-252 4 242-252 2
Ap172b 174-180 3 174-180 2 174-178 3
Ap175 160-206 15 160-204 15 176-206 5
Ap176 202-264 15 202-264 11 212-224 9
Ap177 138 1 138 1 138 1
Ap183 190-228 16 190-228 16 192-210 8
Ap187 152-194 18 152-192 17 156-194 7
Ap190 152-182 15 152-182 14 158-172 9
Ap196 186-194 4 186-194 4 186-192 3
species. Our data could reinforce a separation of these spe-cies into two taxa, as the higher values observed were due to the codominance and informativeness of microsatellite markers, thereby allowing us to distinguish and better esti-mate the genetic diversity within the analyzed germplasm.
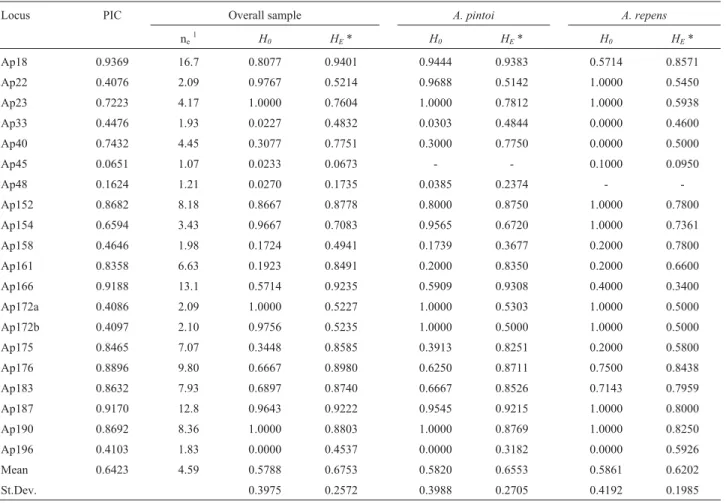
Data on allelic polymorphic information content (PIC), and observed (HO) and expected (HE) hetero-zygosities per locus are presented in Table 4. PIC values ranged from 0.0651 at Ap45 to 0.9369 at Ap18, with an av-erage value of 0.6423 when considering 20 polymorphic loci (Table 4). Average observed heterozygosities at 20 loci for the wholeA. pintoiandA. repenssample were 0.5788, 0.5820 and 0.5861, respectively (Table 4), and average ex-pected heterozigosities for the whole sample,A. pintoiand A. repensaccessions were 0.6753, 0.6553 and 0.6202, re-spectively (Table 4). Mean values of observed hetero-zygosity (HO) were lower than the HE values estimated from allele frequencies. At some loci, HO values were higher than HE (Ap22, Ap23, Ap154, Ap172a, Ap172b, Ap187, and Ap190). The variability observed inA. pintoi could be the consequence of crosses between different
ac-cessions that had been vegetatively maintained at experi-mental plots. Thus, the high observed heterozygosity at some loci could be attributed to the presence of parentals carrying different alleles, thereafter being sustained through the vegetative propagation methods used in con-serving accessions.
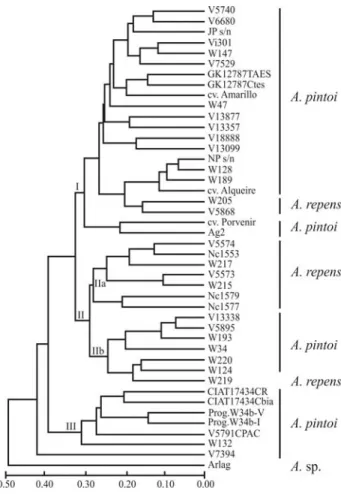
The dendrogram showing the relationships amongA. pintoiandA. repens accessions is presented in Figure 1. Cluster analysis allowed the discrimination of all individu-als from the two species. Such differentiation was individu-also ob-tained using RAPD markers (Gimenes et al., 2000). However, microsatellites should be the marker of choice because they are much more effective and have higher reproducibility since longer primer pairs are used instead of unique short primers that allows multiple loci amplifica-tion, which makes the analysis difficult.
Three major groups (I, II and III) were formed in the tree. In general,A. pintoiaccessions were positioned in all the three major groups, with a mean genetic distance among them of 0.295, ranging from 0.064 (between NP s/nº and WPn 128) to 0.566 (between W 34 and CIAT 17434 – Maní
Table 4- Characterization of the 20 polymorphic microsatellite loci in the sectionCaulorrhizae. Polymorphic information content (PIC), effective
num-ber of alleles, and observed (HO) and expected (HE) heterozygosities obtained per locus.
Locus PIC Overall sample A. pintoi A. repens
ne1 H0 HE* H0 HE* H0 HE*
Ap18 0.9369 16.7 0.8077 0.9401 0.9444 0.9383 0.5714 0.8571 Ap22 0.4076 2.09 0.9767 0.5214 0.9688 0.5142 1.0000 0.5450 Ap23 0.7223 4.17 1.0000 0.7604 1.0000 0.7812 1.0000 0.5938 Ap33 0.4476 1.93 0.0227 0.4832 0.0303 0.4844 0.0000 0.4600 Ap40 0.7432 4.45 0.3077 0.7751 0.3000 0.7750 0.0000 0.5000 Ap45 0.0651 1.07 0.0233 0.0673 - - 0.1000 0.0950 Ap48 0.1624 1.21 0.0270 0.1735 0.0385 0.2374 - -Ap152 0.8682 8.18 0.8667 0.8778 0.8000 0.8750 1.0000 0.7800 Ap154 0.6594 3.43 0.9667 0.7083 0.9565 0.6720 1.0000 0.7361 Ap158 0.4646 1.98 0.1724 0.4941 0.1739 0.3677 0.2000 0.7800 Ap161 0.8358 6.63 0.1923 0.8491 0.2000 0.8350 0.2000 0.6600 Ap166 0.9188 13.1 0.5714 0.9235 0.5909 0.9308 0.4000 0.3400 Ap172a 0.4086 2.09 1.0000 0.5227 1.0000 0.5303 1.0000 0.5000 Ap172b 0.4097 2.10 0.9756 0.5235 1.0000 0.5000 1.0000 0.5000 Ap175 0.8465 7.07 0.3448 0.8585 0.3913 0.8251 0.2000 0.5800 Ap176 0.8896 9.80 0.6667 0.8980 0.6250 0.8711 0.7500 0.8438 Ap183 0.8632 7.93 0.6897 0.8740 0.6667 0.8526 0.7143 0.7959 Ap187 0.9170 12.8 0.9643 0.9222 0.9545 0.9215 1.0000 0.8000 Ap190 0.8692 8.36 1.0000 0.8803 1.0000 0.8769 1.0000 0.8250 Ap196 0.4103 1.83 0.0000 0.4537 0.0000 0.3182 0.0000 0.5926 Mean 0.6423 4.59 0.5788 0.6753 0.5820 0.6553 0.5861 0.6202 St.Dev. 0.3975 0.2572 0.3988 0.2705 0.4192 0.1985
1Effective number of alleles (Kimura and Crow, 1964).
Mejorador). Group I was formed by 20A. pintoiaccessions and only twoA. repens(WPn 205 and V 5868). Two sub-groups were observed in Group II. Subgroup IIa was formed by seven out of tenA. repens accessions with a mean genetic distance of 0.232. Six of these were collected in Minas Gerais State, Brazil. Subgroup IIb was repre-sented by six A. pintoi accessions (VPzAg 13338, VW 5895, WPn 193, W 34, WPn 220 and WPn 124) and only oneA. repens(WPn 219). Group III was formed solely by A. pintoiaccessions.
The longest genetic distance (0.582) was obtained be-tween the accessions CIAT 17434 – Maní Mejorador (A. pintoi) and WPn 215 (A. repens), whereas the shortest (0.064) was between twoA. pintoiaccessions (NP s/nº and WPn 128). The VSa 7394 (A. pintoi) accession, the most di-verse, was positioned outside the three major groups (Fig-ure 1). Tree analysis showed that the species could not be characterized based on polymorphism detected by using 20 microsatellite loci, since accessions of each species were not entirely grouped together. Likewise, Bravoet al.(2006) and Hoshinoet al.(2006) did not resort to microsatellites when characterizingArachisspecies. They pointed out that
this was probably due to: 1 – high microsatellite-detected polymorphism, requiring larger samples for adequate rep-resentation of species variability; and 2 – the existence of homoplasies (fragments of the same size but from different loci that have no common origin). These same factors could possibly have affected the results obtained in this study. However, we believe the main reason is that crossability in A. pintoiandA. repensis high (86.7%, Krapovickas and Gregory, 1994), these being considered by some authors as a single species (Gimenes et al., 2000). As mentioned above, differentiation betweenA. repensandA. pintoi, as observed in the present study, was greater than that ob-served by Gimeneset al.(2000). We consider this to be a relevant result, because it shows that the primary gene pool of these species probably has a wider base than was de-tected by the RAPD data.
It has been demonstrated that the set of microsatellite markers previously described and used here provides a powerful tool for germplasm characterization analysis ofA. pintoiandA. repensspecies. Among the primer pairs pre-sented in this study, 21 are readily available. These primers could be useful in all the steps from conservation to the use of germplasm. The existence of duplicates, mislabeling and loss of integrity due to physical contamination, cross-pollination or genetic drift are realities, so these markers could be used as an aid in evaluating these events in the germplasm collection. Furthermore, they could also be used in identifying accessions and cultivars and for select-ing parents for hybridization.
Acknowledgments
This research was supported by FAPESP (Fundação de Amparo à Pesquisa do Estado de São Paulo). The partici-pation of D.A.P. and C.R.L. was sponsored by a CAPES (Coordenação de Aperfeiçoamento do Pessoal de Nível Su-perior) fellowship and a CNPq (Conselho Nacional de Desenvolvimento Científico-Tecnológico) research fel-lowship, respectively.
References
Akagi H, Yokzeki Y, Inagaki A and Fujimura T (1998) Origin and evolution of twin microsatellites in the genusOryza. Hered-ity 81:187-197.
Altschul SF, Madden TL, Schäffer AA, Zhang J, Zhang Z, Miller W and Lipman DJ (1997) Gapped BLAST and PSI-BLAST: A new generation of protein database search programs. Nu-cleic Acids Res 25:3389-3402.
Angelici CMLCD, Gimenes MA, Hoshino AA, Lopes CR, Pal-mieri DA, Valls JFM and Nobile PM (2008) Genetic diver-sity in species of section Rhizomatosae, genus Arachis (Leguminosae), using microsatellite markers. Genet Mol Biol 31:79-88.
Bertozo MR and Valls JFM (2001) Seed storage protein electro-phoresis inArachis pintoiandA. repens(Leguminosae) for evaluating genetics diversity. Genet Resour Crop Evol 48:121-130.
Figure 1- UPGMA dendrogram of 33 accessions ofA. pintoiand ten ofA.
Bravo JP, Hoshino AA, Angelici CMLCD, Lopes CR and Gi-menes MA (2006) Transferability and use of microsatellite markers for the genetic analysis of the germplasm of some Arachis section species of the genusArachis.Genet Mol Biol 29:516-524.
Brondani C, Rangel PHN, Brondani RPV and Ferreira ME (2002) QTL mapping and introgression of yield-related traits from Oryza glumaepatulato cultivated rice (Oryza sativa) using microsatellite markers. Theor Appl Genet 104:1192-1203. Brondani RPV, Brondani C, Tarchini R and Grattapaglia D (1998)
Development, characterization and mapping of micro-satellite markers inEucalyptus grandisand E. urophylla. Theor Appl Genet 97:816-827.
Brown SM, Hopkins MS, Mitchell SE, Senior ML, Wang TY, Duncan RR, Gonzalez-Candelas F and Kresovich S (1996) Multiple methods for the identification of polymorphic sim-ple sequence repeats (SSRs) in sorghum [Sorghum bicolor (L.) Moench]. Theor Appl Genet 93:190-198.
Burow MD, Simpson CE, Starr JL and Paterson AH (2001) Trans-mission genetics of chromatin from a synthetic amphidi-ploid to cultivated peanut (Arachis hypogaea L.): Broa-dening the gene pool of a monophyletic polyploidy species. Genetics 159:823-837.
Fahima T, Röder MS, Grma A and Nevo E (1998) Microsatellite DNA polymorphism divergence inTriticum dicoccoides ac-cessions highly resistant to yellow rust. Theor Appl Genet 96:187-195.
Giancola S, Marcucci Poltri S, Lacaze P and Hopp HE (2002) Fea-sibility of integration of molecular markers and morphologi-cal descriptors in a real case study of a plant variety protec-tion system for soybean. Euphytica 127:95-113.
Gimenes MA, Lopes CR, Galgaro ML, Valls JFM and Kochert G (2000) Genetic variation and phylogenetic relationships based on RAPD analysis in section Caulorrhizae, genus Arachis(Leguminosae). Euphytica 116:187-195.
Grattapaglia D and Sederoff RR (1994) Genetic linkage maps of Eucalyptus grandis and Eucalyptus urophilla using a pseudo-testcross mapping strategy and RAPD markers. Ge-netics 137:1121-1137.
Hokanson SC, Szewc-Fadden AK, Lamboy WF and Mcferson JR (1998) Microsatellite (SSR) markers reveal genetic identi-ties, genetic diversity and relationship inMalusxdomestica Borkh. core subset collection. Theor Appl Genet 97:671-683.
Hopkins MS, Casa AM, Wang T, Mitchell SE, Dean RE, Kochert GD and Kresovich S (1999) Discovery and characterization of polymorphic simple sequence repeats (SSRs) in peanut. Crop Sci 39:1243-1247.
Hoshino AA, Bravo JP, Angelici CMLCD, Barbosa AVG, Lopes CR and Gimenes MA (2006) Heterologous microsatellite primer pairs informative for the whole genusArachis. Genet Mol Biol 29:665-675.
Kijas JMH, Fowler JCS, Garbett CA and Thomas MR (1994) En-richment of microsatellites from the Citrus genome using biotinylated oligonucleotide sequences bound to strepta-vidin-coated magnetic particles. BioTechniques 16:657-662.
Kimura M and Crow JF (1964) The number of alleles that can be maintained in a finite population. Genetics 49:725-38. Krapovickas A and Gregory WC (1994) Taxonomía del género
Arachis(Leguminosae). Bonplandia 8:1-186.
Kumar SV, Tan SG, Quah SC and Yusoff K (2002) Isolation of microsatellite markers in mungbean, Vigna radiata. Mol Ecol Notes 2:96-98.
Li CD, Rossnagel BG and Scoles GJ (2000) The development of oat microsatellite markers and their use in identifyingAvena species and oat cultivars. Theor Appl Genet 101:1259-1268. Li YC, Korol AB, Fahima T, Beiles A and Nevo E (2002)
Micro-satellites: Genomic distribution, putative functions and mutational mechanisms: A review. Mol Ecol 11:2453-2465. Loch DS and Ferguson JE (1999) Tropical and subtropical forage
seed production: An overview. In: Loch DS and Ferguson JE (eds) Forage Seed Production. 2. Tropical and Subtropical Species. CABI Publishing, New York, pp 1-40.
Maass BL, Torres AM and Ocampo CH (1993) Morphological and isozyme characterization of Arachis pintoi Krap. & Greg. nom. nud. germplasm. Euphytica 70:43-52.
Métais I, Hamon B, Jalouzot R and Peltier D (2002) Structure and level of genetic diversity in various bean types evidenced with microsatellite markers isolated from a genomic en-riched library. Theor Appl Genet 104:1346-1352.
Morgante M, Hanafey M and Powell W (2002) Microsatellites are preferentially associated with nonrepetitive DNA in plant genomes. Nat Genet 30:194-200.
Nei M (1973) Analysis of gene diversity in subdivided popula-tions. Proc Natl Acad Sci USA 70:3321-3323.
Nei M (1978) Estimation of average heterozygosity and genetic distance from a small number of individuals. Genetics 89:583-590.
Palmieri DA, Hoshino AA, Bravo JP, Lopes CR and Gimenes MA (2002) Isolation and characterization of microsatellite loci from the forage speciesArachis pintoi(GenusArachis). Mol Ecol Notes 2:551-553.
Palmieri DA, Bechara MD, Curi RA, Gimenes MA and Lopes CR (2005) Novel polymorphic microsatellite markers in section Caulorrhizae(Arachis, Fabaceae) Mol Ecol Notes 5:77-79. Paniego N, Echaide M, Muñoz M, Fernández L, Torales S, Faccio P, Fuxan I, Carrera M, Zandomeni R, Suárez EY, et al. (2002). Microsatellite isolation and characterization in sun-flower (Helianthus annuusL.). Genome 45:34-43. Peakall R, Gilmore S, Keys W, Morgante M and Rafalski A
(1998) Cross-species amplification of soybean (Glycine max) simple sequence repeats (SSRs) within the genus and other legume genera: Implication for the transferability of SSRs in plants. Mol Biol Evol 15:1275-1287.
Powell W, Morgante M, Doyle JJ, McNicol JW, Tingey SV and Rafalski AJ (1996) Genepool variation in genus Glycine subgenusSojarevealed by polymorphic nuclear and chloro-plast microsatellites. Genetics 144:793-803.
Rosseto M, Mcnally J and Henry RJ (2002) Evaluating the poten-tial of SSR flanking regions for examining taxonomic rela-tionships in theVitaceae. Theor Appl Genet 104:61-66. Rozen S and Skaletsky HJ (2000) Primer3 on the WWW for
gen-eral users and for biologist programmers. In: Krawetz S and Misener S (eds) Bioinformatics Methods and Protocols: Methods in Molecular Biology. Humana Press, New Jersey, pp 365-386.
Schlötterer C and Tautz D (1992) Slippage synthesis of simple se-quence DNA. Nucleic Acids Res 20:211-215.
rela-tionships in maize using an agarose gel system. Crop Sci 38:1088-1098.
Sethy NK, Shokeen B and Bhatia S (2003) Isolation and charac-terization of sequence-tagged microsatellite sites markers in chickpea (Cicer arietinumL.). Mol Ecol Notes 3:428-430.
Teguia A (2000) A note on the effect of feeding local forages to commercial layers on egg production and yolk colour. J Anim Feed Sci 9:391-396.
Tóth G, Gáspari Z and Jurka J (2000) Microsatellites in different eukaryotic genomes: Survey and analysis. Genome Res 10:967-981.
Valls JFM and Simpson CE (1994) Taxonomy, natural distribu-tion, and attributes ofArachis. In: Kerridge PC and Hardy B
(eds) Biology and Agronomy of Forage Arachis. CIAT,
Cali, pp 1-18.
Valls JFM (1996) Variability in the genusArachisand potential forage uses. In: Springer TL and Pittman RN (eds) Iden-tifying Germplasm for Successful Forage Legume-Grass
In-teractions. Proceedings of a Symposium of the Crop Science Society of America. USDA, Washington, pp 15-27. Weber JL (1990) Informativeness of human (dC – dA)n (dG –
dT)n polymorphisms. Genomics 7:524-530.
Weir BS (1989) Sampling properties of gene diversity. In: Brown AHD, Clegg MT, Kahler HL and Weir BS (eds) Plant Popu-lation Genetics, Breeding and Genetic Resources. Sinauer Associates, Sunderland, pp 23-42.
Weissing KP, Winter P, Huttel B and Kahl G (1998) Micro-satellite markers for molecular breeding. J Crop Prod 1:113-143.
Yeh FC, Yang RC, Boiley T, Ye ZH and Mao JX (1999) PopGene, the user-friendly shareware for population genetic analysis. Molecular Biology and Biotechnology Center, University of Alberta.
Associate Editor: Márcio de Castro Silva Filho