Submitted 12 March 2015
Accepted 4 May 2015
Published19 May 2015
Corresponding author Brian T. Klingbeil, brian.klingbeil@uconn.edu
Academic editor Karen Esler
Additional Information and Declarations can be found on page 14
DOI10.7717/peerj.973
Copyright
2015 Klingbeil and Willig
Distributed under
Creative Commons CC-BY 4.0
OPEN ACCESS
Bird biodiversity assessments in
temperate forest: the value of point count
versus acoustic monitoring protocols
Brian T. Klingbeil and Michael R. Willig
Department of Ecology & Evolutionary Biology and Center for Environmental Sciences & Engineering, University of Connecticut, Storrs, CT, USA
ABSTRACT
Effective monitoring programs for biodiversity are needed to assess trends in biodi-versity and evaluate the consequences of management. This is particularly true for birds and faunas that occupy interior forest and other areas of low human popula-tion density, as these are frequently under-sampled compared to other habitats. For birds, Autonomous Recording Units (ARUs) have been proposed as a supplement or alternative to point counts made by human observers to enhance monitoring efforts. We employed two strategies (i.e., simultaneous-collection and same-season) to compare point count and ARU methods for quantifying species richness and composition of birds in temperate interior forests. The simultaneous-collection strategy compares surveys by ARUs and point counts, with methods matched in time, location, and survey duration such that the person and machine simultaneously col-lect data. The same-season strategy compares surveys from ARUs and point counts conducted at the same locations throughout the breeding season, but methods dif-fer in the number, duration, and frequency of surveys. This second strategy more closely follows the ways in which monitoring programs are likely to be implemented. Site-specific estimates of richness (but not species composition) differed between methods; however, the nature of the relationship was dependent on the assessment strategy. Estimates of richness from point counts were greater than estimates from ARUs in the simultaneous-collection strategy. Woodpeckers in particular, were less frequently identified from ARUs than point counts with this strategy. Conversely, estimates of richness were lower from point counts than ARUs in the same-season strategy. Moreover, in the same-season strategy, ARUs detected the occurrence of passerines at a higher frequency than did point counts. Differences between ARU and point count methods were only detected in site-level comparisons. Importantly, both methods provide similar estimates of species richness and composition for the region. Consequently, if single visits to sites or short-term monitoring are the goal, point counts will likely perform better than ARUs, especially if species are rare or vocalize infrequently. However, if seasonal or annual monitoring of sites is the goal, ARUs offer a viable alternative to standard point-count methods, especially in the context of large-scale or long-term monitoring of temperate forest birds.
Subjects Biodiversity, Conservation Biology, Ecology
INTRODUCTION
Standardized long-term programs for monitoring biodiversity that span large geographic areas are needed to determine species responses to global change and to inform conser-vation efforts. Effective monitoring programs identify changes in species distributions, assess population trends and evaluate the efficacy of management practices. In this context, birds represent one of the most well studied groups of wildlife, with a history of long-term studies, including a number of large-scale monitoring programs (e.g., Christmas Birds Count, North American Breeding Bird Survey). Nonetheless, considerable gaps exist in our knowledge of the current status and recent population trends of forest birds (Sauer, Fallon & Johnson, 2003;Blancher et al., 2009;Francis, Blancher & Phoenix, 2009).
Point-count surveys, where an observer records all birds seen or heard at a point location for a specified time (Ralph, Sauer & Droege, 1995), are the most common survey method for long-term avian studies (Rosenstock et al., 2002). Interior forest and other areas of low human population density are frequently under-sampled in such large-scale mon-itoring programs because surveys are often conducted by volunteers (Francis, Blancher & Phoenix, 2009). Surveys by volunteers are often employed because they are a cost-effective method, and the involvement of non-scientists in science (i.e., citizen science) enhances public appreciation of biodiversity and conservation (Dickinson et al., 2012;Price & Lee, 2013). Furthermore, with freely accessible and up-to-date survey results (e.g., eBird) as well as digital tools that enable identification of species (e.g., Merlin bird ID and xeno-canto) and changes in distributions, citizen science initiatives have the potential to address critical needs in science and conservation. Nonetheless, volunteer-based surveys are not without drawbacks, including data quality concerns (e.g., variation in identification accuracy related to age, education, collection skills, and length of participation in the program; Dickinson, Zuckerberg & Bonter, 2010). The use of Autonomous Recording Units (ARUs) to survey birds and other taxa has been suggested as a supplement to enhance monitoring efforts, especially in remote or inaccessible areas, like interior forestHaselmayer & Quinn, 2000;Hobson et al., 2002;Acevedo & Villanueva-Rivera, 2006;Hutto & Stutzman, 2009; Campbell & Francis, 2011;Venier et al., 2012;Tegeler, Morrison & Szewczak, 2012;Furnas & Callas, 2015.
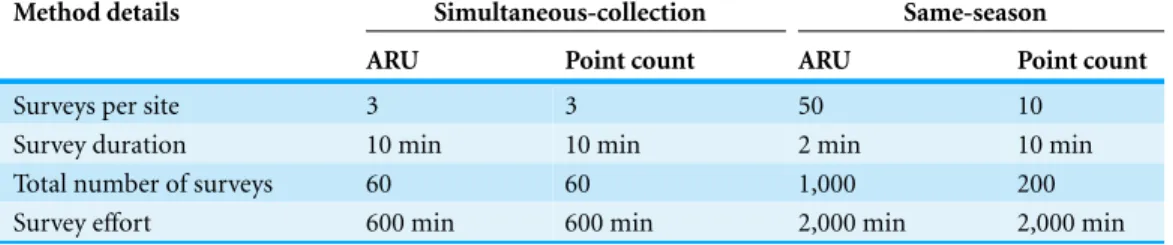
Table 1 Methodological details for comparisons of point count and ARU methods. Details of two assessment strategies used to compare point count and ARU methods for estimating richness and composition of temperate interior forest bird communities.
Method details Simultaneous-collection Same-season
ARU Point count ARU Point count
Surveys per site 3 3 50 10
Survey duration 10 min 10 min 2 min 10 min
Total number of surveys 60 60 1,000 200
Survey effort 600 min 600 min 2,000 min 2,000 min
& Kemp, 2001). Furthermore, ARUs have the potential to significantly reduce the number of trained observers that need to be sent to the field, freeing time and personnel resources during field seasons that could be spent surveying for species undetectable by acoustic approaches or accomplishing other scientific or management goals.
Like any method, ARUs suffer from a number of shortcomings. They are subject to malfunction or breakage, and their performance may be affected by adverse environmental conditions for extended periods of time (e.g., microphones can become waterlogged reducing sound quality). Most importantly, ARUs lack the visual component of traditional point count surveys, making detection more difficult for vocally cryptic species and reducing reliability of estimates for species abundance. As a result, ARUs are often suggested as a supplement to point counts, but have not been embraced as a viable alternative to be used in place of them (e.g.,Venier et al., 2012;Tegeler, Morrison & Szewczak, 2012;Furnas & Callas, 2015).
Most previous comparisons between point counts and ARUs have generally relied on assessments when point counts conducted by a trained observer and audio recordings made by a single ARU are paired in time and space (e.g.,Haselmayer & Quinn, 2000; Hobson et al., 2002;Acevedo & Villanueva-Rivera, 2006;Celis-Murillo, Deppe & Allen, 2009;Hutto & Stutzman, 2009; but seeTegeler, Morrison & Szewczak, 2012), although additional studies have made comparisons between an observer and multiple ARU models to evaluate differences between equipment types (Venier et al., 2012;Rempel et al., 2013). Such studies are important for evaluating new technologies and provide information to conservation managers in a rapidly developing field (with many new equipment options). However, these studies may not provide the best assessment of ARUs as a monitoring alternative because comparisons fail to capitalize on one of ARUs primary assets: repeated unattended surveys over an extended time period. Consequently, we use two assessment strategies (Table 1) to identify if differences exist in the efficacy of point count and ARU methods with respect to estimating species richness and composition of bird communities in interior forest.
and ARUs in that an observer stands next to an ARU, and both simultaneously collect data. Consequently, results from this strategy can be compared to previous studies to determine if the performance of ARUs in temperate interior forest is similar to other habitats (e.g., burned conifer forest-riparian gradient-Hutto & Stutzman, 2009; boreal forest-Venier et al., 2012; alpine meadows-Tegeler, Morrison & Szewczak, 2012; BBS survey route-Rempel et al., 2013). The same-season strategy compares surveys from ARUs and point counts conducted at the same locations throughout the breeding season, but methods differ in the number, duration, and frequency of surveys (but total sample effort is equal). This comparison evaluates if a substantially higher number of days sampled by ARUs corresponds to different estimates of species richness and composition than do point counts, without confounding estimates with the effects of increased effort. Holding total sample effort (i.e., number of survey minutes) constant between methods represents a conservative estimate of the utility of ARUs, because they can record for extended time (hours per day and number of days) without additional effort or cost.
METHODS
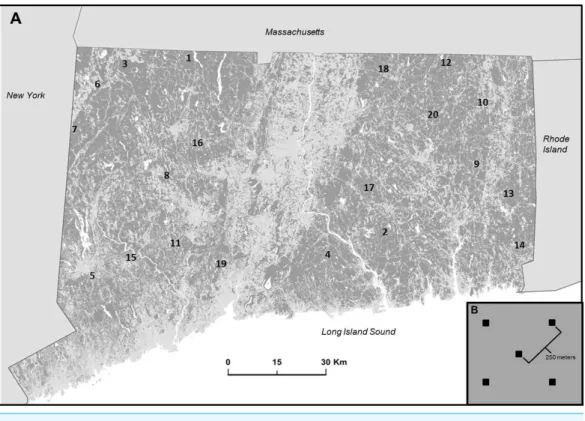
Research was conducted in eastern deciduous and coniferous forests of Connecticut, USA, excluding coastal areas. Currently, 60% of land cover in the state is forest, dominated by oak-hickory and northern hardwood forest types, although pine forests are common along the northern border of the state (Butler, 2013). Like many areas, Connecticut has experi-enced profound anthropogenic alteration of landscapes (Drummond & Loveland, 2010), so that forest currently exists as patches or fragmented parcels of various sizes and ages, interwoven with various types of human-altered land covers (i.e., urban and suburban developments, agricultural fields, road networks, and power line rights of way;Fig. 1A).
Twenty sites were established on public land within interior forest patches of various sizes and shapes. Roughly one-third of the forests in the lower 48 states are on public lands, supporting 45% of the US distribution of 149 obligate forest bird species, and represent the largest unfragmented forests in many regions (NABCI, 2011). Site locations were selected by processing a 2010 land cover map (CLEAR, 2010b) with the Landscape Fragmentation Tool (LFT v2.0;CLEAR, 2010a) add-on to Arc Toolbox to identify suitable sites with suffi -cient area of interior forest (i.e., forest pixels located at least 100 m from non-forest pixels) to contain 5 plots, each containing an ARU. Within each site, plots were spaced at least 250 m apart to avoid overlap in the sampled acoustic environment (Fig. 1B). Sites were at least 10 km from other sites and from Long Island Sound. Prospective sites were visited and ground-truthed to evaluate accuracy of land cover maps and to ensure accessibility.
Figure 1 Study location and design.(A) Map of study area in Connecticut, USA represented by forest (dark gray) non forest (light gray) and water (white). Location of 20 interior forest sites are indicated by number (seeSupplemental Informationfor geographic coordinates). (B) Diagram illustrating the arrangement of five plots (black squares) within a site. Each square represents a paired ARU and point count location.
were recorded as present. In addition to point counts, each of the 5 plots within a site contained an ARU (Wildlife Acoustics Song Meter Sm2+) and was surveyed for 4 h on a daily basis, beginning at local sunrise during the same time period as point counts. ARUs were equipped with two omni-directional microphones (flat frequency response between 20 Hz and 20 kHz) and signals were sampled at 24,000 Hz. ARUs with microphones pointing horizontally were attached to trees at a height of 2 m and were located within 3 m of the point count location. Recordings were analyzed and spectrograms were viewed with Song Scope software (Wildlife Acoustics Inc., Maynard, Massachusetts, USA). To assist in identification of species, field recordings were compared by listening to recordings and viewing sonograms of previously identified species obtained from the Macaulay Library at the Cornell Lab of Ornithology. We focus our analyses on two orders (i.e., Passeriformes and Piciformes) that are well represented and comprise the majority of species in temperate interior forest (Monkkonen, 1994;Keddy & Drummond, 1996). We followed the nomenclature and taxonomic recommendations of the North American Classification Committee of the American Ornithologists’ Union (Chesser et al., 2013).
season. For each site, recordings from 5 ARUs were sampled by randomly selecting a plot and a 2-minute time period separately on each of 50 days during the breeding season, exclusive of the 2 days when point counts were conducted at particular sites (to eliminate biases associated with observer presence). This approach results in equal sample effort in recordings and point count surveys for each site (Table 1). This acoustic sampling strategy represents a compromise between maximizing the number of days sampled, while including a sufficient amount of time per day to capture multiple vocalizations of a species.
In the simultaneous-collection strategy, we evaluate if the same species are identified by point counts and ARUs when paired in time, location, duration, and observer (Table 1). Three plots from each site were selected randomly and a 10 min recording that corresponded to a 10 min point count conducted by the same observer was selected (i.e., 60 samples from each method paired in time, location, and observer). Plots within sites were randomly selected when possible but some sites did not have more than three paired recordings because not all ARUs were recording at the time of point counts due to weather, animal induced damage, or equipment malfunction.
To determine if the local environment influences the efficacy of methods, the habitat surrounding ARUs and point count locations was quantified. At each plot, five habitat characteristics were estimated. Elevation was determined with a handheld GPS receiver. Slope was estimated on a scale of 0–3, with 0 indicating no slope and 3 indicating a very steep slope (>45◦
). Canopy openness was estimated with a concave spherical densiometer at the center of a plot and at a distance of 5 m in each of the 4 cardinal directions. Understory density was estimated on a scale from 0 to 5, with 0 indicative of completely open understory commonly associated with old growth coniferous forest and with 5 indicative of very dense understory that is commonly associated with dense patches of mountain laurel (Kalmia latifolia) or invasive Japanese barberry (Berberis thunbergii). Ground cover of leaves (including pine needles) and herbs was visually estimated as the percent area covered within a 5 m radius circle at the center of each plot.
We evaluated if differences in species richness or in species composition exist between ARU and point count methods, and determine if differences arise as a consequence of assessment strategy. We held total survey effort (i.e., number of minutes) constant in comparisons of data between methods for each strategy. We used pairedt-tests to assess if differences in estimates of richness exist between approaches in the same-season strategy. For comparisons based on the simultaneous-collection strategy, we partitioned site richness (gamma) into within (alpha) and among (beta) plot richness. Alpha (α) is the average richness of plots within a site. Beta (β) is the average number of compartments (i.e., groups of plots with similar species composition that are distinct from other such groups of plots) and reflects the heterogeneity of a site (from the perspective of the sampled birds). Gamma (γ) is the cumulative richness of a site (pooling all three plots). We used a multiplicative approach (αβ=γ) to determine partitions (Whittaker, 1972). Pairedt-tests quantified differences in richness between methods at each of these 3 levels.
method and strategy. Frequency of occurrence in the simultaneous-collection strategy was determined by counting the number of times a species was observed at plots (n=60) via ARUs or point counts. Frequency of occurrence in the same-season strategy was determined by counting the number of times a species was observed at sites (n=20) via ARUs or point counts. Estimates of regional species composition derived from point counts and ARUs were compared with chi-square randomization tests separately for each strategy. In addition, we evaluated if a taxonomic bias existed between methods by comparing the frequency of occurrence of birds in the orders Piciformes and Passeriformes separately with pairedt-tests for each strategy.
Lastly, we determined if differences in species composition between point counts and ARUs were related to habitat characteristics of forest interior plots. We used the additive inverse of Jaccard’s similarity coefficient (J) to estimate dissimilarity in species composition between methods in the simultaneous collection strategy. Spearman rank correlations evaluated associations between habitat characteristics and species dissimilarity.
RESULTS
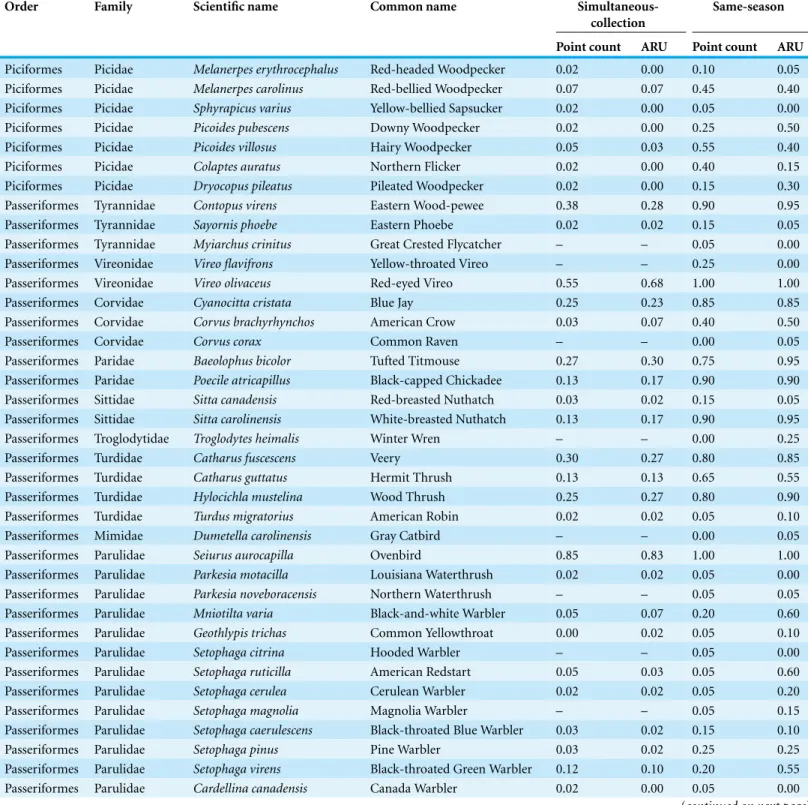
Sites were characterized by low canopy openness, low understory density, and a greater percentage of leaf and needle coverage than of herbaceous cover. Mean elevation ranged from 105 to 375 m above sea level (Table S1). Forty-one species were identified with point counts and thirty-nine species were identified with ARUs (Table 2). Five species (Canada Warbler, Great Crested Flycatcher, Hooded Warbler, Yellow-bellied Sapsucker, and Yellow-throated Vireo) were identified only with point counts, whereas three species (Common Raven, Gray Catbird, and Winter Wren) were identified only with ARUs.
Simultaneous-collection strategy
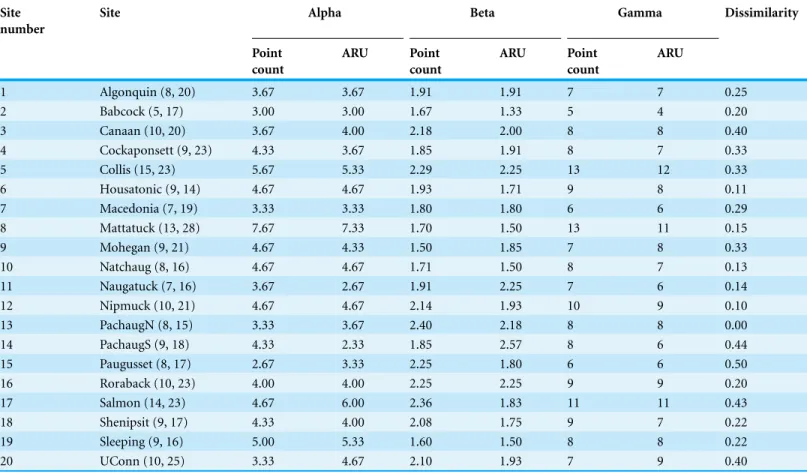
Alpha or beta components of richness (Table 3) were not significantly different between methods (Table 4). In contrast, gamma was higher for point counts than ARUs. Regional species composition did not differ between survey types (X2=13.11,p=1.0). However, a significant difference existed between methods in the frequency of occurrence of birds in Piciformes (Table 5). Dissimilarity (1-J) of species identified by surveys and recordings varied from 0.0 to 0.5 (Table 3), and was associated negatively with elevation (rho= −0.511,p=0.021;Table 6).
Same-season strategy
Compared to point counts, ARUs result in greater estimates of richness at sites (Paired
t-test:t= −2.7979,p=0.012). Nevertheless, point count and ARU methods resulted in similar estimates of species richness in the region (i.e. , 38 species by ARUs and 40 species by point counts). Species composition was similar between methods (X2=46.26,
Table 2 Frequency of occurrence of birds in temperate interior forest identified with two assessment strategies (i.e., simultaneous-collection and same-season).Methodological details of each assessment strategy are listed inTable 1and described in the text. A dash indicates the species was not identified with a particular strategy.
Order Family Scientific name Common name
Simultaneous-collection
Same-season
Point count ARU Point count ARU
Piciformes Picidae Melanerpes erythrocephalus Red-headed Woodpecker 0.02 0.00 0.10 0.05
Piciformes Picidae Melanerpes carolinus Red-bellied Woodpecker 0.07 0.07 0.45 0.40
Piciformes Picidae Sphyrapicus varius Yellow-bellied Sapsucker 0.02 0.00 0.05 0.00
Piciformes Picidae Picoides pubescens Downy Woodpecker 0.02 0.00 0.25 0.50
Piciformes Picidae Picoides villosus Hairy Woodpecker 0.05 0.03 0.55 0.40
Piciformes Picidae Colaptes auratus Northern Flicker 0.02 0.00 0.40 0.15
Piciformes Picidae Dryocopus pileatus Pileated Woodpecker 0.02 0.00 0.15 0.30
Passeriformes Tyrannidae Contopus virens Eastern Wood-pewee 0.38 0.28 0.90 0.95
Passeriformes Tyrannidae Sayornis phoebe Eastern Phoebe 0.02 0.02 0.15 0.05
Passeriformes Tyrannidae Myiarchus crinitus Great Crested Flycatcher – – 0.05 0.00
Passeriformes Vireonidae Vireo flavifrons Yellow-throated Vireo – – 0.25 0.00
Passeriformes Vireonidae Vireo olivaceus Red-eyed Vireo 0.55 0.68 1.00 1.00
Passeriformes Corvidae Cyanocitta cristata Blue Jay 0.25 0.23 0.85 0.85
Passeriformes Corvidae Corvus brachyrhynchos American Crow 0.03 0.07 0.40 0.50
Passeriformes Corvidae Corvus corax Common Raven – – 0.00 0.05
Passeriformes Paridae Baeolophus bicolor Tufted Titmouse 0.27 0.30 0.75 0.95
Passeriformes Paridae Poecile atricapillus Black-capped Chickadee 0.13 0.17 0.90 0.90
Passeriformes Sittidae Sitta canadensis Red-breasted Nuthatch 0.03 0.02 0.15 0.05
Passeriformes Sittidae Sitta carolinensis White-breasted Nuthatch 0.13 0.17 0.90 0.95
Passeriformes Troglodytidae Troglodytes heimalis Winter Wren – – 0.00 0.25
Passeriformes Turdidae Catharus fuscescens Veery 0.30 0.27 0.80 0.85
Passeriformes Turdidae Catharus guttatus Hermit Thrush 0.13 0.13 0.65 0.55
Passeriformes Turdidae Hylocichla mustelina Wood Thrush 0.25 0.27 0.80 0.90
Passeriformes Turdidae Turdus migratorius American Robin 0.02 0.02 0.05 0.10
Passeriformes Mimidae Dumetella carolinensis Gray Catbird – – 0.00 0.05
Passeriformes Parulidae Seiurus aurocapilla Ovenbird 0.85 0.83 1.00 1.00
Passeriformes Parulidae Parkesia motacilla Louisiana Waterthrush 0.02 0.02 0.05 0.00
Passeriformes Parulidae Parkesia noveboracensis Northern Waterthrush – – 0.05 0.05
Passeriformes Parulidae Mniotilta varia Black-and-white Warbler 0.05 0.07 0.20 0.60
Passeriformes Parulidae Geothlypis trichas Common Yellowthroat 0.00 0.02 0.05 0.10
Passeriformes Parulidae Setophaga citrina Hooded Warbler – – 0.05 0.00
Passeriformes Parulidae Setophaga ruticilla American Redstart 0.05 0.03 0.05 0.60
Passeriformes Parulidae Setophaga cerulea Cerulean Warbler 0.02 0.02 0.05 0.20
Passeriformes Parulidae Setophaga magnolia Magnolia Warbler – – 0.05 0.15
Passeriformes Parulidae Setophaga caerulescens Black-throated Blue Warbler 0.03 0.02 0.15 0.10
Passeriformes Parulidae Setophaga pinus Pine Warbler 0.03 0.02 0.25 0.25
Passeriformes Parulidae Setophaga virens Black-throated Green Warbler 0.12 0.10 0.20 0.55
Passeriformes Parulidae Cardellina canadensis Canada Warbler 0.02 0.00 0.05 0.00
Table 2 (continued)
Order Family Scientific name Common name
Simultaneous-collection
Same-season
Point count ARU Point count ARU
Passeriformes Emberizidae Pipilo erythrophthalmus Eastern Towhee 0.03 0.05 0.15 0.30
Passeriformes Emberizidae Spizella passerina Chipping Sparrow 0.05 0.02 0.25 0.45
Passeriformes Cardinalidae Piranga olivacea Scarlet Tanager 0.30 0.33 0.85 1.00
Passeriformes Cardinalidae Cardinalis cardinalis Northern Cardinal – – 0.10 0.20
Passeriformes Cardinalidae Pheucticus ludovicianus Rose-breasted Grosbeak – – 0.15 0.20
Table 3 Comparison of methods based on simultaneous-collection strategy.Estimates of richness and dissimilarity from point count and ARU methods based on data from the simultaneous-collection strategy. Richness is partitioned into alpha, beta, and gamma components based on the multiplicative model (Whittaker, 1972). Alpha refers to the mean richness of 3 plots within each site. Gamma refers to the cumulative richness of 3 plots within each site. Beta is the average number of compartments in a site and reflects the heterogeneity of a site. Dissimilarity (1−Jaccard’s coefficient) estimates the difference in species composition for each site determined by point count versus ARU methods. Total number of species identified by ARU and point count methods with the simultaneous-collection strategy is indicated by first number in parentheses after each site name. The second number in parentheses refers to richness estimated with ARU and point count methods with the same-season strategy (See
Table 1for differences in effort between strategies).
Site number
Site Alpha Beta Gamma Dissimilarity
Point count
ARU Point
count
ARU Point
count
ARU
1 Algonquin (8, 20) 3.67 3.67 1.91 1.91 7 7 0.25
2 Babcock (5, 17) 3.00 3.00 1.67 1.33 5 4 0.20
3 Canaan (10, 20) 3.67 4.00 2.18 2.00 8 8 0.40
4 Cockaponsett (9, 23) 4.33 3.67 1.85 1.91 8 7 0.33
5 Collis (15, 23) 5.67 5.33 2.29 2.25 13 12 0.33
6 Housatonic (9, 14) 4.67 4.67 1.93 1.71 9 8 0.11
7 Macedonia (7, 19) 3.33 3.33 1.80 1.80 6 6 0.29
8 Mattatuck (13, 28) 7.67 7.33 1.70 1.50 13 11 0.15
9 Mohegan (9, 21) 4.67 4.33 1.50 1.85 7 8 0.33
10 Natchaug (8, 16) 4.67 4.67 1.71 1.50 8 7 0.13
11 Naugatuck (7, 16) 3.67 2.67 1.91 2.25 7 6 0.14
12 Nipmuck (10, 21) 4.67 4.67 2.14 1.93 10 9 0.10
13 PachaugN (8, 15) 3.33 3.67 2.40 2.18 8 8 0.00
14 PachaugS (9, 18) 4.33 2.33 1.85 2.57 8 6 0.44
15 Paugusset (8, 17) 2.67 3.33 2.25 1.80 6 6 0.50
16 Roraback (10, 23) 4.00 4.00 2.25 2.25 9 9 0.20
17 Salmon (14, 23) 4.67 6.00 2.36 1.83 11 11 0.43
18 Shenipsit (9, 17) 4.33 4.00 2.08 1.75 9 7 0.22
19 Sleeping (9, 16) 5.00 5.33 1.60 1.50 8 8 0.22
Table 4 Differences in estimates of richness from the simultaneous-collection strategy.Results from two-tailed significance tests (pairedt-test) to evaluate mean differences in richness components estimated from the simultaneous-collection strategy. Significant relationships are indicated in bold.
Component Point count ARU t-statistic df p-value
Alpha 4.27 4.23 0.204 19 0.841
Beta 1.97 1.89 1.315 19 0.204
Gamma 8.35 7.85 2.236 19 0.038
Table 5 Differences in frequency of occurrence for simultaneous-collection and same-season strate-gies.Results from two-tailed significance tests (pairedt-test) to evaluate mean differences in frequency of occurrence of birds from two orders identified with point count and ARU methods. Comparisons were made separately for each assessment strategy. Significant relationships are indicated in bold.
Strategy Order n Point count ARU t-statistic df p-value
Simultaneous-collection
Piciformes 7 0.029 0.014 6.000 6 <0.001
Passeriformes 26 0.156 0.159 −0.498 25 0.623
Same-season
Piciformes 7 0.279 0.257 0.333 6 0.751
Passeriformes 36 0.342 0.408 −2.646 35 0.012
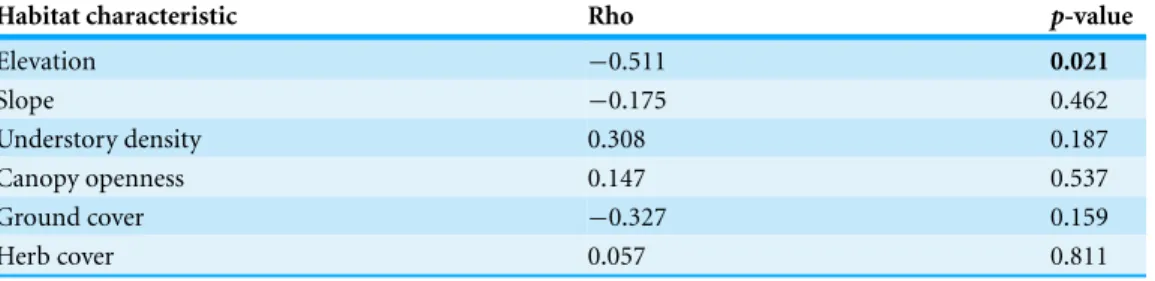
Table 6 Relationships between site characteristics and dissimilarity. Spearman Rank correlations (Rho) and associatedp-values between habitat characteristics and Jaccard’s dissimilarity coefficient. For each site Jaccard’s Index evaluates differences in species composition identified with Point count and ARU methods determined with the simultaneous collection strategy. Significant relationships are indicated in bold.
Habitat characteristic Rho p-value
Elevation −0.511 0.021
Slope −0.175 0.462
Understory density 0.308 0.187
Canopy openness 0.147 0.537
Ground cover −0.327 0.159
Herb cover 0.057 0.811
DISCUSSION
Same-season strategy
ARUs offer a viable alternative to standard point-count methods, especially in the context of large-scale or long-term avian species richness surveys of temperate forest birds. We found no difference in species composition of the regional community detected by point counts or ARUs. Furthermore, even when sample effort was held constant between protocols (representing a conservative estimate of a potential ARU sampling protocol) ARUs identified a greater number of species at sites than point count surveys. This is likely because each site was sampled on 50 different days with ARUs rather than only 2 different days with point counts. This is a clear advantage of ARU methods. Repeated visits to sites over the course of the breeding season should sample the same community of birds because the majority of forest bird species are territorial and breeding is relatively synchronous. Consequently, it is likely that higher richness estimates based on additional surveys with ARUs represent improved estimates, rather than changes in space use by species.
Simultaneous-collection strategy
Fewer species were identified from ARUs than from point counts when data were collected simultaneously. A potential explanation for this difference reflects a common criticism of ARUs: they do not allow visual cues (except for spectrograms) to aide in species identification, representing a shortcoming of audio recording devices. Woodpeckers (Piciformes) in particular, were less frequently identified from ARUs than from point counts. Compared to other groups of birds, little research has been conducted on acoustic communication in woodpeckers (Stark, Dodenhoff& Johnson, 1998). The functions of the majority of acoustic signals used by woodpeckers are not fully understood, and variation in their acoustic behavior has received little attention (Tremain, Swiston & Mennill, 2008). Woodpeckers typically have larger territories and vocalize less frequently compared to most song birds (Blackburn, Lawton & Gaston, 1998;Farnsworth et al., 2002). Moreover, it is unknown if the presence of an observer affects the frequency of acoustic signals by these birds (i.e., warning calls or drumming). Only songs and calls were used to identify bird species from ARU recordings, so even if drumming was recorded (which it frequently was) it was not used as the only source of information for identification. Use of drumming was not used for identification in the field either, however drumming could be used to direct an observer’s attention to facilitate visual identification of the birds, even if the individual was not otherwise vocalizing. This increases the likelihood of detection and could represent a bias in species detection frequencies between methods for woodpeckers. Indeed, when comparing single-visit recordings with field observations, the latter are likely more effective at identifying rarely heard species, whereas recordings would be more beneficial in areas of high species richness when many birds are calling, and repeated listening and viewing of spectrograms can be employed to identify species with overlapping vocalizations (Haselmayer & Quinn, 2000;Hutto & Stutzman, 2009). Importantly, when data collected from ARUs and point counts were compared for the full season (i.e., same-season strategy), no significant difference existed in the frequency of occurrence of woodpeckers. Ultimately, the advantage of being able to sample more frequently or over a longer time frame with ARUs may offset the lack of visual detection associated with ARUs, making ARUs a viable solution to detecting species that vocalize less frequently.
types, preliminary analyses should be conducted to determine if biases exist between habitats included in the program.
Dissimilarity in the identity of species between field surveys and recordings was negatively related to elevation, indicating that lower elevation sites generally shared the lowest proportion of species between surveys and recordings. However, mean elevation of plots only ranged from 96.5–389.33 m above sea level, thus it is unlikely that changes in environmental characteristics (i.e., temperature, solar irradiation, precipitation, productivity, or habitat type) often associated with changes in elevation affected these patterns. Other general site characteristics (e.g., canopy openness or understory density) that might be expected to play a role in interfering with the audio or visual components of surveys were unrelated to differences between recordings and field observations, suggesting that unmeasured aspects of forest structure that co-vary with elevation in this system may influence bird identification (e.g., diversity or richness of trees, vertical heterogeneity of forests). Alternatively, as evidenced by fewer detections of woodpeckers with ARU methods in the simultaneous-collection strategy, not all species have equal detection probabilities. Consequently, it is possible that sites at lower elevations contain a greater number of species with lower acoustic detection probabilities as a result of species-specific elevational associations.
CONCLUSIONS
ARUs provide data on the presence of birds that are comparable to that obtained by field observers. Our results support previous studies in other habitats (Haselmayer & Quinn, 2000;Hobson et al., 2002; Campbell & Francis, 2011;Tegeler, Morrison & Szewczak, 2012) in suggesting that ARUs can be used as a viable alternative to skilled field observers to collect data. However, the full benefit of ARUs will only be realized when they are deployed for an extended duration, rather than a single visit to sites. If single visits to sites or short-term monitoring are the goal, point counts will likely perform better than ARUs, especially if species are rare, or vocalize infrequently. Conversely, if long-term or large-scale monitoring programs are to provide useful estimates to facilitate adaptive management in the face of changing climate and habitats, efforts need to be made to reduce biases and constraints associated with traditional sampling approaches. ARUs do not suffer from the same constraints or biases as do point counts (although they do suffer from different biases). When surveys are executed across remote or large geographic areas, use of ARUs can be logistically and financially more efficient than point counts, creating a permanent record that can easily be archived and shared, and represent important tools for use by biodiversity scientists, conservation biologists or land managers.
ACKNOWLEDGEMENTS
ADDITIONAL INFORMATION AND DECLARATIONS
Funding
This research was supported by set-up funds from the Office of the Vice President for Research (MRW), an IBA Small Grants Program Award from Audubon Connecticut (MRW, BTK, and S Presley) and multiple intramural awards to BTK (Center for Environmental Sciences and Engineering, Department of Ecology and Evolutionary Biology, and Connecticut Museum of Natural History at the University of Connecticut). The funders had no role in study design, data collection and analysis, decision to publish, or preparation of the manuscript.
Grant Disclosures
The following grant information was disclosed by the authors: Office of the Vice President for Research.
Audubon Connecticut.
Competing Interests
The authors declare there are no competing interests.
Author Contributions
• Brian T. Klingbeil conceived and designed the experiments, performed the experiments,
analyzed the data, wrote the paper, prepared figures and/or tables, reviewed drafts of the paper.
• Michael R. Willig conceived and designed the experiments, contributed
reagents/materials/analysis tools, wrote the paper, reviewed drafts of the paper.
Field Study Permissions
The following information was supplied relating to field study approvals (i.e., approving body and any reference numbers):
State of Connecticut Department of Environmental Protection, permit number 1113002.
Supplemental Information
Supplemental information for this article can be found online athttp://dx.doi.org/ 10.7717/peerj.973#supplemental-information.
REFERENCES
Acevedo MA, Villanueva-Rivera LJ. 2006.Using automated digital recording systems as effective tools for the monitoring of birds and amphibians.Wildlife Society Bulletin34:211–214 DOI 10.2193/0091-7648(2006)34[211:UADRSA]2.0.CO;2.
Anderson BW, Ohmart RD, Rice J. 1981.Seasonal changes in avian densities and diversities.
Blackburn TM, Lawton JH, Gaston KJ. 1998.Patterns in the geographic ranges of the world’s woodpeckers.Ibis140:626–638DOI 10.1111/j.1474-919X.1998.tb04708.x.
Blancher PJ, Phoenix RD, Badzinski DS, Cadman MD, Crewe TL, Downes CM, Fillman D, Francis CM, Hughes J, Hussell DJT, Lepage D, McCracken JD, McNicol DK, Pond BA, Ross RK, Russell R, Venier LA, Weeber RC. 2009.Population trend status of Ontario’s forest birds.The Forestry Chronicle85:184–201DOI 10.5558/tfc85184-2.
Best LB. 1981.Seasonal changes in detection of individual bird species. In: Ralph CJ, Scott JM, eds.
Estimating numbers of terrestrial birds,Studies in Avian Biology,vol. 6. New York: Cooper Square Press, 252–261.
Butler BJ. 2013.Connecticut’s forest resources, 2012. Research Note NRS-188, U.S. Department of Agriculture, Forest Service, Northern Research Station, Newtown Square, PA.
Bye SL, Robel RJ, Kemp KE. 2001.Effects of human presence on vocalizations of grassland birds in Kansas.Prairie Naturalist33:249–256.
Campbell M, Francis CM. 2011.Using stereo-microphones to evaluate observer variation
in North American Breeding Bird Survey point counts. The Auk 128:303–312 DOI 10.1525/auk.2011.10005.
Celis-Murillo A, Deppe JL, Allen MF. 2009.Using soundscape recordings to estimate bird
species abundance, richness, and composition.Journal of Field Ornithology 80:64–78 DOI 10.1111/j.1557-9263.2009.00206.x.
Chesser RT, Banks RC, Barker FK, Cicero C, Dunn JL, Kratter AW, Lovette IJ, Rasmussen PC,
Remsen JV, Rising JD, Stotz DF, Winker K. 2013.Fifty-fourth supplement to the American
Ornithologists’ Union check-list of North American birds. The Auk 130:558–572 DOI 10.1525/auk.2013.130.3.558.
CLEAR. 2010a.Landscape Fragmentation Tool (LFT) version 2.0. University of Connecticut.
College of Agriculture and Natural Resources.Available athttp://clear.uconn.edu/tools/lft/lft2/ index.htm.
CLEAR. 2010b.Long island sound watershed’s changing landscape. 2010 data. University of Connecticut. College of Agriculture and Natural Resources.Available athttp://clear.uconn. edu/projects/landscapeLIS/index.htm.
Dickinson JL, Zuckerberg B, Bonter DN. 2010.Citizen science as an eecological research tool: challenges and benefits.Annual Review of Ecology, Evolution, and Systematics41:149–172 DOI 10.1146/annurev-ecolsys-102209-144636.
Dickinson JL, Shirk J, Bonter D, Bonney R, Crain RL, Martin J, Phillips T, Purcell K. 2012.The current state of citizen science as a tool for ecological research and public engagement.Frontiers in Ecology and the Environment10:291–297DOI 10.1890/110236.
Drummond MA, Loveland TR. 2010.Land-use pressure and a transition to forest-cover loss in
the eastern United States.Bioscience60:286–298DOI 10.1525/bio.2010.60.4.7.
Keddy PA, Drummond CG. 1996.Ecological properties for the evaluation, management, and
restoration of temperate deciduous forest ecosystems.Ecological Applications6:748–762 DOI 10.2307/2269480.
Farnsworth GL, Pollock KH, Nichols JD, Simons TR, Hines JE, Sauer JR, Brawn J. 2002.A
removal model for estimating detection probablilities from point-count surveys.The Auk 119:414–425DOI 10.1642/0004-8038(2002)119[0414:ARMFED]2.0.CO;2.
Francis CM, Blancher PJ, Phoenix RD. 2009.Bird monitoring programs in Ontario: what have we
Furnas BJ, Callas RL. 2015.Using automated recorders and occupancy models to monitor common forest birds across a large geographic region.The Journal of Wildlife Management 79:325–337DOI 10.1002/jwmg.821.
Haselmayer J, Quinn JS. 2000. A comparison of point counts and sound recording
as bird survey methods in Amazonian Southeast Peru. The Condor 102:887–893 DOI 10.1650/0010-5422(2000)102[0887:ACOPCA]2.0.CO;2.
Hejl SJ, Thompson TG. 2000.The effect of time period on point count methodology for
monitoring breeding birds. In: Smith HY, ed.The bitterroot ecosystem management research project: what we have learned: symposium proceedings. Missoula, MT. Proc. RMRS-P-17. Ogden: US Department of Agriculture, Forest Service, Rocky Mountain Research Station.
Hobson KA, Rempel RS, Hamilton G, Turnbull B, Wilgenburg SLV. 2002.Acoustic surveys of
birds using electronic recordings: new potential from an omnidirectional microphone system.
Wildlife Society Bulletin30:709–720.
Hutto RL, Stutzman RJ. 2009.Humans versus autonomous recording units: a comparison of
point-count results.Journal of Field Ornithology80:387–398 DOI 10.1111/j.1557-9263.2009.00245.x.
Jenni L, Kery M. 2003.Timing of autumn bird migration under climate change: advances in
long-distance migrants, delays in short-distance migrants.Proceedings of the Royal Society of London Series B: Biological Sciences270:1467–1471DOI 10.1098/rspb.2003.2394.
Monkkonen M. 1994.Diversity patterns in Palaearctic and Nearctic forest bird assemblages.
Journal of Biogeography21:183–195DOI 10.2307/2845471.
North American Bird Conservation Initiative, U.S.C. 2011.The state of the birds 2011. Report on Public Lands and Waters. Washington, D.C.: United States Department of the Interior.
Price CA, Lee H-S. 2013.Changes in participants’ scientific attitudes and epistemological beliefs during an astronomical citizen science project.Journal of Research in Science Teaching 50:773–801DOI 10.1002/tea.21090.
Ralph CJ. 1981.An investigation of the effect of seasonal activity levels on avian censuring. In: Ralph CJ, Scott JM, eds.Estimating numbers of terrestrial birds,Studies in Avian Biology,
vol. 6. New York: Cooper Square Press, 265–270.
Ralph CJ, Sauer JR, Droege S. 1995.Monitoring bird populations by point counts. General
Technical Report PSW-GTR-149. Albany: US Department of Agriculture, Forest Service, Pacific Southwest Research Station.
Rempel RS, Hobson KA, Holborn G, Van Wilgenburg SL, Elliott J. 2005.Bioacoustic monitoring
of forest songbirds: interpreter variability and effects of configuration and digital processing methods in the laboratory.Journal of Field Ornithology76:1–11DOI 10.1648/0273-8570-76.1.1.
Rempel RS, Francis CM, Robinson JN, Campbell M. 2013.Comparison of audio recording system
performance for detecting and monitoring songbirds.Journal of Field Ornithology84:86–97 DOI 10.1111/jofo.12008.
Rosenstock SS, Anderson DR, Giesen KM, Leukering T, Carter MF, Thompson III F. 2002.
Landbird counting techniques: current practices and an alternative.The Auk119:46–53 DOI 10.1642/0004-8038(2002)119[0046:LCTCPA]2.0.CO;2.
Sauer JR, Fallon JE, Johnson R. 2003.Use of North American Breeding Bird Survey data to
Skirven AA. 1981.Effect of time of day and time of season on the number of observations and density estimates of breeding birds. In: Ralph CJ, Scott JM, eds.Estimating numbers of terrestrial birds,Studies in Avian Biology,vol. 6. New York: Cooper Square Press, 271–274.
Stark RD, DodenhoffDJ, Johnson EV. 1998.A quantitative analysis of woodpecker drumming.
The Condor100:350–356DOI 10.2307/1370276.
Tegeler AK, Morrison ML, Szewczak JM. 2012.Using extended-duration audio recordings to
survey avian species.Wildlife Society Bulletin36:21–29DOI 10.1002/wsb.112.
Tremain SB, Swiston KA, Mennill DJ. 2008.Seasonal variation in acoustic signals of Pileated Woodpeckers.The Wilson Journal of Ornithology120:499–504DOI 10.1676/07-137.1.
Van Buskirk J, Mulvihill RS, Leberman RC. 2009.Variable shifts in spring and autumn migration
phenology in North American songbirds associated with climate change.Global Change Biology 15:760–771DOI 10.1111/j.1365-2486.2008.01751.x.
Venier LA, Holmes SB, Holborn GW, McIlwrick KA, Brown G. 2012. Evaluation of an
automated recording device for monitoring forest birds.Wildlife Society Bulletin36:30–39 DOI 10.1002/wsb.88.
Walther G-R, Post E, Convey P, Menzel A, Parmesan C, Beebee TJC, Fromentin J-M,
Hoegh-Guldberg O, Bairlein F. 2002.Ecological responses to recent climate change.Nature
416:389–395DOI 10.1038/416389a.
Whittaker RH. 1972.Evolution and measurement of species diversity.Taxon21:213–251