FREE THEMES
1 Faculdade de Nutrição, Universidade Federal de Mato Grosso. Av. Fernando Corrêa da Costa 2367/ Faculdade de Nutrição, Boa Esperança. 78060-900 Cuiabá MT Brasil. [email protected] 2 Departamento de Nutrição Social e Aplicada, Universidade Federal do Rio de Janeiro. Rio de Janeiro RJ Brasil.
Feasibility of using of a simplified question
in assessing diet quality of adolescents
Abstract This study aims to analyze the appli-cability of a simplified question in assessing diet quality of adolescents in a cross-sectional school-based study carried out in a sample of high school students. Diet quality self-perception was ob-tained when the participant was inquired about own diet considering “excellent”, “good”, “fair” or “poor” responses. We evaluated meals habits and food intake through food frequency questionnaire. The revised version of the Brazilian Healthy Eat-ing Index (BHEI-R) was estimated and we iden-tified three dietary patterns using factor analysis. “Good” self-perceived diet quality was reported by 56% of adolescents and was associated with regular consumption of fruits and vegetables, meal profile and high healthy eating index scores. However, consumption of foods harmful to health was not perceived as characteristic that affects diet quality. The evaluated question showed sensitivity of 28% to detect good quality diets and specificity of 79% to identify low nutritional value diets. The use of a simplified question to assess dietary habits of adolescents is limited, since the consumption of high-fat, high-sugar and high-sodium food was not recognized as an indicator of low quality diet.
Key words Self-perception of diet, Diet quality,
Eating habits, Adolescents Paulo Rogério Melo Rodrigues 1
Regina Maria Veras Gonçalves-Silva 1 Márcia Gonçalves Ferreira 1
R
o
dr
igues PRM Introduction
Eating habits during adolescence have been char-acterized by the high consumption of unhealthy food markers, such as sugar-added beverages, processed foods, rich in saturated fats, added sugar and sodium, as well as low intake of fruits and vegetables1,2. These habits are typical of
con-temporary nutritional transition2 and are
associ-ated with an increased risk of obesity, cardiovas-cular diseases and diabetes3,4.
Considering that childhood and adolescence obesity is one of the main problems of public health in the world5, it is necessary to implement
simplified indicators to monitor this condition and its main determinants, among them food in-take, since it is known that adolescent food habits include unhealthy and high energy density food6.
Similar to what happens with self-perception of health status, an attribute for which studies reveal a significant association between self-per-ception of good health and healthy behaviors related to the lifestyle of adolescents7,8, the
per-ception regarding diet quality can be a useful tool in epidemiological surveys, providing, through a simple question, a subjective assessment and a summary measure of diet quality. This assump-tion is based on the fact that theoretical models for food choices suggest that individual charac-teristics such as food knowledge and perception are key determinants for food selection1,9.
Diet quality perception may be related to knowledge about nutrition, for which a sig-nificant association with diet quality was ob-served10-12. However, diet quality self-perception
has still been an underexplored indicator, despite its potential to identify intervention-targeted groups, aiming at promoting a healthy lifestyle, similarly to what occurs with the self-perceived health indicator.
This study aimed to evaluate the applicability of a simplified question to assess the diet quality of adolescents, exploring the association between diet quality self-perceived and eating habits in-dicators.
Methodology
This is a cross-sectional, school-based study with adolescents of both sexes, aged 14 to 19 years, regularly enrolled in the public and private high schools in the urban area of Cuiabá, Mato Gros-so, in 2008, which initially aimed to evaluate eat-ing disorders risk behaviors.
For the calculation of the sample size, we considered a 95% confidence level, a sample er-ror of 3%, and since specific studies on adoles-cent eating disorders risk behaviors in the mu-nicipality studied were unknown for calculating the sample, we considered a prevalence of 0.50. The sample size was estimated at 1,067 adoles-cents, corrected at 20% to cater for the effect of sample design in clusters (deff = 1.2), totaling 1,280 adolescents. Further details are described in Rodrigues et al.13.
The Research Ethics Committee, Júlio Muller University Hospital, Federal University of Mato Grosso approved the research under protocol Nº 459/CEP-HUJM/07. All adolescents and/or their parents/guardians signed the Informed Consent Form in agreement to participate in the survey, and school principals authorized data collection.
Data collection
A standardized training was performed for data collection, which included the implementa-tion of a self-responded pre-tested quesimplementa-tionnaire containing questions on demographic and socio-economic characteristics, lifestyle, eating habits, and a semi-quantitative Food Frequency Ques-tionnaire (FFQ). We conducted at least three vis-its to schools to reduce the non-response rate, in order to find students missed in previous visits.
Diet quality self-perceived
Diet quality self-perception was obtained through the question: “In your opinion, the qual-ity of your diet is…?” Having as answer options: “Excellent”, “Good”, “Fair”, “Bad” or “Poor”. In the statistical analysis, answers were grouped in: 1) Diet quality perceived as “Good” (“Excellent” and “Good”) and 2) Diet quality perceived as “Bad” (“Fair”, “Bad” and “Poor”).
Information on eating habits and knowledge about healthy eating
We applied the modified FFQ for adoles-cents13 to evaluate food consumption, consisting
of 76 food items, eight-response options for re-porting consumption frequency, ranging from more than 3 times a day to never or almost never and up to three portions.
usu-aúd
e C
ole
tiv
a,
22(5):1565-1578,
2017
ally eat vegetables at least 5 times a week?” (Not considering potato, yam, cassava...), both with answer options: “Yes” or “No”.
Similarly, we evaluated the habit of consum-ing chicken skin and meat visible fat usconsum-ing the questions: “When you eat chicken, how often do you eat the skin?” and “When you eat meat, how often do you eat visible fat?” Both of which had answer options: “Never”, “Sometimes” and “Al-ways”, with analyses grouped in “Yes” (“Always” and “Sometimes”) and “No” (Never).
We assessed knowledge about healthy eating by asking: “Do you have knowledge about healthy eating?” with “Yes” or “No” as answer choices.
It should be noted that both questions about healthy eating and diet quality self-perception were located in the questionnaire applied in the research after the FFQ, so as not to influence the consumption report.
We used Nutwin software to evaluate adoles-cent food intake in relation to its nutrient con-tent14. Food was grouped as per the Food Guide
for the Brazilian Population15. Preparations
in-volving more than one food group, such as sand-wiches, pizzas, stuffed pasta and other mixtures were broken up into their ingredients and clas-sified into the corresponding groups. Regarding food not available in the program database, in-formation was obtained from the Nutrition Data System for Research - NDSR16 and from the
Bra-zilian Food Composition Table - TACO17.
Diet quality evaluation
The Brazilian Healthy Eating Index – Revised (BHEI-R)18 was used to evaluate the diet
quali-ty of adolescents. This index is based on recom-mendations related to food, protective aspects, especially in the Food Guide for the Brazilian Population15, and is estimated by 12 components
that characterize different dietary aspects, such as consumption of vegetables, beneficial fats and calories provided by “solid fats, alcoholic bever-ages, and added sugars (“SoFAAS” component).
BHEI-R components are based on food groups (total fruits, whole fruits, total vegetables, dark green and orange vegetables and legumes, total grains, whole grains, meats, eggs and veg-etables, milk and dairy products, oils and fish fat), nutrients (saturated fat and sodium) and nutrients combined with food (“SoFAAS” com-ponent). The score assigned to each component is expressed in three levels: maximum, interme-diate and minimum. BHEI-R total score is 100 points, and high scores indicate a diet that is
closer to the ideal level, while low scores charac-terize a diet that is far from ideal. In this study, the BHEI-R included only 11 components, due to the lack of specifications on the type of cereals in the FFQ; thus, scores assigned to the “whole grains” component were added to the “total cere-als” component. The detailed description of the criteria for minimum, intermediate and maxi-mum score of each component can be found in Previdelli et al.18.
In this study, the total BHEI-R score and its components were dichotomized at above and below the 75th percentile (P75). Values equal to
or higher than P75 were considered high because they represent the quartile with the highest score, indicating a better diet quality, since the BHEI-R evaluates the level of adherence of the diet to nu-tritional recommendations.
Meal habits
The usual frequency of meal consumption (i.e., breakfast, morning snack, lunch, afternoon snack, and dinner) was ascertained by the ques-tion, “On average, how often did you have these meals in the past 6 months?” The response op-tions were as follows: every day, three to six times per week, one to two times per week, or never.
Each subject was categorized according to the frequency of consumption of a meal into: Satis-factory (≥ 3 main meals a day); Irregular (1 or 2 of the three main meals a day) or Unsatisfactory (none of the three main meals a day)15.
Adoles-cents with satisfactory and irregular meal profiles may or may not include one or more snacks daily, while adolescents with unsatisfactory meal pro-file, who did not have any of the main meals on a regular basis, usually consumed snacks frequently.
Identification of dietary patterns
The identification of dietary patterns is de-scribed in Rodrigues et al.13, but was based in
short on the frequency of consumption of 22 food groups, using the exploratory factorial anal-ysis, and for the extraction of the factors, we pro-ceeded with the principal components analysis, followed by the Varimax rotation. The determi-nation of the number of factors to be extracted was based on Cattel’s scree plot test, where the identified patterns were named based on the in-terpretability and characteristics of the items re-tained in each pattern.
R
o
dr
igues PRM processed products, dairy products, preserved
meats, sweetened beverages, fast food, fried plan-tains and sweets; “Traditional”, consisting of rice, beans, breads, milk, beef, coffee, butter and mar-garine; and “Mixed”, consisting of noodles, tu-bers and roots, other meats, fish, eggs, vegetables and greens.
Demographic and socioeconomic data
The socioeconomic level of the families was evaluated using the criteria of the Brazilian Asso-ciation of Research Companies19, which considers
the schooling of the head of the family, house-hold assets and cars and househouse-hold monthly wage earner domestic servants, with families classified into categories ranging from A (highest level) to E (lowest level).
Age was obtained by calculating the differ-ence between the questionnaire implementation date and the date of birth, the result being ex-pressed in complete years of life and classified into two categories: 14-15 years and 16-19 years. We also evaluated school characteristic by type of school (private and state/federal public).
Information on lifestyle and weight status
Physical activity was investigated as to the type, frequency and duration of each practiced activity. To classify the level of physical activity, we estimated the weekly time dedicated to physi-cal activities, multiplying daily time (in minutes) by the weekly frequency with which activities were performed. The categorization suggested by Currie et al.20, which defines as physically inactive
the adolescent who reports the lack physical ac-tivity, as insufficiently active the one who practic-es up to 299 minutpractic-es of physical activity per week and active the adolescent who practices at least 300 minutes of physical activity weekly.
Data on the consumption of alcoholic bever-ages (beer, wine and/or distillates) were obtained through a food frequency questionnaire and were related to the six months prior to the survey, and the adolescents were classified according to the intake of alcoholic beverage or not, regardless of quantity, frequency and type of drink reported. Smoking was assessed according to World Health Organization criteria21, which considers a smoker
as the individual who reported smoking at least one day in the last 30 days
Body Mass Index (BMI = kg/m2) was
esti-mated to classify the weight status of adolescents using the Z-scores of the BMI22, were adolescents
with BMI/age ≤ +1 Z-score were categorized as normal weight; and those with BMI/age > +1 Z-score as having excess weight, including over-weight and obesity in this category. It should be noted that the BMI was calculated based on measures of weight and height self-referred by adolescents and that the report of these measures was validated by Rodrigues et al.23 for use in
epi-demiological studies with adolescents of the mu-nicipality evaluated in this study.
Data analysis
Statistical analyzes were developed consid-ering weighting factors and sample design, us-ing command “weight cases” of the statistical program Statistical Package for Social Science version 17.0 (SPSS Inc., Chicago, IL, USA) and software WIN PEPI Version 11.7.
The analyses were conducted separately by gender due to significant differences in diet qual-ity self-perceived reporting between boys and girls. The chi-square test was used in the univar-iate analysis to evaluate the relationship between diet quality self-perception and demographic, socioeconomic, lifestyle, weight status, knowl-edge about healthy eating, eating habits and diet quality indicators variables.
Multivariate logistic regression models were developed using Odds Ratio (OR) and respec-tive Confidence Intervals of 95% (95% CI) as a measure of association, considering as outcome variable the diet quality self-perception as “good” and testing as predictive factors the independent variables with p-value < 0.20 in the univariate analysis. Firstly, crude models were developed, that is, each independent variable was separate-ly included and later a model adjusted for age, physical activity level and school type was devel-oped.
Additionally, we performed a sensitivity, specificity and accuracy analysis of the question evaluated in the classification of the quality of adolescents’ diet, considering the total BHEI-R above the 75th percentile as the reference of the
best diet quality.
Results
aúd
e C
ole
tiv
a,
22(5):1565-1578,
2017
2 standard deviations below or above the mean were excluded from the analysis because these values were considered biologically implausible as usual intake. Thus, the analyses were conduct-ed with 1,139 adolescents (84.7% of the total eli-gible adolescents).
Among the adolescents evaluated, 56% were female, 66% were in the age group 16-19 years, 77% were students of schools in the state and federal public schools and 53% belonged to the most favored social classes (Table 1).
Diet quality self-perception as “good” was reported by 56% of adolescents (64% of boys and 50% of girls, p < 0.01). Students in private schools and state schools reported a good quali-ty diet in a higher proportion when compared to students in the federal public school (p = 0.06). Diet quality self-perception was also associated with physical activity, since of the active adoles-cents, 64% considered their diet of good quality, while among the insufficiently active, 53% re-ported good quality diet, and among the physi-cally inactive, this proportion was 47% (p < 0.01) (Table 1).
We found that among adolescents who re-ported fruit consumption ≥ 5 times a week, diet quality self-perception as “good” was observed in 63% of adolescents (p < 0.01) and in the con-sumption of vegetables ≥ 5 times/week, this pro-portion was 62% (p < 0.01). Among adolescents who reported having knowledge about healthy eating, 59% reported as having good quality diet (p < 0.01). Diet self-perceived as “good” was ob-served in 69% of adolescents with a satisfactory meal profile, in 56% of those with an irregular eating profile and in 31% of those with an un-satisfactory meal profile (p < 0.01). Diet quali-ty self-perception was also associated with the “Mixed” dietary pattern (p < 0.01) (Table 2).
However, no association was observed be-tween diet quality self-perceived with unhealthy food markers, such as chicken skin consumption (p = 0.79) and visible meat fat (p=1.00) and nei-ther with “Western” and “Traditional” dietary patterns (Table 2).
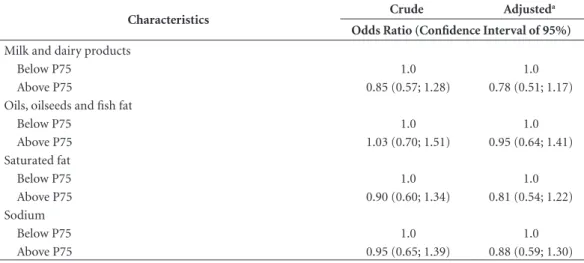
Adolescents with diet quality self-perceived as “good” showed higher scores for the follow-ing BHEI-R components: “Total Fruits”, “Whole Fruits”, “Total Vegetables” and “Dark Green and Orange Vegetables and Legumes” (p ≤ 0.01) and for “Milk and dairy products”, “Oils, oilseeds and fish fat” and “Sodium” (p < 0.05) (Table 3). However, health-risk markers, such as “saturated fat” and “SoFAAS” were not associated with diet quality self-perceived (Table 3).
In adjusted multivariate logistic regression models for boys, the probability of diet quality self-perceived as “good” was higher for adoles-cents who were physically active (OR = 2.38), those reporting consumption of vegetables ≥ 5 times/week (OR = 1,94), those with knowledge about healthy food (OR = 4.87), those with a satisfactory meal profile (OR = 5.15) and irreg-ular meal profile (OR = 2.92) and those who had scores above the 75th percentile for total BHEI-R
(OR = 1.59) (Table 4).
For girls, the likelihood of diet quality self-perceived as “good” was also higher for those who consumed fruits (OR = 1.94) and vegeta-bles (OR = 1.74) ≥ 5 times/week, had knowledge about healthy food (OR = 1.78), with satisfacto-ry meal profile (OR = 4.10) and irregular meal profile (OR = 2.73) and factorial scores above the 75th percentile for the “Western” (OR = 1.47) and
“Mixed” (OR = 1.79) dietary pattern. In addi-tion, the probability of diet quality self-perceived as “good” was higher for those who had scores above the 75th percentile for various BHEI-R
components: Total fruits (OR = 1.55), Whole fruits (OR = 1.77), Total vegetables (OR = 1.71), Dark green and orange vegetables and legumes (OR = 1.71), Meat, eggs and legumes (OR = 1.55), Milk and dairy products (OR = 1.80) and oils, oilseeds and fish fat (OR = 1.55) (Table 5).
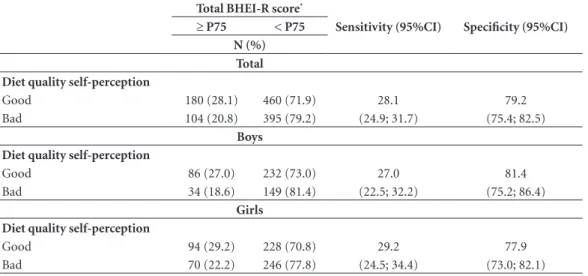
In order to detect good quality diets consid-ering the 75th percentile of the BHEI-R as a
refer-ence, the simplified question showed a sensitivity of 28.1% (Confidence Interval of 95% [95% CI] = 24.9;31.7) and specificity of 79.2% (95% CI = 75.4;82.5). Subtle differences in sensitivity and specificity for boys and girls were not statistically significant (Table 6).
Discussion
R
o
dr
igues PRM
products, sweetened drinks, sweets and fast-food, represented by the “Western” food standard was not perceived by adolescents as a characteristic of low quality diets. Additionally, we observed that the evaluated question had high specificity to de-tect adolescents with low quality diets, facilitat-ing the screenfacilitat-ing for inclusion of adolescents in nutritional intervention proposals. However, the low sensitivity shown by the question to detect good quality diets indicates that a high propor-tion of adolescents who reported having good quality diets actually had inadequate food intake, incompatible with perception of their diet.
In general, despite the limited number of studies evaluating the self-perceived quality of diet in adolescents, the association between fruit and vegetable consumption and the perception of good food intake has been consistently
report-ed and was verifireport-ed in American6,24, Irish25 and
Brazilian1 children and adolescents.
In this study, the satisfactory meal profile was positively associated with diet quality self-per-ceived as good. However, adherence to the “Tradi-tional” dietary pattern, characterized by the con-sumption of rice and beans, a typical combination of Brazilian meals, was not associated with the perception of good quality diet, evidencing that, possibly, the consumption of this basic food is not perceived as a healthy eating component. Con-sumption of this pattern has been associated with positive outcomes in observational and interven-tional studies with adults26,27 and adolescents13,
however, it is possible that adolescents do not as-sociate their consumption with healthy food.
In addition, there is no association between the diet quality self-perception and the excessive
Table 1. Diet quality self-perception according to demographic, socioeconomic, lifestyle, and weight status characteristics of adolescents (n = 1,139). Cuiabá, Mato Grosso, 2008.
Variables Total
Diet quality self-perception
P-value*
Good (n = 640) Bad (n = 499)
N (%) %
Sex < 0.01
Boys 501 (44) 64 36
Girls 638 (56) 50 50
Age (in years) 0.48
14 - 15 389 (34) 55 45
16 - 19 750 (66) 57 43
Type of school 0.06
Federal public 53 (5) 40 60
Private 266 (23) 57 43
State public 821 (72) 57 43
Socioeconomic level 0.92
A + B 603 (53) 56 44
C + D 536 (47) 56 44
Smoking 0.59
Yes 67 (6) 53 47
No 1072 (94) 56 44
Consumption of alcoholic beverages 0.50
Yes 442 (39) 58 42
No 697 (61) 55 45
Physical activity < 0.01
Physically inactive 246 (22) 47 53
Insufficiently active 427 (37) 53 47
Physical activity 467 (41) 64 36
Weight status 0.40
Normal weight 949 (83) 57 43
Excess weight 190 (17) 53 47
aúd
e C
ole
tiv
a,
22(5):1565-1578,
2017
intake of risk components, such as saturated fats, sugar and sodium. It should be emphasized that such components are found in preparations that are not always identified as “unhealthy” and are not intuitively associated with deleterious ef-fects on health. Regarding processed foods, it is necessary to read the information on products’ labels, which is not always the habit of many ad-olescents; moreover, the understanding of infor-mation contained therein is not simple28. Thus,
it is understandable that adolescents no longer associate the consumption of food with excess saturated fat, sugar and sodium and diet quality. However, this finding indicates the need to
rein-force these aspects in the proposals to promote healthy eating and nutrition education activities, in order to restrict the intake of these foods.
Similar to that observed among adolescents in this study, Velazquez et al.6, when evaluating
Texas adolescents with a mean age of 15 years, found that adolescents with self-perception of healthy eating habits were more likely to report higher food consumption such as grains, fruits, vegetables and legumes. On the other hand, the group that reported having knowledge about the fat content of food did not reflect this knowledge in food choices, with preference for less healthy food6.
Table 2. Diet quality self-perception according to eating habits and knowledge about healthy eating of adolescents (n = 1,139). Cuiabá, Mato Grosso, 2008.
Variables Total
Diet quality self-perception
P-value*
Good (n = 640) Bad (n = 499)
N (%) %
Consumption of fruit at least 5 x / week < 0.01
Yes 585 (51) 63 37
No 554 (49) 49 51
Consumption of vegetables at least 5 x / week < 0.01
Yes 652 (57) 62 38
No 487 (43) 48 52
Consumption of chicken skin 0.79
Yes 657 (58) 57 43
No 482 (42) 56 44
Consumption oh meat visible fat 1.00
Yes 687 (60) 56 44
No 452 (40) 56 44
Knowledge about healthy eating < 0.01
Yes 1000 (88) 59 41
No 139 (12) 34 66
Meal profile < 0.01
Satisfactory 322 (28) 69 31
Irregular 653 (57) 56 44
Unsatisfactory 164 (15) 31 69
Dietary pattern “Western” 0.17
Above P75 291 (25) 60 40
Below P75 848 (75) 55 45
Dietary pattern “Traditional” 0.24
Above P75 280 (25) 59 41
Below P75 859 (75) 55 45
Dietary pattern “Mixed” 0.01
Above P75 294 (25) 63 37
Below P75 845 (75) 54 46
R
o
dr
igues PRM
In this context, Fitzgerald et al.12 point out
that food preferences, particularly food taste, tex-ture and appearance were more important fac-tors in the choice of food consumed by Irish chil-dren and adolescents between 9 and 18 years of age, in replacement of knowledge about healthy eating. In addition, additional barriers were
availability of food at home, friends, school diet, eating out, extracurricular activities, and parents’ work schedules12.
Paquette29 points out that the development
of nutritional science has made the definition of healthy foods complex, such as determining the type of fat. This complexity may hinder the
Table 3. Diet quality self-perception according to the Brazilian Healthy Eating Index – Revised (BHEI-R) and its components of adolescents (n = 1,139). Cuiabá, Mato Grosso, 2008.
Components Total
Diet quality self-perception
P-value*
Good (n = 640) Bad (n = 499)
N (%) %
BHEI - R 0.01
Above P75 284 (25) 63 37
Below P75 855 (75) 54 46
Total fruits < 0.01
Above P75 293 (26) 64 36
Below P75 846 (74) 54 46
Whole fruits < 0.01
Above P75 295 (26) 65 35
Below P75 844 (74) 53 47
Total vegetables < 0.01
Above P75 281 (25) 64 36
Below P75 858 (75) 54 46
DGVL** 0.01
Above P75 282 (25) 63 37
Below P75 857 (75) 54 46
Total cereals 0.59
Above P75 289 (25) 58 42
Below P75 850 (75) 56 44
Meat, eggs and legumes 0.09
Above P75 291 (26) 61 39
Below P75 848 (74) 55 45
Milk and dairy products 0.03
Above P75 291 (25) 62 38
Below P75 848 (75) 54 46
Oils, oilseeds and fish fat 0.02
Above P75 290 (25) 62 38
Below P75 849 (75) 54 46
Saturated fat 0.17
Above P75 295 (26) 60 40
Below P75 844 (74) 55 45
Sodium 0.04
Above P75 291 (26) 62 38
Below P75 848 (74) 54 46
SoFAAS *** 0.62
Above P75 292 (26) 58 42
Below P75 847 (74) 56 44
* Chi-square test.
aúd
e C
ole
tiv
a,
22(5):1565-1578,
2017
Table 4. Odds Ratio (OR) and Confidence Interval of 95% [95% CI] between characteristics of adolescents with indicators of diet quality and diet quality self-perception in male adolescents (n = 501). Cuiabá, Mato Grosso, 2008.
Characteristics Crude Adjusted
a
Odds Ratio (Confidence Interval of 95%)
Type of school
Federal public 1.0 1.0
Private 2.22 (0.95; 5.20) 2.21 (0.92; 5.30)
State public 2.06 (0.92; 4.62) 1.87 (0.82; 4.26)
Physical activity
Physically inactive 1.0 1.0
Insufficiently active 1.26 (0.64; 2.47) 1.39 (0.70; 2.76)
Physical activity 2.26 (1.19; 4.31)** 2.38 (1.25; 4.55)** Consumption of fruit at least 5 x / week
No 1.0 1.0
Yes 1.45 (1.00; 2.09) 1.38 (0.95; 2.00)
Consumption of vegetables at least 5 x / week
No 1.0 1.0
Yes 1.93 (1.33; 2.78)** 1.94 (1.33; 2.83)**
Knowledge about healthy eating
No 1.0 1.0
Yes 5.28 (2.86; 9.76)** 4.87 (2.60; 9.11)**
Meal profile
Unsatisfactory 1.0 1.0
Irregular 2.98 (1.52; 5.86)** 2.92 (1.47; 5.82)**
Satisfactory 5.10 (2.50; 10.38)** 5.15 (2.49; 10.65)**
Dietary pattern “Western”
Below P75 1.0 1.0
Above P75 0.90 (0.58; 1.38) 0.86 (0.55; 1.33)
Dietary pattern “Mixed”
Below P75 1.0 1.0
Above P75 1.03 (0.69; 1.52) 0.93 (0.62; 1.40)
Brazilian Healthy Eating Index - Revised
Below P75 1.0 1.0
Above P75 1.64 (1.05; 2.57)* 1.59 (1.01; 2.51)*
Total fruits
Below P75 1.0 1.0
Above P75 1.43 (0.93; 2.19) 1.32 (0.85; 2.04)
Whole fruits
Below P75 1.0 1.0
Above P75 1.31 (0.86; 1.99) 1.17 (0.76; 1.80)
Total vegetables
Below P75 1.0 1.0
Above P75 1.27 (0.82; 1.98) 1.27 (0.81; 1.99)
DGVLb
Below P75 1.0 1.0
Above P75 1.16 (0.74; 1.80) 1.09 (0.69; 1.72)
Meat, eggs and legumes
Below P75 1.0 1.0
Above P75 0.88 (0.59; 1.30) 0.86 (0.58; 1.29)
R
o
dr
igues PRM
Characteristics Crude Adjusted
a
Odds Ratio (Confidence Interval of 95%)
Milk and dairy products
Below P75 1.0 1.0
Above P75 0.85 (0.57; 1.28) 0.78 (0.51; 1.17)
Oils, oilseeds and fish fat
Below P75 1.0 1.0
Above P75 1.03 (0.70; 1.51) 0.95 (0.64; 1.41)
Saturated fat
Below P75 1.0 1.0
Above P75 0.90 (0.60; 1.34) 0.81 (0.54; 1.22)
Sodium
Below P75 1.0 1.0
Above P75 0.95 (0.65; 1.39) 0.88 (0.59; 1.30)
* P-value < 0.05; **P-value ≤ 0.01. P75 = 75th percentile. a Adjusted for age, physical activity level and type of school. b DGVL = Dark green and orange vegetables & legumes.
Table 4. continuation
understanding of nutritional recommendations and consequently reflect in the lack of associa-tion between what young people perceive as un-healthy and customary consumption.
Thus, it would be important to foster ini-tiatives that provide greater understanding on the part of adolescents on the importance of food and its impacts on health, as demonstrat-ed by Cunha et al.30, who observed a significant
reduced consumption of sweetened drinks and cookies and increased intake of fruits in inter-vention study on adolescents of public schools of Duque de Caxias, Rio de Janeiro. In addition, ad-olescents in the Federal District between 10 and 19 years of age reported that educational mate-rials to promote healthy eating should reinforce the immediate benefits, using alarming messages about health risks from inadequate diet1.
Some limitations of this study may be high-lighted; among them, the instrument used to evaluate food consumption, namely, the FFQ, designed to estimate individuals’ usual consump-tion, which has advantages for epidemiological studies, such as not being subject to intraperson-al variation effect and practicintraperson-ality and low cost in data collection. However, this method also has limitations, especially those related to cognition, memory and individual food preferences31.
Another limitation inherent to the FFQ used is that it did not contain questions about the
in-take of whole grains, invalidating the effort to score this component, as predicted by Previdel-li et al.18. Thus, the “whole grains” component
score was redistributed to the “total cereals” com-ponent. Moreover, the very complexity and mul-tidimensionality of diet quality construct are fac-tors that may explain the difficulty of observing the association between self-perception and the consumption of certain foods, as well as it influ-ences the adolescent’s own perception.
It should be noted that a favorable aspect of this study is that BHEI-R, considered as a ref-erence in the analysis of the diagnostic capacity of the simplified question used to evaluate diet quality is a global indicator that is based on com-ponents that characterize different aspects of the diet, both healthy and unhealthy, and is consid-ered a reliable and valid index to assess and mon-itor the quality of the Brazilian diet32.
aúd
e C
ole
tiv
a,
22(5):1565-1578,
2017
Table 5. Odds Ratio (OR) and Confidence Interval of 95% [95% CI] between characteristics of adolescents with indicators of diet quality and diet quality self-perception in female adolescents (n = 638). Cuiabá, Mato Grosso, 2008.
Characteristics Crude Adjusted
a
Odds Ratio (Confidence Interval of 95%)
Type of school
Federal public 1.0 1.0
Private 1.68 (0.71; 3.99) 1.82 (0.76; 4.35)
State public 1.94 (0.87; 4.37) 2.07 (0.91; 4.69)
Physical activity
Physically inactive 1.0 1.0
Insufficiently active 1.22 (0.85; 1.76) 1.28 (0.88; 1.85)
Physical activity 1.42 (0.94; 2.15) 1.45 (0.95; 2.20)
Consumption of fruit at least 5 x / week
No 1.0 1.0
Yes 1.99 (1.46; 2.73)** 1.94 (1.40; 2.70)**
Consumption of vegetables at least 5 x / week
No 1.0 1.0
Yes 1.74 (1.26; 2.39)** 1.74 (1.26; 2.40)**
Knowledge about healthy eating
No 1.0 1.0
Yes 1.78 (1.11; 2.86)* 1.78 (1.10; 2.89)*
Meal profile
Unsatisfactory 1.0 1.0
Irregular 2.69 (1.73; 4.18)** 2.73 (1.75; 4.25)**
Satisfactory 4.10 (2.44; 6.88)** 4.10 (2.43; 6.93)**
Dietary pattern “Western”
Below P75 1.0 1.0
Above P75 1.54 (1.09; 2.19)* 1.47 (1.03; 2.10)*
Dietary pattern “Mixed”
Below P75 1.0 1.0
Above P75 1.83 (1.25; 2.68)** 1.79 (1.22; 2.64)**
Brazilian Healthy Eating Index - Revised
Below P75 1.0 1.0
Above P75 1.45 (1.01; 2.07)* 1.44 (1.00; 2.06)
Total fruits
Below P75 1.0 1.0
Above P75 1.60 (1.12; 2.30)** 1.55 (1.07; 2.23)*
Whole fruits
Below P75 1.0 1.0
Above P75 1.86 (1.29; 2.68)** 1.77 (1.21; 2.58)**
Total vegetables
Below P75 1.0 1.0
Above P75 1.74 (1.21; 2.49)** 1.71 (1.19; 2.46)**
DGVLb
Below P75 1.0 1.0
Above P75 1.74 (1.22; 2.48)** 1.71 (1.19; 2.46)**
Meat, eggs and legumes
Below P75 1.0 1.0
Above P75 1.62 (1.11; 2.36)** 1.55 (1.06; 2.28)*
R
o
dr
igues PRM
Table 6. Sensitivity and specificity of a simplified question used in assessing the diet quality self-perception. Cuiabá, Mato Grosso, 2008.
Total BHEI-R score*
Sensitivity (95%CI) Specificity (95%CI)
≥ P75 < P75
N (%) Total Diet quality self-perception
Good 180 (28.1) 460 (71.9) 28.1 79.2
Bad 104 (20.8) 395 (79.2) (24.9; 31.7) (75.4; 82.5)
Boys Diet quality self-perception
Good 86 (27.0) 232 (73.0) 27.0 81.4
Bad 34 (18.6) 149 (81.4) (22.5; 32.2) (75.2; 86.4)
Girls Diet quality self-perception
Good 94 (29.2) 228 (70.8) 29.2 77.9
Bad 70 (22.2) 246 (77.8) (24.5; 34.4) (73.0; 82.1)
* BHEI-R = Brazilian Healthy Eating Index – Revised. P75 = 75th percentile. 95%CI = Confidence Intervals of 95%.
Characteristics Crude Adjusted
a
Odds Ratio (Confidence Interval of 95%)
Milk and dairy products
Below P75 1.0 1.0
Above P75 1.89 (1.30; 2.75)** 1.80 (1.23; 2.63)**
Oils, oilseeds and fish fat
Below P75 1.0 1.0
Above P75 1.61 (1.08; 2.39)* 1.55 (1.04; 2.33)*
Saturated fat
Below P75 1.0 1.0
Above P75 1.45 (1.00; 2.09) 1.37 (0.94; 1.99)
Sodium
Below P75 1.0 1.0
Above P75 1.56 (1.04; 2.33) 1.48 (0.98; 2.22)
* P-value < 0.05; **P-value ≤ 0.01. P75 = 75th percentile. a Adjusted for age, physical activity level and type of school. b DGVL = Dark green and orange vegetables & legumes.
Table 5. continuation
Conclusion
In this study, diet quality self-perception as “good” was associated with satisfactory eating habits, high BHEI-R score, and regular con-sumption of fruits and vegetables in adolescents. However, the consumption of components con-sidered deleterious to health, such as saturated fat intake, adherence to the “Western” pattern and the intake of solid fat-derived calories, alcohol
and added sugar were not perceived by adoles-cents as habits that characterize poor quality diet. Thus, most adolescents combine healthy foods and those less recommended in their diet, and there seems to be no complete understanding of the deleterious effects of excessive intake of com-ponents such as fats, sugar and sodium.
aúd
e C
ole
tiv
a,
22(5):1565-1578,
2017
with good quality diet. On the other hand, this question was able to diagnose low quality diets. The implementation of this question in dietary surveys with adolescents is limited and should be used with caution since it provides only a partial evaluation of the quality of the diet of this group.
Collaborations
PRM Rodrigues contributed to the design of the study, data collection, statistical analysis and interpretation of the results, conception, writ-ing and final revision of the manuscript. RMV Gonçalves-Silva collaborated in the concep-tion of the study, analysis and interpretaconcep-tion of the results, conception and final revision of the manuscript. MG Ferreira collaborated in the ac-quisition and statistical analysis of data, writing and critical review of the manuscript. RA Pereira contributed to the design of the study, statistical analysis and interpretation of the results, con-ception, writing and final revision of the man-uscript. All authors read and approved the final version of the manuscript.
Acknowledgments
To the Fundação de Amparo à Pesquisa do Esta-do Esta-do Mato Grosso for the Esta-doctoral scholarship of PRM Rodrigues.
R
o
dr
igues PRM Referências
1. Toral N, Conti MA, Slater B. A alimentação saudável na ótica dos adolescentes: percepções e barreiras à sua im-plementação e características esperadas em materiais educativos. Cad Saude Publica 2009; 25(11):2386-2394. 2. Popkin BM. Contemporary nutritional transition: de-terminants of diet and its impact on body composition. Proc Nutr Soc 2011; 70(1):82-91.
3. Popkin BM. Sugary beverages represent a threat to global health. Trends Endocrinol Metab 2012; 23(12):591-593.
4. Malik VS, Willett WC, Hu FB. Global obesity: trends, risk factors and policy implications. Nat Rev Endocrinol 2013; 9(1):13-27.
5. World Health Organization (WHO). Noncommunica-ble Diseases Country Profile 2011. Geneva: WHO; 2011. 6. Velazquez CE, Pasch KE, Ranjit N, Mirchandani G,
Hoelscher DM. Are adolescents’ perceptions of dietary practices associated with their dietary behaviors? J Am Diet Assoc 2011; 111(11):1735-1740.
7. Tremblay S, Dahinten S, Kohen D. Factors related to adolescents’ self-perceived health. Health Rep 2003; 14(Supl.):7-16.
8. Piko BF. Self-perceived health among adolescents: the role of gender and psychosocial factors. Eur J Pediatr 2007; 166(7):701-708.
9. Furst T, Connors M, Bisogni CA, Sobal J, Falk LW. Food choice: A conceptual model of the process. Appetite 1996; 26(3):247-65.
10. Rafferty AP, Anderson JV, McGee HB, Miller CE. A healthy diet indicator: quantifying compliance with the dietary guidelines using the BRFSS. Prev Med 2002; 35(1):9-15.
11. Strachan SM, Brawley LR. Healthy-eater identity and self-efficacy predict healthy eating behavior: a prospec-tive view. J Health Psychol 2009; 14(5):684-695. 12. Fitzgerald A, Heary C, Nixon E, Kelly C. Factors
in-fluencing the food choices of Irish children and ado-lescents: a qualitative investigation. Health Promot Int 2010; 25(3):289-298.
13. Rodrigues PRM, Pereira RA, Cunha DB, Sichieri R, Ferreira MG, Vilela AA, Gonçalves-Silva RMV. Fac-tors associated with dietary patterns in adolescents: a school-based study in Cuiabá, Mato Grosso. Rev Bras Epidemiol 2012; 15(3):662-674.
14. Anção MS, Cuppari L, Tudisco ES, Draibe SA, Sigulem DM. Sistema de Apoio à Nutrição. NutWin [software] versão 2.5. São Paulo: Universidade Federal de São Pau-lo; 2002.
15. Brasil. Ministério da Saúde (MS). Secretaria de Atenção à Saúde. Coordenação-Geral da Política de Alimenta-ção e NutriAlimenta-ção. Guia alimentar para a populaAlimenta-ção brasi-leira: promovendo a alimentação saudável. Brasília: MS; 2006. (Série A. Normas e Manuais Técnicos). 16. Nutrition Coordinating Center. Nutrition Data System
for Research (NDS-R). Minnesota: University of Min-nesota; 2008.
17. Núcleo de Estudos e Pesquisas em Alimentação (NEPA/UNICAMP). Tabela de Composição de Alimen-tos - TACO. 4ª ed. Campinas: NEPA/UNICAMP; 2011. 18. Previdelli AN, Andrade SC, Pires MM, Ferreira SRG,
Fisberg RM, Marchioni DM. A revised version of the Healthy Eating Index for the Brazilian population. Rev Saude Publica 2011; 45(4):794-798.
19. Associação Brasileira de Empresas de Pesquisa (ABEP). Critério de Classificação Econômica Brasil. São Paulo: ABEP; 2008.
20. Currie C, Roberts C, Morgan A, Smith R, Settertobulte W, Samdal O, Rasmussen VB. Young people’s health in context. Health Behaviour in Schoolaged Children (HBSC) study: international report from the 2001/2002 survey. Copenhagen: WHO; 2004. (Health Policy Se-ries: Health Policy for Children and Adolescents). 21. World Health Organization (WHO). Guidelines for
controlling and monitoring the tobacco epidemic. Gene-va: WHO; 1998.
22. Onis M, Onyango AW, Borghi E, Siyam A, Nishida C, Siekmann J. Development of a WHO growth reference for school-aged children and adolescents. Bull World Health Organ 2007; 85(9):660-667.
23. Rodrigues PRM, Gonçalves-Silva RMV, Pereira RA. Va-lidity of self-reported weight and stature in adolescents from Cuiabá, Central-Western Brazil. Rev Nutr 2013; 26(3):283-290.
24. Croll JK, Neumark-Sztainer D, Story M. Healthy Eat-ing: What Does It Mean to Adolescents? J Nutr Educ 2001; 33(4):193-198.
25. Stevenson C, Doherty G, Barnett J, Muldoon OT, Trew K. Adolescents’ views of food and eating: Identifying barriers to healthy eating. J Adolesc 2007; 30(3):417-434.
26. Sichieri R. Dietary patterns and their associations with obesity in the Brazilian city of Rio de Janeiro. Obes Res 2002; 10(1):42-48.
27. Cunha DB, Almeida RMVR, Sichieri R, Pereira RA. As-sociation of dietary patterns with BMI and waist cir-cumference in a low-income neighbourhood in Brazil. Br J Nutr 2010; 104(6):908-913.
28. Pontes TE, Costa TF, Marum ABRF, Brasil ALD, Taddei JAAC. Orientação nutricional de crianças e adolescen-tes e os novos padrões de consumo: propagandas, em-balagens e rótulos. Rev Paul Pediatr 2009; 27(1):99-105. 29. Paquette MC. Perceptions of healthy eating: state of
knowledge and research gaps. Can J Public Health 2005; 96(Supl. 3):S16-21.
30. Cunha DB, Souza BS, Pereira RA, Sichieri R. Effec-tiveness of a randomized school-based intervention involving families and teachers to prevent excessive weight gain among adolescents in Brazil. PLoS One 2013; 8:e57498.
31. Drewnovski A. Diet image: a new perspective on the food-frequency questionnaire. Nutr Rev 2001; 59(11):370-372.
32. Andrade SC, Previdelli AN, Marchioni DML, Fisberg RM. Evaluation of the reliability and validity of the Brazilian Healthy Eating Index Revised. Rev Saude Pu-blica 2013; 47(4):675-683.
Article submitted 20/03/2015 Approved 23/10/2015

![Table 4. Odds Ratio (OR) and Confidence Interval of 95% [95% CI] between characteristics of adolescents with indicators of diet quality and diet quality self-perception in male adolescents (n = 501)](https://thumb-eu.123doks.com/thumbv2/123dok_br/15215286.532297/9.931.150.728.195.1059/confidence-interval-characteristics-adolescents-indicators-quality-perception-adolescents.webp)
![Table 5. Odds Ratio (OR) and Confidence Interval of 95% [95% CI] between characteristics of adolescents with indicators of diet quality and diet quality self-perception in female adolescents (n = 638)](https://thumb-eu.123doks.com/thumbv2/123dok_br/15215286.532297/11.931.150.733.192.1059/confidence-interval-characteristics-adolescents-indicators-quality-perception-adolescents.webp)