AR
TICLE
1 Centro de Estudos em Alimentação e Nutrição, Hospital de Clínicas de Porto Alegre, Universidade Federal do Rio Grande do Sul (UFRGS). Porto Alegre Brasil.
[email protected] 2 Faculdade de Medicina, UFRGS. Porto Alegre RS Brasil.
Dietary patterns:
are there differences between children and adolescents?
Abstract Objective: To identify dietary pat-terns of children and adolescents from public schools and their relationship with age, gender, city of residence and socioeconomic class. Meth-ods: Cross-sectional study with children and ad-olescents (aged five to 19 years) from 10 public schools. The Food Consumption Markers Form, recommended by the Brazilian Food and Nu-trition Monitoring System, was used to identify dietary patterns through cluster analysis. The Pearson’s chi-square test, considering significance at p ≤ 0.05, was used to evaluate the relationship between dietary patterns and age group, gender, socioeconomic class and city of residence. Results: The final sample included 631 students. Five di-etary patterns were identified: “bean/milk/yo-gurt” (23.3%; n = 147), “restricted” (22.7%; n = 143), “healthy” (22.0%; n = 139), “Brazilian pro-cessed” (17.4%; n = 110) and “mixed” (14.5%; n = 92). The healthy pattern was positively associ-ated to lower age (< 10 years, children) and the restricted pattern to adolescence, with p<0.001. Dietary patterns were not associated with the oth-er variables. Conclusions: Five dietary pattoth-erns were identified. The healthy pattern was positively associated to lower age and the restricted pattern to adolescence.
Key words Dietary pattern, Child, Adolescent Rafaela da Silveira Corrêa 1
Patrícia Heuser Vencato 2
Fernanda Camboim Rockett 1
C
o
rrêa RS
Introduction
A global food and nutrition transition, charac-terized by important modifications in dietary patterns and practice of physical activity, is
un-derway1. These changes involve a reduction of
physical activity and significant increase in con-sumption of processed foods, in addition to a de-creased consumption of fruits and vegetables1,2. The concept of a food and nutrition transition has been used to explain the increase in the prev-alence of overweight and chronic
non-commu-nicable diseases (NCD)3. Recent studies have
shown a rapid increase of this transition in de-veloping countries undergoing social, economic and technological changes, which result in high-er acquisitive powhigh-er and access to industrialized products of low nutritional value2,4.
Inadequate nutrition is one of the major be-havioral risk factors related to the current epi-demic of NCD3,4, which are the leading cause of death in Brazil and the world5. Inappropriate eat-ing habits are characterized by high consumption of foods high in energy and sodium content, sat-urated fats, trans fats and refined carbohydrates, and by the increased consumption of processed and ultra-processed foods and beverages3-5.
Childhood and adolescence are life stages es-sential for learning and establishing healthy eat-ing habits, which tend to be maintained in adult life6. Besides providing food, parents also mold children’s behaviors and represent role models, especially for younger children7,8. Dietary habits of school-age children are also influenced by oth-er adults, and thus schools play a prominent role in the formation of new habits and in maintain-ing the health of children9. Adolescence brings changes in feeding behavior, mainly due to physi-ological changes and the importance of the social environment for the teenagers6. Psychological, socioeconomic and cultural factors are potential determinants of food choices during this period, having a direct effect in the establishment of di-etary habits10. Thus, feeding patterns reflect indi-vidual preferences that are influenced by genetic, cultural, social, environmental, economic and health determinants11.
In nutritional epidemiology, conventional analyses focus on the study of feeding patterns based on isolated nutrients or food constituents. This type of analysis is limited, since individuals consume a variety of foods, which in turn have a complex and interactive combination of nu-trients. In this context, the identification of food patterns provides a real representation of dietary
habits. Food patterns are defined as the set or group of foods consumed by a given population, obtained from statistical aggregation or compo-nent reduction12.
The Brazilian Ministry of Health13
recom-mends the use of the “Food Consumption Mark-ers Form” for a general evaluation of eating patterns14. This information is not intended to quantify ingested calories or macro and micro-nutrients, but to identify the consumption of the so-called “food consumption markers”, which are indicative of healthy or unhealthy eating habits15. This form is one of the instruments of the Food and Nutritional Surveillance service, which pro-vides a continuous description of food and nutri-tion condinutri-tions of the populanutri-tion, their determi-nants and prediction of trends13.
The complexity of factors related to eating habits in childhood and adolescence and their impact on health, combined to the small number of studies on Brazilian children and teenagers, stresses the importance of analyzing the dietary patterns of these populations. The present study aimed to identify dietary patterns of school-chil-dren of two municipalities in the State of Rio Grande do Sul, using data from the Food Con-sumption Markers Form of the Food and Nutri-tion Surveillance System (SISVAN), and to inves-tigate their relationship with sex, municipality of residence, age and socioeconomic status.
Methods
aúd
e C
ole
tiv
a,
22(2):553-562,
2017
For students under 10 years of age (children), parents/guardians were sent a self-explanatory questionnaire, which contained the Brazil Eco-nomic Classification Criterion of the Brazilian
Association of Research Companies (ABEP)16,
the SISVAN´s Food Consumption Markers
Form15, and questions on the gender and place
of residence of the child. Teachers were also in-structed on the questionnaire, and were available for helping parents/guardians.
For students with 10 years or more (teenag-ers), data collection occurred in schools. Trained professionals presented the self-assessment ques-tionnaire to the students and remained present while they were answered. The questionnaire included identification of gender, place of resi-dence the SISVAN´s Food Consumption Markers Form15 and the ABEP questionnaire16.
Age was determined from date of birth, ob-tained from the students´ registration forms. So-cioeconomic status was determined according to the ABEP score system16, which defines economic classes as A1, A2, B1, B2, C1, C2, D and E, accord-ing to the monthly family income. For data anal-ysis, classes were grouped as A (A1, A2), B (B1, B2), and C (C1, C2). Classes D and E remained separated.
To Food Consumption Markers Form, rec-ommended by the Brazilian Ministry of Health
and adopted by SISVAN15, was used to evaluate
food consumption. This tool determines the frequency of consumption, in the seven days preceding the survey, of ten food groups, prepa-rations and foods which are considered food consumption markers: raw salads; vegetables and cooked vegetables (except potatoes and cassava); fruits; beans; milk or yogurt; crisp or fried foods; burgers and processed meats; crackers or pack-aged snacks; cookies, sweets and chocolates and soft drinks. This questionnaire contains eight growing scores for assessment of frequency of use, ranging from “I didn’t eat for the last seven days” to “I ate during the last seven days”.
The questionnaires were reviewed and data were entered in duplicate into the Excel® software, to ascertain data consistency. Food patterns were identified by cluster analysis, using the k-means method of the software Statistical Package for the Social Sciences (SPSS) version 18.0. The k-means algorithm is a method of non-hierarchical clus-tering in which the homogeneity of the groups is measured through the Euclidean distance17. Each sample element is grouped in the center of greater similarity. The number of groups is spec-ified a priori. Studies on analysis of food patterns
suggest that when the k-means algorithm of the SPSS software is used for data analysis, as in the present study, the sample size must be greater than 500 individuals18.
The general characteristics of the sample, as well as the proportion of students classified in each pattern, are described in percentage and ab-solute number. The normality of variables was tested, and asymmetric variables are presented as medians and interquartile intervals. The frequen-cy of weekly consumption of foods/food groups is also presented as medians and interquartile in-tervals. A median greater than or equal to the 75th percentile of intake of each food/food group was defined as a cut-off for frequent consumption.
The food patterns observed in the present study were named according to the characteris-tics of food consumption within each group, con-sidering the prevalent characteristics of foods/ food groups consumption patterns as shown by the median frequency of each of the items of the questionnaire as compared with the total sam-ple. Considering that the patterns are obtained after the analysis, the nomenclature is presented in the Results section. The Kruskal-Wallis test was used to compare the weekly frequency of consumption of each food according with the dietary habit. The relationship of food patterns with sociodemographic indicators was analyzed by the Pearson’s Chi-square test. The data were considered significant when p ≤ 0.05.
The study followed the Guidelines and Reg-ulatory Norms for Research Involving Human Beings from Resolution 466/2012, which in turn revoked the 196/CNS/MS, in force at the begin-ning of the study, and was approved by the Re-search Ethics Committee of Hospital de Clínicas de Porto Alegre. All participants received the re-sults of their assessments and the school received the general results of the screening performed with students.
Results
C
o
rrêa RS
Five dietary patterns were identified from the cluster analysis (Table 1). Analyses were con-ducted with two to six groups, and the results ob-tained with five groups were the best to explain the consumption pattern of this sample. Figure 1 shows the median weekly frequency of consump-tion of foods according to the dietary pattern. A significant difference was observed for all foods evaluated among the five identified patterns (p < 0.001).
Table 2 presents the distribution of the food patterns and the median frequency of weekly consumption of foods/food groups for each pat-tern identified. The “bean/milk/yogurt” patpat-tern represented the consumption of 23.3% (n = 147) of the students, and was characterized by high consumption of milk/yogurt and beans and low consumption of salads, vegetables and cooked vegetables; fruits; fried foods; cookies, biscuits, sweets; and soft drinks. The “restricted” pattern was the second most prevalent, representing 22.6% (n = 143) of the sample, and is character-ized by low consumption of all food groups, with higher consumption of beans and soft drinks. This pattern included the smaller variety of food items. The “healthy” pattern represented 22.0% (n = 139) of the students, and was characterized by high consumption of healthy food markers (salads, vegetables and cooked vegetables; fruits; beans; milk/yogurt) and low consumption of unhealthy markers (fried foods; burger and processed meats; crackers or packaged snacks; cookies, sweets, candies and chocolates; and soft drinks). The “Brazilian industrialized” pattern was characterized by low consumption of sal-ads, vegetables and cooked vegetables; burgers and processed meats; and high consumption of beans; milk/yogurt; fried foods; cookies, sweets, candies and chocolates; and soft drinks, and rep-resented the consumption of 17.4% (n = 110) of the sample. The “mixed” pattern was the least prevalent, representing 14.5% (n = 92) of the students and is characterized by frequent con-sumption of all food groups.
Table 3 presents the relationship between food patterns and sociodemographic characteris-tics such as gender, age, economic class and place of residence. It is noteworthy that the healthy eat-ing pattern showed association with children (p < 0.001), so that 29.1% of the children presented this pattern x 18.2% teenagers. Furthermore, the restricted pattern was positively associated with teenagers (p < 0.001): 30.4% teenagers presented this pattern x 8.2% children. The other variables did not present significant associations (p > 0.05).
Discussion
The present study aimed to identify food con-sumption patterns among schoolchildren of two municipalities of Rio Grande do Sul and investigate the association of these patterns with age, gender, city of residence and socioeconom-ic level. Five food consumption patterns were identified: beans/milk/yogurt, restricted, healthy, Brazilian industrialized and mixed. The healthy and restricted patterns showed positive associa-tion with children and teenagers respectively. The other variables (gender, economic class and place of residence) showed no association with dietary patterns.
It is important to stress that this is the first study to investigate food patterns using the SIS-VAN Food Consumption Markers Form. Previ-ous studies that used this same instrument ana-lyzed the data in terms of food consumption19-21, and not food patterns. Food consumption anal-ysis considers specific nutrients or foods, while food patterns assess the overall dietary pattern. This analysis is therefore closer to reality, since foods and nutrients are not consumed alone and
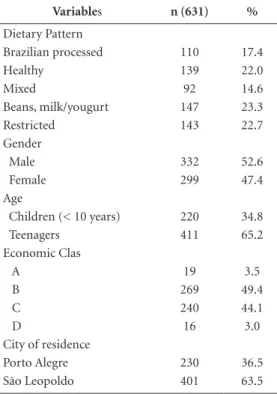
Table 1. Characterization of the sample of children
and adolescents in public schools, RS/Brazil.
Variables n (631) %
Dietary Pattern
Brazilian processed 110 17.4
Healthy 139 22.0
Mixed 92 14.6
Beans, milk/yougurt 147 23.3
Restricted 143 22.7
Gender
Male 332 52.6
Female 299 47.4
Age
Children (< 10 years) 220 34.8
Teenagers 411 65.2
Economic Clas
A 19 3.5
B 269 49.4
C 240 44.1
D 16 3.0
City of residence
Porto Alegre 230 36.5
São Leopoldo 401 63.5
aúd
e C
ole
tiv
a,
22(2):553-562,
2017
may be combined in many complex and interac-tive ways12,22.
Although dietary patterns observed in the present investigation show some similarities with results described in other studies, the compari-son should be cautious, due to the differences in the characteristics of the study population and the instruments used to assess food consump-tion. Tavares et al.23 have recently identified food patterns of teenagers through surveys using sur-veillance systems and stressed the fact that cluster analysis is suitable for evaluation of food con-sumption.
The bean/milk/yogurt pattern was charac-terized by high consumption of milk and yogurt and intermediate consumption of beans, which represent healthy aspects of the traditional Bra-zilian dietary pattern24. Rodrigues et al.24 identi-fied a similar eating pattern, also composed pre-dominantly by beans and milk, in teenagers of Mato Grosso, but they named it as “traditional” pattern. The pattern showed association with
ad-olescents with no excess weight, which can indi-cate its nutritional appropriateness. This pattern is also in accordance with the so-called “ovo-lac-to” pattern by Villa et al.8 in children, that was characterized by the consumption of eggs, cheese and sweetened dairy drinks.
The restricted pattern was characterized by low consumption of all foods/food groups, with higher/consumption of beans and soda. This pat-tern included the smaller variety of food items. Hoffmann et al.17 have also identified a “restrict-ed” pattern among pregnant women in Porto Alegre, with a large proportion (42%) of foods from the Food Frequency Questionnaires (FFQs) not being consumed by at least half the women. This pattern was also characterized by higher consumption of soft drinks in both studies.
As its name suggests, the healthy pattern was characterized by high consumption of healthy food markers (salads, vegetables, fruits, beans and milk) and low consumption of items that characterize an unhealthy dietary pattern
(pro-Figure 1.Median weekly frequency of consumption of foods according to the eating pattern of children and
teenagers from public schools in two municipalities of RS/Brazil.
* Statistically significant difference (p < 0.001) among the five dietary patterns identified, Kruskal-Wallis test.
Brazilian processed Healthy
Mixed
Bean/milk/yogurt
Restricted Soft drinks
Raw salads
Vegetables and boiled greens
Beans
Fresh fruit
Milk or yogurt Crisp or fried foods
Burgers and processed meats Crackers or packaged snacks
C
o
rrêa RS
cessed meats, chips, cookies, candy and sodas). A study with children from Salvador/BA iden-tified a similar dietary pattern, with a predom-inance of fruits, vegetables and grain legumes25. This pattern was also identified in students in other countries such as Scotland26 and England27, where it was also called “healthy”.
The Brazilian processed pattern was charac-terized by high consumption of processed foods such as snacks, cookies, candy and sodas, as well as fried foods. This pattern of food consumption is similar to that identified in children from Sal-vador, consisting of fried foods, sweets, snacks
and soda/artificial juice25. The “Western” food pattern observed in adolescents from Mato Gros-so, also characterized by processed foods, dairy products, processed meats, sweetened drinks, fast food, fried banana and sweets24, with the excep-tion of fruits and beans, was also similar to pat-terns found in this study.
The mixed pattern was characterized by the presence of food markers of both healthy and unhealthy dietary patterns, and included the largest variety of food items. Nobre et al.28 iden-tified a very similar pattern, called “mixed diet” composed of leafy vegetables, fruits, beans, milk
Table 2. Distribution of the median frequency of weekly consumption of food groups for total sample and five
food patterns identified in children and adolescents in public schools, RS/Brazil.
Food Patterns
Foods/ food group Total
sample
Brazilian
industrialized Healthy Mixed
Beans, milk/
yogurt Restricted
n % n % n % n % n % n %
631 100 110 17.4 139 22.0 92 14.6 147 23.3 143 22.7
<--- median ( P25 - P75 ) --->
Raw salads (lettuce, tomato, carrot, cucumber, cabbage, etc)
2 (1-5) 1 (0-2) 6 (4-7) 7 (5-7) 1 (0-2) 1 (0-3)
Vegetables and cooked vegetables (kale, pumpkin, chayote, broccoli, spinach, etc) (except potatoes and cassava)
1 (0-3) 0 (0-1) 4 (2-6) 4 (2-6) 0 (0-1) 0 (0-2)
Fresh fruit or fruit salad 3 (1-6) 4 (1-6) 6 (5-7) 6 (4-7) 2 (1-3) 1(1-2) Beans 5 (3-7) 6 (3 -7) 7 (5-7) 7 (5-7) 4 (2-7) 3 (1-6) Milk or yogurt 7 (2-7) 7 (4-7) 7 (5-7) 7 (4-7) 7 (7- 7) 1 (0-2) Potato chips, packaged
potato and fried foods (chicken croquette, kebab, pastry, etc)
1 (0-3) 4 (2- 6) 1 (0-1) 3 (1-5) 1 (0- 2) 1 (0-2)
Burgers and processed meats (knackwurst, mortadella, salami, ham, sausage, etc)
2 (0-4) 3 (1- 5) 1 (0-3) 4 (2-7) 1 (1-3) 1 (0-2)
Crackers or packaged
snacks 3 (1-5) 7 (5-7) 1 (0-3) 5 (3-7) 2 (1-4) 1 (1-2) Biscuits/sweetened or
stuffed cookies, sweets, candies and chocolates (bar or bonbon)
3 (1-5) 7 (5-7) 1 (1-2) 5 (4-7) 2 (1-3) 2 (1-3)
Soft Drink (not diet or
light) 3 (2-6) 7 (4-7) 2 (1-3) 7 (4-7) 3 (2- 5) 3 (1-5)
aúd
e C
ole
tiv
a,
22(2):553-562,
2017
and dairy products, rice, roots, flour products, sweet and savoury biscuits, cakes and meats, in preschool children from Minas Gerais.
Despite evidences that traditional foods in the Brazilian diet such as beans are not as avail-able as they used to be (Family Budgets Survey29), the present results show frequent consumption of beans, with median consumption greater than or equal to the 75th percentile, in all food pat-terns (77.3%), with the exception of the restrict-ed pattern. Milk and yogurt, which are markers of a healthy dietary pattern19, were also very fre-quent. This result corroborates the findings of the National Health Survey of 201330, in which the regular consumption of beans was reported by 71.9% of the adult Brazilian population.
A significant association of food patterns with age was observed in the present study. The positive association observed between the healthy pattern and age <10 years (children), as com-pared to adolescents, supports previous reports. In a representative sample in Australia, healthier feeding patterns were observed more frequently in younger children than in older children and adolescents, indicating that the quality of dietary patterns tends to decrease with age31. This
rela-tionship was also confirmed among American children and adolescents32. Northstone et al.27 in-vestigated the maintenance of dietary patterns in a longitudinal study and found that 50% of chil-dren with a healthy eating pattern at the age of seven still had that pattern at the age of 13, while 20% migrated from a healthy to an industrialized food pattern (processed foods, processed meats and sweets)27. These findings are probably relat-ed to the process of learning dietary habits, since children are very influenced by parents33 and, as they grow, they acquire greater independence and begin to decide about their food habits.
The social environment has greater impor-tance during adolescence, interfering with dietary habits that therefore tend to be modified6. A study with teenagers, using data from the National Sur-vey of School Children Health (PeNSE), identi-fied three dietary patterns: mixed, unhealthy and healthy. Higher frequencies of the healthy pattern were observed among teens of capital cities in the South, Southeast and Central-West states23.
In the present study, no relationships were observed between dietary patterns and economic class. In Brazil, this relationship is not consen-sual34. Healthy eating patterns among children
Table 3. Association of sociodemographic characteristics with the five food patterns identified in the sample of
children and adolescents in public schools, RS/Brazil.
Food Patterns
Variables Brazilian
processed Healthy Mixed
Beans, milk/
yogurt Restricted
n (%) n (%) n (%) n (%) n (%) Total (%) P*
Gender
Male 58 (17.5) 62 (18.7) 46 (13.9) 86 (25.9) 80 (24.1) 332 (100.0) 0.164*
Female 52 (17.4) 77 (25.8) 46 (15.4) 61 (20.4) 63 (21.1) 299 (100.0) Age
Children (<10 years) 40 (18.2) 64 (29.1)† 37 (16.8) 61 (27.7) 18 (8.2) 220 (100.0)
<0.001*
Adolescents (≥10 years) 70 (17.0) 75 (18.2) 55 (13.4) 86 (20.9) 125 (30.4) † 411 (100.0)
Economic Class
A 3 (15.8) 7 (36.8) 2 (10.5) 1 (5.3) 6 (31.6) 19 (100.0)
0.766*
B 41 (15.2) 61 (22.7) 37 (13.8) 60 (22.3) 70 (26.0) 269 (100.0) C 48 (20.0) 49 (20.4) 38 (15.8) 61 (25.4) 44 (18.2) 240 (100.0) D 2 (12.5) 2 (12.5) 2 (12.5) 5 (31.3) 5 (31.3) 16 (100.0) City
Porto Alegre 37 (16.1) 56 (24.3) 24 (10.4) 62 (27.0) 51 (22.2) 230 (100.0) 0.106*
São Leopoldo 73 (18.2) 83 (20.7) 68 (17.0) 85 (21.2) 92 (22.9) 401 (100.0)
C
o
rrêa RS
from Salvador were related to higher economic classes25. However, Silva et al. found an associa-tion between higher socioeconomic status and an obesogenic eating pattern (consisting of milk and dairy products, oils and fats, sweets and fried foods), while the traditional eating pattern (meats, eggs, vegetables, roots and fruits) showed no association with socioeconomic level34. Villa et al.8 observed a relationship between eating pat-terns and economic conditions of the family in children. Similar to the present study, McNaugh-ton et al.35 found no association between dietary patterns and socioeconomic indicators in ado-lescents in Australia. These results suggest that other studies are needed to clarify the interfering factors in this relationship.
The use of a methodology that assesses eating patterns using the SISVAN Food Consumption Markers Form represents a strong point of the present study. This questionnaire was chosen be-cause it is considered a practical and informative method, facilitating both data collection as anal-ysis. Another advantage of this instrument is its
small size, since the use of longer FFQs with ques-tions about food porques-tions can overtax the respon-dent and result in omission of information36. This study has as limitation the fact that the results are restricted to the population under study, due to the type of sample selection (non probabilistic) and its delineation (cross-sectional).
Conclusion
aúd
e C
ole
tiv
a,
22(2):553-562,
2017
Referências
1. Popkin BM, Adair LS, Ng SW. Global nutrition transi-tion and the pandemic of obesity in developing coun-tries. Nut Rev 2012; 70(1):3-21.
2. Gill M, Feliciano D, Macdiarmid J, Smith P. The envi-ronmental impact of nutrition transition in three case study countries. Food Secur 2015; 7(3):493-504. 3. Astrup A, Dyerberg J, Selleck M, Stender S. Nutrition
transition and its relationship to the development of obesity and related chronic diseases. Obes Rev 2008; 9(Supl. 1):48-52.
4. Bielemann RM, Motta JVS, Minten GC, Horta BL, Gi-gante DP. Consumption of ultra-processed foods and their impact on the diet of young adults. RevSaude Pu-blica 2015; 49(28):1-10.
5. World Health Organization (WHO). Global status report on noncommunicable diseases. Geneva: WHO; 2010.
6. Mikkilä V, Räsänen L, Raitakari OT, Pietinen P, Viikari J. Consistent dietary patterns identified from child-hood to adultchild-hood: The Cardiovascular Risk in Young Finns Study. Br J Nutr 2007; 93(6):923-931.
7. Rossi A, Moreira EAM, Rauen MS. Determinantes do comportamento alimentar: uma revisão com enfoque na família. Rev Nut 2008; 21(6):739-748.
8. Villa JKD, Silva ARE, Santos TSS, Ribeiro AQ, Pessoa MC, Sant’Ana LFDR. Padrões alimentares de crianças e determinantes socioeconômicos, comportamentais e maternos. Rev Paul Pediatr 2015; 33(3):302-309. 9. Costa EQ, Ribeiro VMB, Ribeiro ECO. Programa de
al-imentação escolar: espaço de aprendizagem e produção de conhecimento. Rev Nut 2001; 14(3):225-229. 10. Wang Y, Bentley ME, Zhai F, Popkin BM. Tracking of
dietary intake patterns of Chinese from childhood to adolescence over a six-year follow-up period. J Nutr 2002; 132(3):430-438.
11. Kant AK. Dietary patterns and health outcomes. J Am Diet Assoc 2004; 104(4):615-635.
12. Hu FB. Dietary pattern analysis: a new direction in nutritional epidemiology. Curr Opin Lipidol 2002; 13(1):3-9.
13. Brasil. Ministério da Saúde (MS). Secretaria de à Atenção Saúde. Departamento de Atenção Básica. Política Nacional de Alimentação e Nutrição. Brasília: MS; 2012.
14. Brasil. Ministério da Saúde (MS). Secretaria de Atenção à Saúde. Departamento de Atenção Básica. Uso dos For-mulários e Registro das Informações no Novo Sistema Informatizado da Vigilância Alimentar e Nutricional – SISVAN WEB. Brasília: MS; 2008.
15. Brasil. Ministério da Saúde (MS). Secretaria de Atenção à Saúde. Departamento de Atenção Básica. Protocolos do Sistema de Vigilância Alimentar e Nutricional - SIS-VAN na assistência à saúde. Brasília: MS; 2008. 16. Associação Brasileira de Institutos de Pesquisa de
Mer-cado (ABEP). O Novo Critério Padrão de Classificação Econômica Brasil – Critério ABIPEME. Rio de Janeiro: ABEP; 2013.
17. Hoffmann JF, Camey S, Olinto MTA, Schmidt MI, Oz-cariz SGI, Melere C, OzOz-cariz SG, Buss C, Drhemer M, Manzolli P, Soares RM, Pinheiro AP, Camey S. Dietary patterns during pregnancy and the association with so-ciodemographic characteristics among women attend-ing general practices in southern Brazil: the ECCAGe Study. CadSaude Publica 2013; 29(5):970-980. Collaborations
C
o
rrêa RS
18. Mooi E, Sarstedt M. A Concise Guide to Market Re-search: The Process, Data, and Methods Using IBM SPSS Statistics. Media. 2011.
19. Castro IRR, Cardoso LO, Engstrom EM, Levy RB, Mon-teiro CA. Vigilância de fatores de risco para doenças não transmissíveis entre adolescentes: a experiência da cidade do Rio de Janeiro, Brasil. CadSaude Publica 2008; 24(10):2279-2288.
20. Levy RB, Castro IRR, Cardoso LO, Tavares LF, Sardinha LMV, Gomes FS, Costa AWN. Consumo e comporta-mento alimentar entre adolescentes brasileiros: Pesqui-sa Nacional de Saúde do Escolar (PeNSE), 2009. Cien Saude Colet 2010; 15(2):3085-3097.
21. Polla SF, Scherer F. Perfil alimentar e nutricional de es-colares da rede municipal de ensino de um município do interior do Rio Grande do Sul. Cad Saúde Colet 2011; 19(1):111-116.
22. Carvalho CA, Fonsêca PCA, Nobre LN, Priore SE, Franceschini SCC. Metodologias de identificação de padrões alimentares a posteriori em crianças bra-sileiras: revisão sistemática. Cien Saude Colet 2016; 21(1):143-154.
23. Tavares LF, Castro IRR, Levy RB, Cardoso LO, Claro RM. Padrões alimentares de adolescentes brasileiros: resultados da Pesquisa Nacional de Saúde do Escolar (PeNSE). CadSaude Publica 2014; 30(12):1-13. 24. Rodrigues PRM, Pereira RA, Cunha DB, Sichieri R,
Ferreira MG, Vilela AAF, Gonçalves-Silva RMV. Fatores associados a padrões alimentares em adolescentes: um estudo de base escolar em Cuiabá, Mato Grosso. Rev Bras Epidemiol 2012; 15(3):662-674.
25. D’Innocenzo S, Marchioni DML, Prado MS, Matos SMA, Pereira SRS, Barros AP, Sampaio LR, Assis AMO, Rodrigues LC, Barreto ML. Condições socioeconômi-cas e padrões alimentares de crianças de 4 a 11 anos: es-tudo SCAALA - Salvador/ Bahia. Rev Bras Saude Mater Infant 2011; 11(1):41-49.
26. Craig LCA, McNeill G, Macdiarmid JI, Masson LF, Holmes BA. Dietary patterns of school-age children in Scotland: association with socio-economic indi-cators, physical activity and obesity. Br J Nutr 2010; 103(3):319-334.
27. Northstone K, Smith ADAC, Newby PK, Emmett PM. Longitudinal comparisons of dietary patterns derived by cluster analysis in 7- to 13-year-old children. Br J Nutr 2012; 109(11):1-9.
28. Nobre LN, Lamounier JA, Franceschini SCC. Padrão alimentar de pré-escolares e fatores associados. J Ped 2012; 88(2):129-136.
29. Instituto Brasileiro de Geografia e Estatística (IBGE). Pesquisa de Orçamentos Familiares: 2008-2009. Antro-pometria e Estado Nutricional. Rio de Janeiro: IBGE; 2010.
30. Jaime PC, Stopa SR, Oliveira TP, Vieira ML, Szwarcwald CL, Malta DC. Prevalência e distribuição sociode-mográfica de marcadores de alimentação saudável, Pesquisa Nacional de Saúde, Brasil 2013. Epidemiol e Serviços Saúde 2015; 24(2):267-276.
31. Golley RK, Hendrie GA, McNaughton S A. Scores on the Dietary Guideline Index for Children and Ado-lescents Are Associated with Nutrient Intake and So-cio-Economic Position but Not Adiposity. J Nut 2011; 141(7):1340-1347.
32. Fungwe T, Guenther P, Juan W, Hiza H, Lino M. The Quality of Childre’s Diets in 2003-04 as Measured by the Healthy Eating Index-2005. Nutr Metab Insights 2009; April:1-2.
33. Kral TVE, Rauh EM. Eating behaviors of children in the context of their family environment. Physiol Behav 2010; 100(5):567-573.
34. Silva RCR, Assis AMO, Szarfarc SC, Pinto EJ, Costa LCC, Rodrigues LC. Iniquidades socioeconômicas na conformação dos padrões alimentares de crianças e ad-olescentes. Rev Nut 2012; 25(4):451-461.
35. McNaughton SA, Ball K, Mishra GD, Crawford DA. Dietary patterns of adolescents and risk of obesity and hypertension. J Nutr 2008; 138(2):364-370.
36. Wong JE, Parnell W, Black KE, Skidmore PM. Reli-ability and relative validity of a food frequency ques-tionnaire to assess food group intakes in New Zealand adolescents. Nutr J 2012; 11:65.
Article submitted 20/11/2015 Approved 22/06/2016