DOI: http://dx.doi.org/10.5007/1980-0037.2014v16s1p36
original article
Licence Creative Commom CCRBCDH
1 Federal University of Santa Catarina. Postgraduate Physical Education Program, Florianopolis, Brazil.
2 Federal University of Santa Catarina. Postgraduate Nutrition Program, Florianopolis, Brazil.
3 Federal University of Santa Catarina. Postgraduate Collective health Program, Florianopolis, Brazil.
4Pernambuco University. Federal University of Paraíba. Associate Postgraduate Physical Education Program, Brazil.
Received: 08 February 2014 Accepted: 23 March 2014
Efect of school-based intervention on diet
in high school students
Efetividade de uma intervenção de base escolar sobre as
práticas alimentares em estudantes do ensino médio
Filipe Ferreira da Costa1
Maria Alice Altenburg de Assis1,2
David González-Chica2,3
Carla Bernardo3
Mauro Virgilio Gomes de Barros4
Markus Vinicius Nahas1
Abstract – Interventions during adolescence are important for modifying risk eating behavior that contribute to the early development of obesity and other non-transmissible chronic diseases, such as the consumption of high energy-dense and low nutrient-dense foods. he aim of this study was to assess the efect of a school-based intervention on the diet of high school students who study at night. Randomized controlled study con-ducted in 2006 in two Brazilian state capitals (Florianopolis and Recife). he intervention included multiple strategies for improving healthy eating and physical activity. Weekly frequency consumption of fruits, vegetables, dairy products, salty snacks, sweets and sot drinks, daily frequency consumption of fruits and vegetables and stages of change in fruit and vegetable consumption behavior were investigated using questionnaires. A total of 2155 students were included (mean age ± SD = 18.4 years ± 2.4) at baseline, 989 of whom remained in post-intervention. Bivariate analyses indicated greater frequency of vegetable consumption (p=0.008) and lower frequency of sweets (p=0.032) and sot drinks (p=0.003) in the intervention group compared to controls. he change in behavior was also favorable for the intervention group (p=0.016). Analysis regression showed positive efects of complying with vegetable intake recommendations (OR = 1.54 CI95% 1.19-1.97) and favorable changes in lower sweet consumption (OR = 1.21 CI95% 1.02-1.43) in the intervention group, compared to controls. We found positive efects on the eating habits of the students as a result of he Saude na Boa Project.
Key words: Eating Behavior; Adolescents; Intervention Studies; School Health.
Data from the 2009 National Student Health Survey showed that only 31% of Brazilian adolescents regularly consumed fresh fruits and vegetables (ive or six times a week). However, regular consumption of high energy-dense and low nutrient-dense foods (sweets, salty cookies and sot drinks) was
reported by more than 50% of participants1. Inadequate food consumption
behavior and low physical activity levels are associated with the increase in non-transmissible chronic diseases2.
Intervention programs aimed at promoting fruit and vegetable con-sumption, reducing salt, sugar and fat intake and encouraging participa-tion in physical activity have become Brazilian public policies3. To reach the adolescence, schools are a favorable context for interventions aimed at promoting healthy lifestyles, since they facilitate joint actions in physical, social and educational settings. A few school-based intervention studies have investigated Brazilian adolescents in the morning and aternoon shits, focusing on educational programs to reduce sweet beverage consumption4 or encourage healthy eating and physical activity5. Brazilian scientiic journals contain no speciic interventions with nighttime students at high school level. he Saude na Boa Project6 was the irst Brazilian study conducted to promote changes in the health behavior (physical activity and diet) of high school students who study at night. he aim of this article is to describe the efects of the Saude na Boa Project on the eating habits of nighttime public high school students in two Brazilian state capitals: Florianopolis and Recife (South and Northeast of Brazil, respectively).
METHODOLOGICAL PROCEDURES
he Saude na Boa Project was a randomized controlled intervention, car-ried out during the 2006 school year (March to December). he population consisted of nighttime public high school students, aged between 15 and 24 years, in Florianopolis and Recife, selected due to environmental and sociocultural contrasts at the time of the study. Earlier publications reported on the methods of the project, sampling6 and implementation process7, as well as reproducibility studies and questionnaire validity7.
he following components made up the intervention6 and measures
to promote healthy eating habits with an emphasis on increased fruit and vegetable consumption: a) he food education and physical education com-ponent: food and vegetable posters, four newsletters for the entire school community and the project website; b) Environmental and organizational change component: weekly distribution of three types of seasonal fruit during school lunch; c) Personnel engagement and training: with school employees, emphasizing the choice of healthy foods, in addition to the purchase, cleaning and provision fruits during class breaks.
Intervention in student diet Costa et al.
preventive behaviors6. he instrument was administered in a classroom by
a trained team of undergraduate and graduate Physical Education students. he present study used questions regarding the consumption of fruits, vegetables, beans, dairy products (markers of healthy eating habits), salty snacks, sweets and sot drinks (markers of unhealthy eating habits), and stages of behavior changes in the daily intake of fruits and vegetables. he weekly consumption of healthy and unhealthy foods was assessed with the following questions: “In a normal week how many days do you eat/drink “name of the food item?”, with eight response options (zero to seven days a week). To evaluate daily fruit and vegetable intake the following questions were used: “In the last 30 days, how many times a day do you usually eat fruits, such as bananas, oranges, apples, pineapple, watermelon, strawber-ries, etc.?”; “In the last 30 days, how many times a day do you usually eat vegetables (green salads, tomatoes, carrots, chayote, pumpkin, caulilower, etc)?”, with seven response options ranging from “I did not eat fruits/veg-etables in the last 30 days” to “ive or six times a day”. For these questions subjects were classiied according to compliance with the Brazilian Food Guide (GAPB) with respect to their consumption of fruit (three or more portions per day) and vegetables (two or more portions per day)8.
Stages of behavior change were assessed with the following question: “Daily intake of fruit and vegetables is considered healthy. In relation to your own eating habits, would you say that: “I have included fruits and vegetables daily in my diet for more than six months” (maintenance stage); “I have included fruits and vegetables in my diet for less than six months” (action stage); “I do not eat them at present, but I intend to include fruits and vegetables in my daily diet in the next 30 days” (preparation stage); “I do not eat them at present, but I intend to include fruits and vegetables in my daily diet in the next six months” (contemplation stage); “I do not eat them at present, and I do not intend to include fruits and vegetables in my daily diet in the next six months” (pre-contemplation stage)9.
Diferences in the frequency of food consumption, percentage compliance of GAPB recommendations and stages of behavior change between the inter-vention (IG) and control (CG) groups, in the pre- and post-interinter-vention phases were determined by the Mann-Whitney and chi squared tests. he Wilcoxon test for paired data as well as McNemar’s and Bhapkar’s tests were applied to assess intragroup changes between the pre- and post-intervention phases. In order to evaluate efectiveness of the intervention using logistic re-gression models, changes in eating habits were categorized as follows: a) for healthy foods, increasing or maintaining the frequency of consumption to ive or more days per week; b) for unhealthy foods, reducing or maintaining frequency of consumption of up to two days per week; c) for the stages of behavioral change, advancing from a lower to higher stage or maintaining action and maintenance stages.
analyses for each dependent variable, adjusted for gender, age, employment status and municipality. For variables showing intergroup diferences at baseline (Consumption of two or more portions/day of vegetables; Weekly frequency of vegetable and bean consumption), the initial condition was included to it the regression model. Analyses were conducted using the MH program10 for the Bhapkar test and Stata version 12.0 (StataCorp, Texas, USA) for the other tests. he signiicance level was set to 5%.
RESULTS
A total of 2155 adolescents took part at baseline, 45.9% (n=989) of whom remained in the second data collection. Table 1 presents the characteristics of the CG and IG at baseline by municipality. In Florianopolis, the inter-vention group had higher mean age and fewer white and single individuals than the control group. In Recife, the IG contained more girls and fewer employed individuals than the CG.
Table 1. Sample characterization at baseline, according to city.
Variables
Florianopolis (n=1.156) Recife (n=999) Control Intervention P-value* Control Intervention P-value* Sex (% girls) 55.4 60.0 0.111 50.1 56.9 0.032 Age - mean (SD) 17.2 (2.0) 18.1 (2.4) <0.001 19.0 (2.2) 18.8 (2.0) 0.080 Skin color
(% white)
61.0 52.5 0.003 27.3 24.7 0.346 Employment status
(% working)
52.3 53.1 0.797 43.8 36.2 0.015 Marital status
(% single)
90.5 86.1 0.021 86.8 86.3 0.818 Overweight (%) 16.5 18.8 0.308 26.3 31.3 0.110
*t-test (age) and chi-squared test (remaining variables).
Intervention in student diet Costa et al.
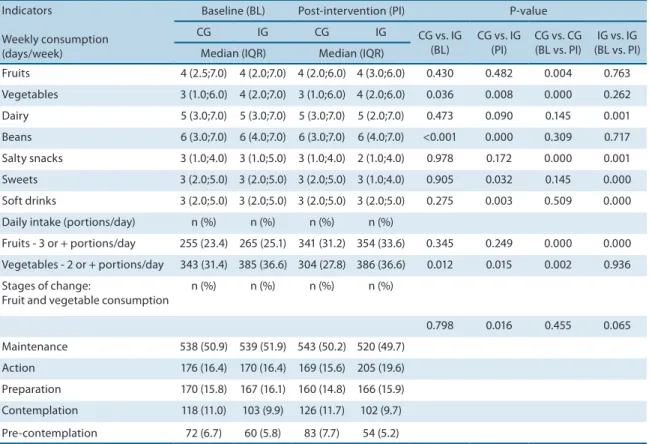
Table 2. Analysis of the efect, considering intention-to-treat of the Saude na Boa Project on food consumption indicators of public high school students of Florianopolis and Recife, 2006.
Indicators
Weekly consumption (days/week)
Baseline (BL) Post-intervention (PI) P-value CG IG CG IG CG vs. IG
(BL)
CG vs. IG (PI)
CG vs. CG (BL vs. PI)
IG vs. IG (BL vs. PI) Median (IQR) Median (IQR)
Fruits 4 (2.5;7.0) 4 (2.0;7.0) 4 (2.0;6.0) 4 (3.0;6.0) 0.430 0.482 0.004 0.763 Vegetables 3 (1.0;6.0) 4 (2.0;7.0) 3 (1.0;6.0) 4 (2.0;6.0) 0.036 0.008 0.000 0.262 Dairy 5 (3.0;7.0) 5 (3.0;7.0) 5 (3.0;7.0) 5 (2.0;7.0) 0.473 0.090 0.145 0.001 Beans 6 (3.0;7.0) 6 (4.0;7.0) 6 (3.0;7.0) 6 (4.0;7.0) <0.001 0.000 0.309 0.717 Salty snacks 3 (1.0;4.0) 3 (1.0;5.0) 3 (1.0;4.0) 2 (1.0;4.0) 0.978 0.172 0.000 0.001 Sweets 3 (2.0;5.0) 3 (2.0;5.0) 3 (2.0;5.0) 3 (1.0;4.0) 0.905 0.032 0.145 0.000 Soft drinks 3 (2.0;5.0) 3 (2.0;5.0) 3 (2.0;5.0) 3 (2.0;5.0) 0.275 0.003 0.509 0.000 Daily intake (portions/day) n (%) n (%) n (%) n (%)
Fruits - 3 or + portions/day 255 (23.4) 265 (25.1) 341 (31.2) 354 (33.6) 0.345 0.249 0.000 0.000 Vegetables - 2 or + portions/day 343 (31.4) 385 (36.6) 304 (27.8) 386 (36.6) 0.012 0.015 0.002 0.936 Stages of change:
Fruit and vegetable consumption
n (%) n (%) n (%) n (%)
0.798 0.016 0.455 0.065 Maintenance 538 (50.9) 539 (51.9) 543 (50.2) 520 (49.7)
Action 176 (16.4) 170 (16.4) 169 (15.6) 205 (19.6) Preparation 170 (15.8) 167 (16.1) 160 (14.8) 166 (15.9) Contemplation 118 (11.0) 103 (9.9) 126 (11.7) 102 (9.7) Pre-contemplation 72 (6.7) 60 (5.8) 83 (7.7) 54 (5.2)
Abbreviations: CG – Control group; IG – Intervention group; IQR – Interquartile range; BL – Baseline; PI – Post-intervention
With respect to the intragroup diference in pre- and post-intervention, the CG exhibited a reduction in weekly consumption of fruits, salty snacks and daily vegetable intake, but increased daily fruit consumption. he IG showed an decrease in weekly consumption of dairy products, salty snacks, sweets and sot drinks as well as in the number of students who consumed three or more portions of fruit per day.
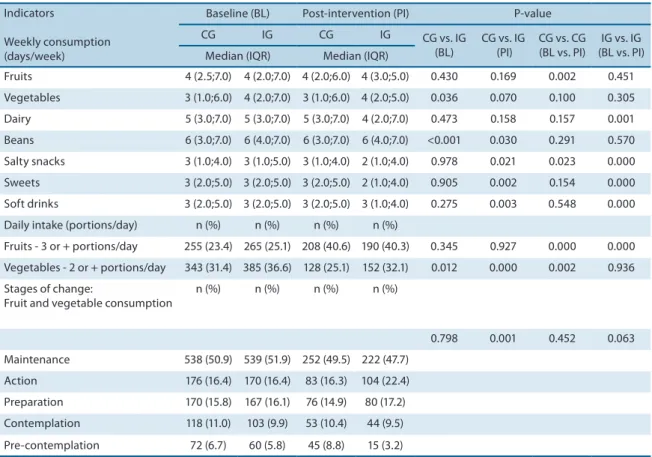
Few diferences in intervention efectiveness were observed considering only the data collected. However, these data showed that ater intervention the IG reported a lower weekly frequency of salty snack consumption compared to the CG (p = 0.021). Furthermore, the diference in weekly vegetable consumption between pre- and post-intervention in the CG was not signiicant (p = 0.100). (Table 3).
Indicators
Weekly consumption (days/week)
Baseline (BL) Post-intervention (PI) P-value CG IG CG IG CG vs. IG
(BL)
CG vs. IG (PI)
CG vs. CG (BL vs. PI)
IG vs. IG (BL vs. PI) Median (IQR) Median (IQR)
Fruits 4 (2.5;7.0) 4 (2.0;7.0) 4 (2.0;6.0) 4 (3.0;5.0) 0.430 0.169 0.002 0.451 Vegetables 3 (1.0;6.0) 4 (2.0;7.0) 3 (1.0;6.0) 4 (2.0;5.0) 0.036 0.070 0.100 0.305 Dairy 5 (3.0;7.0) 5 (3.0;7.0) 5 (3.0;7.0) 4 (2.0;7.0) 0.473 0.158 0.157 0.001 Beans 6 (3.0;7.0) 6 (4.0;7.0) 6 (3.0;7.0) 6 (4.0;7.0) <0.001 0.030 0.291 0.570 Salty snacks 3 (1.0;4.0) 3 (1.0;5.0) 3 (1.0;4.0) 2 (1.0;4.0) 0.978 0.021 0.023 0.000 Sweets 3 (2.0;5.0) 3 (2.0;5.0) 3 (2.0;5.0) 2 (1.0;4.0) 0.905 0.002 0.154 0.000 Soft drinks 3 (2.0;5.0) 3 (2.0;5.0) 3 (2.0;5.0) 3 (1.0;4.0) 0.275 0.003 0.548 0.000 Daily intake (portions/day) n (%) n (%) n (%) n (%)
Fruits - 3 or + portions/day 255 (23.4) 265 (25.1) 208 (40.6) 190 (40.3) 0.345 0.927 0.000 0.000 Vegetables - 2 or + portions/day 343 (31.4) 385 (36.6) 128 (25.1) 152 (32.1) 0.012 0.000 0.002 0.936 Stages of change:
Fruit and vegetable consumption
n (%) n (%) n (%) n (%)
0.798 0.001 0.452 0.063 Maintenance 538 (50.9) 539 (51.9) 252 (49.5) 222 (47.7)
Action 176 (16.4) 170 (16.4) 83 (16.3) 104 (22.4) Preparation 170 (15.8) 167 (16.1) 76 (14.9) 80 (17.2) Contemplation 118 (11.0) 103 (9.9) 53 (10.4) 44 (9.5) Pre-contemplation 72 (6.7) 60 (5.8) 45 (8.8) 15 (3.2)
Abbreviations: CG – Control group; IG – Intervention group; IQR – Interquartile range; BL – Baseline; PI – Post-intervention
Table 4. Efect of the Saude na Boa Project on indicators of post-intervention food consumption in public high school students in Florianopolis and Recife, 2006.
Indicators
Efectiveness (intention-to-treat) Efectiveness (data collected) Control Intervention Adjusted OR1
(95% CI)
Control Intervention Adjusted OR1
(95%CI) n (%) n (%) n (%) n (%)
Compliance with recommen-dations
Fruits: consumption of 3 or + portions/day
341 (31.2) 354 (33.6) 1.10 (0.92-1.32) 208 (40.6) 190 (40.3) 1.00 (0.77-1.29) Vegetables: consumption
of 2 or + portions/day
343 (31.4) 385 (36.6) 1.54 (1.19-1.97) 128 (25.1) 152 (32.1) 1.40 (1.04-1.88) Changes favorable to food consumption
Fruits 533 (48.8) 539 (51.1) 1.12 (0.94-1.33) 262 (51.4) 270 (57.5) 1.30 (1.00-1.67) Vegetables 260 (51.1) 259 (55.6) 1.21 (0.93-1.56) Dairy 649 (59.4) 581 (54.9) 0.79 (0.66-0.95) 316 (62.0) 276 (58.5) 0.82 (0.63-1.07) Beans 749 (69.6) 785 (75.2) 1.07 (0.84-1.37) 383 (76.3) 361 (78.5) 1.06 (0.77-1.47) Salty snacks 278 (55.4) 269 (57.2) 1.09 (0.84-1.41) Sweets 512 (47.1) 544 (51.7) 1.21 (1.02-1.43) 265 (52.3) 282 (59.9) 1.38 (1.07-1.79) Soft drinks 463 (42.4) 480 (45.5) 1.09 (0.92-1.30) 254 (50.1) 268 (57.0) 1.26 (0.98-1.63) Favorable efect on the stage of behavioral change
777 (72.4) 782 (75.3) 1.15 (0.94-1.41) 362 (72.1) 344 (75.3) 1.20 (0.89-1.60)
1Odds ratio (OR) and 95% conidence intervals (95%CI adjusted for sex, age group, employment status and city. For variables exhibiting intergroup
Intervention in student diet Costa et al.
DISCUSSION
his study presents the results of a randomized controlled school-based intervention, with a focus on the eating habits of nighttime high school students in two Brazilian state capitals with diferent socioeconomic condi-tions. he measures promoted fruit and vegetable consumption, showing the beneicial efects of these food groups and the reduced frequency of salty snack, sweets and sot drink consumption.
he results demonstrated that, compared to basal data, the interven-tion produced favorable changes in the daily and weekly frequency of fruit consumption. However, the CG also showed improvements (33% increase over basal values) in the number of students who complied with recom-mended daily fruit intake (≥ three portions per day), demonstrating a lack of association in adjusted analysis. It is unlikely that respondent bias explains the improvement observed in the CG, given that the same inding would have been expected for the other outcomes. Contamination of the CG is also highly unlikely, considering the type of intervention used, as well as the little contact expected between the groups due to the proile of the popula-tion investigated. It is also unlikely that co-intervenpopula-tions (whether local or national) explain the improvement observed, not only because of the short time period in which these changes occurred (nine months), but also because the data is not compatible with literature indings. A study conducted by the Telephone-based System for the Surveillance of Risk and Protective Factors for Chronic Diseases (VIGITEL) showed that between 2008 and 2010 the number of individuals aged 18 years or older that consumed ive or more portions of fruits and vegetables daily remained relatively stable (22-25% in Florianopolis and 17-18% in Recife)11,12. In the present study the corresponding percentage was 15% in the two cities at baseline, increasing to 23% in Florianopolis and 17% in Recife ater intervention, with no sta-tistically signiicant diference between the IG and CG (data not presented).
Evidence of improved fruit and vegetable consumption is consistent with the data reported in a systematic review showing that 83% of similar intervention studies (school-based using multiple intervention strategies) caused an increase in fruit and vegetable intake in children and adolescents,
and enhanced nutritional status13. No similar Brazilian study was found
to compare with the present investigation.
In relation to the efect on reducing the consumption of sweets, salty snacks and sot drinks, Brazilian studies have corroborated the promising indings obtained here, albeit in younger adolescents. Sichieri et al. found a reduction in sugary drinks using educational strategies that promoted
water intake in students aged nine to twelve years4. Another
interven-tion, including educational material and measures for parents, observed a reduction in sot drink and cookie consumption among adolescents with a mean age of 11 years14.
avail-children and adolescents, in addition to sex and age . On the other hand, barriers to fruit and vegetable intake in qualitative studies show a greater diversity of factors, including the sensory and physical attributes of fruits and vegetables, satiety value, knowledge, peer inluences, television and the media, price and accessibility16.
In the present study, loss to follow-upof students during the collection week was an important limitation. High school students in Brazil exhibited high dropout rates compared to their elementary counterparts. Moreover, we found a number of diferences in CG and IG characteristics at baseline, duly it to the regression models. However, losses to follow-up were similar for most variables, except sex and employment status. Intention-to-treat analyses showed similar results, suggesting that losses to follow-up did not bias the indings of the study. Another possible limitation is the use of a food frequency questionnaire to assess food intake, given that this method depends on the subjects’ memory.
With the purpose of promoting healthy foods at school, the Brazilian government included the National School Food Program in the high school curriculum, thereby ensuring a minimum frequency of three weekly por-tions of fruits and vegetables (200g/student/week)17. Similarly, the Strategic Action Plan for Combatting Chronic Non-transmissible Diseases proposes combining measures recommended by the School Health Program and the Ministry of Education and Culture in order to stimulate healthy
eat-ing and promote sports activities3. he measures employed by the present
intervention showed positive results in very diferent settings, suggesting that relatively simple actions can be efective in improving the eating habits of Brazilian adolescents.
CONCLUSIONS
he present investigation exhibited the promising results of a school-based intervention aimed at improving the food habits of nighttime high school students. he positive efect on healthy (fruits and vegetables) and unhealthy (salty snacks, sweets and sot drinks) food consumption suggests that relatively simple interventions can promote important behavioral changes. Assessment of the large-scale sustainability of these types of interventions, as well as the study of their efectiveness for longer periods may contribute to the implementation and consolidation of measures directed at promoting healthy eating habits in this population.
Acknowledgements
Intervention in student diet Costa et al.
Federal de Santa Catarina (UFSC), and Universidade de Pernambuco (UPE). he authors thank the students and teachers of the 20 schools that participated in the project and the Secretariat of Education for the states of Santa Catarina and Pernambuco.
REFERENCES
1. Instituto Brasileiro de Geograia e Estatística. Diretoria de Pesquisa, Coordenação de População e Indicadores Sociais. Pesquisa Nacional de Saúde do Escolar 2009. Rio de Janeiro: IBGE; 2009.
2. World Health Organization. Diet, Nutrition and the Prevention of Chronic Diseases. Report of a Joint WHO/Food and Agriculture Organization Expert Consultation. WHO Technical Report Series No. 916. Geneva: WHO, 2003.
3. Brasil. Plano de ações estratégicas para o enfrentamento das doenças crônicas não transmissíveis (DCNT) no Brasil 2011-2022 / Ministério da Saúde. Secretaria de Vigilância em Saúde. Departamento de Análise de Situação de Saúde. Brasília: MS, 2011.
4. Sichieri R, Paula Trotte A, de Souza RA, Veiga GV. School randomised trial on prevention of excessive weight gain by discouraging students from drinking sodas. Public Health Nutr 2009;12(2):197-202.
5. Vargas ICS, Sichieri R, Sandre-Pereira G, Veiga GV. Avaliação de programa de prevenção de obesidade em adolescentes de escolas públicas. Rev Saúde Pública 2011;45(1):59-68.
6. Nahas MV, Barros MV, de Assis MA, Hallal PC, Florindo AA, Konrad L. Methods and participant characteristics of a randomized intervention to promote physical activity and healthy eating among Brazilian high school students: the Saude na Boa project. J Phys Act Health 2009;6(2):153-62.
7. Silva KS, Barros MVG, Barbosa Filho VC, Garcia LMT, Wanderley Júnior RS, Beck CC, et al. Implementation of the “Saúde na Boa” intervention: process evaluation and characteristics of participants and dropouts. Rev Bras Cineantropom Desem-penho Hum 2014; 16(Supl.1)1-12.
8. Nahas MV, Barros MVG, Florindo AA, Farias Júnior JC, Hallal PC, Konrad L, et al. Reprodutibilidade e validade do questionário Saúde na Boa para avaliar ativi-dade física e hábitos alimentares em escolares do ensino médio. Rev Bras Ativ Fis e Saúde 2007;12(3):12-20.
9. Prochaska J, Marcus B. he transtheoretical model: applications to exercise. Cham-paign: Human Kinetics; 1994.
10. Uebersax JS. User guide for the MH program (vers. 1.2). Statistical Methods for Rater Agreement website. 2006; Available from: http://john-uebersax.com/stat/mh.htm. 11. Brasil. Ministério da Saúde. Secretaria de Vigilância em Saúde, Secretaria de Gestão
Estratégica e Participativa. Vigitel Brasil 2008: vigilância de fatores de risco e pro-teção para doenças crônicas por inquérito telefônico. Brasília: MS; 2009.
12. Brasil. Ministério da Saúde. Secretaria de Vigilância em Saúde, Secretaria de Gestão Estratégica e Participativa. Vigitel Brasil 2010: vigilância de fatores de risco e pro-teção para doenças crônicas por inquérito telefônico. Brasília: MS; 2011. 13. Silveira JA, Taddei JA, Guerra PH, Nobre MR. Efectiveness of school-based
nutri-tion educanutri-tion intervennutri-tions to prevent and reduce excessive weight gain in children and adolescents: a systematic review. J Pediatr (Rio J) 2011;87(5):382-92.
14. Cunha DB, Souza BS, Pereira RA, Sichieri R. Efectiveness of a randomized school-based intervention involving families and teachers to prevent excessive weight gain among adolescents in Brazil. PLoS One 2013;8(2):e57498.
Filipe Ferreira da Costa
Rua Aurino Vila, 464, Bloco B, Apto 102, Emaús
Parnamirim - RN, Brazil. CEP: 59148-590
E-mail: [email protected] Tel: +55 84 9174-7235
the literature. Part II: qualitative studies. Int J Behav Nutr Phys Act 2011;8(1):112. 17. Brasil. Ministério da Educação. Resolução nº 38, de 16 de julho de 2009. Dispõe