CHROMITITE PROSPECTING USING LANDSAT TM AND ASTER REMOTE
SENSING DATA
Amin Beiranvand Pour*, Mazlan Hashim, Mohsen Pournamdari Geoscience and Digital Earth Centre (Geo-DEC) Research Institute for Sustainability and Environment (RISE)
Universiti Teknologi Malaysia (UTM) 81310 UTM Skudai, Johor Bahru, Malaysia
*Corresponding author: a.beiranvand@utm.my Commission VI, WG VI/4
KEY WORDS: Landsat Thematic Mapper (TM); ASTER; Ophiolite complex; Chromite exploration
ABSTRACT:
Studying the ophiolite complexes using multispectral remote sensing satellite data are interesting because of high diversity of minerals and the source of podiform chromitites. This research developed an approach to discriminate lithological units and detecting host rock of chromitite bodies within ophiolitic complexes using the Advanced Spaceborne Thermal Emission and Reflection Radiometer (ASTER) and Landsat Thematic Mapper (TM) satellite data. Three main ophiolite complexes located in south of Iran have been selected for the study. Spectral transform techniques, including minimum noise fraction (MNF) and specialized band ratio were employed to detect different rock units and the identification of high-potential areas of chromite ore deposits within ophiolitic complexes. A specialized band ratio (4/1, 4/5, 4/7) of ASTER, MNF components and Spectral Angle Mapper (SAM) on ASTER and Landsat TM data were used to distinguish ophiolitic rock units. Results show that the specialized band ratio was able to identify different rock units and serpentinized dunite as host rock of chromitites within ophiolitic complexes, appropriately. MNF components of ASTER and Landsat TM data were suitable to distinguish ophiolitic rock complexes at a regional scale. The integration of SAM and Feature Level Fusion (FLF) used in this investigation discriminated the ophiolitic rock units and prepared detailed geological map for the study area. Accordingly, high potential areas (serpentinite dunite) were identified in the study area for chromite exploration targets.The approach used in this research offers the image processing techniques as a robust, reliable, fast and cost-effective method for detecting serpentinized dunite as host rock of chromitite bodies within vast ophiolite complexes using ASTER and Landsat TM satellite data.
1. INTRODUCTION
Recent development of multi-spectral remote sensing satellite systems, such as the Advanced Spaceborne Thermal Emission and Reflection Radiometer (ASTER) and Landsat Thematic Mapper (TM) sensors, offer geologists a potentially cost-effective alternative to expensive and time-consuming regional mineral exploration and geological mapping. Remote sensing satellite data are very useful for mapping ophiolitic rock complexes. These complexes offer high mineral diversity and are extensively scattered, they are difficult to access because of their geographic and geological positions. However, they are of significant importance for their prospective mineral resources, particularly for chromite and magnasite ore deposits (Khan and Mahmood, 2007; Pour et al., 2013; Hashim et al 2013; Pour and Hashim, 2013; Pour and Hashim, 2014, 2015).
Podiform chromitites typically occur as lenticular or pod-shaped bodies, a few meters or tens of meters in length, which are hosted in depleted peridotites of presumed mantle origin. These bodies are individually small but, where abundant they form large-scale chromitite deposits. Chromitite is closely associated with dunite in ophiolitic complex. A Chromitite body is enclosed by a dunite envelope and large chromitite bodies are exclusively found in relatively dunite-dominant comlplexes
(Arai, 1997; Arai and Yurimoto, 1994). Accordingly, the discrimination and mapping of serpentinized dunite in the ophiolitic complexes is quite interesting for chromite exploration plans.
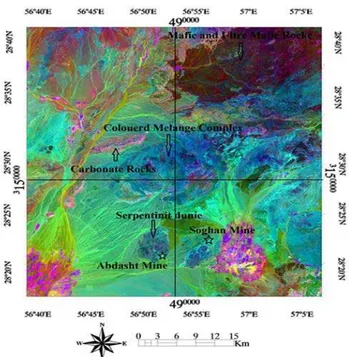
In this study, Minimum Nose Fraction (MNF), a specialized Band ratio (BR) as well as a developed method based on the integration of Spectral Angle Mapper (SAM) and Feature Level Fusion (FLF) are tested and implemented on Landsat TM and ASTER data for lithological mapping and distinguishing serpentinized dunite from surrounding rocks in Esfandagheh ophiolite complex, south Iran (Figure 1).
2. MATERIALS AND METHODS 2.1 Geology of the study area
Figure 1. Overview of ophiolite complexes (green part) in Iran, and geology map of the study area.
It is located in 56◦46′ 42″ E, 28◦ 21′ 05″ N and consist of a series of ultra-mafic rocks, which are mainly peridotites. Esfandagheh ophiolite is composed of dunite, harzburgite, verlite, serpentine, and a little lherzolite. Dunites and harzburgites are host rocks of chromite and magnesite mineraliztion (Pour and Hashim, 2011a, b).
2.1 Satellite remote sensing data
This study used the level 1B ASTER data. The image has been already pre-georeferenced to UTM zone 40 North projections with WGS-84 datum. The crosstalk correction (Iwasaki and Tonooka, 2005) was applied to ASTER data. Fast line-of-sight atmospheric analysis of spectral hypercubes (FLAASH) was used for atmospheric correction on ASTER data (Thome et al. 1998). In addition, geometric correction has been employed to the Landsat TM image using ACRES.
2.2 Image processing methods
In this study, Minimum Nose Fraction (MNF), a specialized Band ratio (BR) as well as a developed method based on the integration of Spectral Angle Mapper (SAM) and Feature Level Fusion (FLF) was applied to the datasets. Minimum noise fraction (MNF) is employed to specify the inherent dimensionality of image satellite data, separate noises in the image and decrease the computational requirements for subsequent processing (Boardman et al., 1994). Band Ratio (BR) is employed to reduce the topographic variation and the difference of brightness image associated with size variable. This method is usually applied greatly in lithological mapping and mineral exploration using remote sensing data (Ninomiya et al., 2005). Spectral Angle Mapper (SAM) is a classification technique, which is suitable for preparation lithological mapping of minerals and other rock formations with unique spectral shapes by computing similarities spectral between image spectra and reference spectra (Harsanyi et al., 1994). Due to the different characteristics of spectral features, the spectral angle mapper technique (SAM) was employed on ASTER and Landsat TM images to extract features separately. Then, the geological map based on spectral angle mapper results and feature level fusion was prepared. In the next step, a geological map was generated based on the feature level fusion technique of ASTER and Landsat TM data. To achieve this objective, we
used ENVI (4.8), ERDAS (9.2) and Arc GIS (9.3) software packages.
3. RESULTS AND DISCUSSION
MNF 1, 2 and 3 components of ASTER SWIR bands were used to produce RGB color composite. The result showed that, mafic and ultra-mafic rocks are manifested as red color, amphibolites as dark blue hue, undifferentiated peridotites as green tone, and color mélange including ophiolitic component, volcanic rocks, radiolarian cherts, and plagic limestone associated with Eocene sedimentary rocks as varieties of colors in Figure 2
Figure 2. RGB color composites of MNF eigenimages 1, 2, and 3 extracted from the SWIR of ASTER data.
VNIR+SWIR bands of ASTER were also examined for lithological discriminations. Therefore, RGB band combinations were generated for MNF components of bands 1, 2, and 3. Figure 3 shows that the amphibolites are appeared as yellow tone, undifferentiated peridotites as light green, and carbonate rocks as purple hue and color mélange as blue to dark blue color. It should be noted that, the boundary and the differentiation between the varieties of rocks inside the rock units is also observable. The result showed that the boundary and the differentiation between the varieties of rocks derived from SWIR MNF components in RGB are more recognizable than MNF components derived from (VNIR+SWIR) stack layers.
The MNF components of 1, 2 and, 3 are assigned to RGB band combination of Landsat TM data were assigned to RGB band combination (Figure 4). The results showed that the mafic and ultra-mafic rock units are detected as light brownish hue, coloured mélange complex and serpentinit dunite as host rock of chromite and magnesite as light blue tone, glaucophan and amphibolite schist as green color and vegetated region appears as pink color in the study area (Figure 4).
Figure 3. RGB color composites of MNF eigenimages 1, 2, and 3 extracted from the (VNIR+SWIR) ASTER data.
Figure 4. RGB color composites of MNF eigenimages 1, 2, and 3 extracted from Landsat TM data.
Based on characteristics of spectral ASTER bands a specialized band ratio of (4/1, 4/5, 4/7) in RGB was developed for lithological mapping in ophiolitic complex (Figure 5). It is identified that this band ratio was able to detect serpentinites (host rock of chromitites) in the ophiolite complex from surrounding rock units as a pinkish color, igneous rocks as orange tone and colored mélange complex as a variety of colors. Specialized band ratio of (4/1, 4/5, 4/7) could recognize serpentinites (host rock of chromitites) better than other band ratios existing in the literature that tested in the study area.
Figure 5. Band ratio of 4/1, 4/5, 4/7 in RGB derived from ASTER data.
Figure 6. The SAM image map derived from ASTER data.
Figure 7. The SAM image map derived from Landsat TM data.
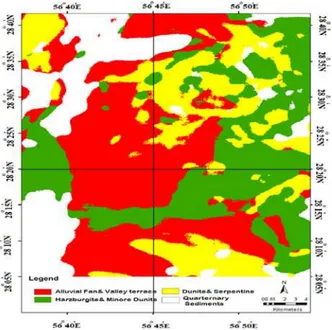
Figure 8. The produced map of the study area based on feature level fusion (FLF) technique.
4. CONCLUSIONS
The identification of different lithologhies and detection of host rock of chromitites in ophiolitic complexes were carried out using ASTER and Landsat TM data in the Esfandaghe region, south of Iran. Various image processing methods, including MNF, specialized band ratio, SAM and FLF were used for geological mapping, which have great potential to study ophiolitic complexes in arid and semi-arid regions. Spectral transformation methods such as MNF and specialized band ratio detected different rock units and serpentinized dunite as host rock of chromitites within ophiolitic complexes at a regional scale. Band ratio (4/1, 4/5, 4/7 in RGB) of ASTER data has high capability to detect serpentinized dunite in ophiolitic complexes. SAM technique was employed on ASTER and Landsat TM images to extract features and lithological characteristics. Then, geological map of the study area was produced based on SAM results and FLF technique. Consequently, high potential areas (serpentinite dunite) were identified in the study area for chromite exploration targets. The generated map showed that FLF is an appropriate technique for geological mapping and exploration chromitites in ophiolitic complexes in arid and semi-arid regions. Field investigation and laboratory Analysis verified the approach used in this study. This study recommends the use of the FLF technique for lithological mapping and detection of serpentinite dunite as host rocks of chromite ore deposits within vast ophiolitic complexes, which contribute significantly to economic geology for identifying podiform chromitites deposits.
ACKNOWLEDGEMENTS
REFERENCES
Arai, S., 1997. Origin of podiform chromitites. Journal of Asian Earth Sciences, v. 15, p. 303-210.
Arai, S. and Yurimoto, H., 1994. Podiform chromitites of the Tari-Misaka ultramafic complex, southwestern Japan, as mantle-melt interaction products. Economic Geology, v. 89, p. 104-111.
Boardman J. W. and Kruse, F. A., 1994. Automated spectral analysis: A geologic example using AVIRIS data, north Grapevine Mountains, Nevada: in Proceedings, Tenth Thematic Conference on Geologic Remote Sensing.
Harsanyi, J.C., Farrand, W.H. and Chang, C.I., 1994. Detection of subpixel signatures in hyperspectral image sequences. Proceedings of 1994 ASPRS Annual Conference, Reno, Nevada, 236-247.
Hashim, M. S. Ahmad, M.A.M. Johari, A.B Pour., 2013. Automatic lineament extraction in a heavily vegetated region using Landsat Enhanced Thematic Mapper (ETM+) imagery, Adv. Space Research, vol.51, pp. 874-890.
Khan, S.D., Mahmood, K., Casey, J.F., 2007. Mapping of Muslim Bagh ophiolite complex (Pakistan) using new remote sensing, and field data. Journal of Asian Earth Sciences 30, 333-43.
Ninomiya, Y., Fu, B. and Cudahy, T.J., 2005. Detecting lithology with Advanced Spaceborne Thermal Emission and Reflection Radiometer (ASTER) multispectral thermal infrared ‘‘radiance-at-sensor” data. Remote Sensing of Environment, 99 (1-2), 127-139.
Pour, A.B., Hashim, M., 2011a. Identification of hydrothermal alteration minerals for exploring of porphyry copper deposit using ASTER data, SE Iran. Journal of Asian Earth Sciences 42, 1309-23.
Pour, A.B., Hashim, M., 2011b. Spectral transformation of ASTER data and the discrimination of hydrothermal alteration minerals in a semi-arid region, SE Iran. International Journal of the Physical Sciences 6, 2037-59.
Pour, B.A., Hashim, M., Van Genderen, J., 2013. Detection of hydrothermal alteration zones in a tropical region using satellite remote sensing data: Bau goldfield, Sarawak, Malaysia. Ore Geology Reviews, 54, 181-196.
Pour, A.B., Hashim, M. 2013. Fusing ASTER, ALI and Hyperion data for enhanced mineral mapping. International Journal of Image and Data Fusion, 4, 126-145.
Pour, A.B., Hashim, M., 2014. Structural geology mapping using PALSAR data in the Bau gold mining district, Sarawak, Malaysia, Adv. Space Research, vol.54 (4), pp. 644-654. Pour, A.B., Hashim, M., 2015. Structural mapping using PALSAR data in the Central Gold Belt Peninsular Malaysia, Ore Geology Reviews, vol.64, pp. 13-22.