Mineralogical Mapping using Field and Image Based Spectra in Parts of
Delhi-Aravalli Fold Belt, Rajasthan, India
Mahmuda Khatun
1*, Richa U. Sharma
2, Shovan Lal Chattoraj
2and P. K. Champati Ray
21
Geological Sciences, Jahangirnagar University, Savar, Dhaka-1342, Bangladesh
2
Geosciences and Geo-hazard Department, Indian Institute of Remote Sensing, 4-kalidas Road, Dehradun, India
*
Email: [email protected]Abstract. The objectives of this study were to retrieve reflectance utilizing the raw (radiance) data from EO-1 Hyperion dataset and to evaluate its application potential in mineral exploration in parts of Delhi-Aravalli Fold Belt region of western India. The area is marked by basement Precambrian gneissic rocks, overlain by supra crustal cover of the Aravalli Super group, Delhi Super group, Vindhyan Super group and younger rocks. These rocks are highly metamorphosed, structurally deformed and show sporadic occurrences of important ore minerals deposits of metallic (Pb, Zn, Cu) and non metallic minerals (Apatite and Marbles). This paper involves generation of hyperspectral image spectra and field spectra to identify spectral characteristics of minerals. FLAASH (expansion) atmospheric correction model was applied to retrieve reflectance image from the radiance data. Preprocessing techniques involved selection of good spectral bands, correction of missing lines and pixels before application of FLAASH atmospheric model. Using image processing techniques suitable for hyperspectral image analysis (Spectral Angle Mapper, MNF, End-member matching), Hyperion data over Udaipur, Dungarpur and Chittorgarh districts was analysed and minerals were identified such as rectorite, pyrope, dolomite, montmorillonite, erionite, talc, phologopite, pyrrohite, hematite,olivine, diopside, pyrite, tephrite, lepidolite, andalusite and Fe-rich chlorite. The end member map generated by using advance techniques like SAM was validated using ground truth and spot sample collected, therein, was further analyzed using spectro radiometer in VNIR range. Keeping view on the ubiquitous hydrothermal origin of base metals, special emphasis was put to clay-mica group of minerals as they often proxy for the zone of alteration. This lead to defining the exact zone of hydrothermal alteration throwing light on proximity with igneous intrusion and type associated of metal. Application of such technology is likely to benefit mineral identification for precious metals particularly in frontier regions where geological information is scarcely available or largely inaccessible.
Keywords: Hyperion, Delhi Aravalli belt, FLAASH, spectral angle mapper, MNF, end members.
Introduction
Hyperspectral remote sensing, measuring hundreds of spectral bands from aircraft and satellite platforms, provides a unique spatial/spectral datasets for analysis
of surface mineralogy (Goetz et al., 1985; Kruse et al.,
2003). These data allow mapping of key iron mineralogy such as hematite, goethite, and jarosite as well as alteration minerals such as kaolinite, dickite, alunite, and sericite (Clark et al., 1990). As a result of which hyperspectral imaging technology has been well established as one of the most sought after exploration tools in geology and it is only constrained by
availability of data (Goetz et al., 1985; Kruse et al.,
1999, 2003; Rowan and Mars, 2003).
The study area around Udaipur, Dungarpur and Chittorgarh of southernmost part of Rajasthan, India belongs to the Delhi-Aravalli range, one of the oldest folded mountain ranges of the world. Two Hyperion scenes of each of 42km scene length were selected for the present study (fig. 1). The first scene (1) covered Udaipur city of Rajasthan and its surroundings, whereas the second Hyperion scene (2) covered areas around Dungarpur and Chittorgarh and its surrounding. Udaipur city is situated at an altitude of 577 m above
MSL and lies on the eastern flanks of the Aravalli Mountains in South Rajasthan, overlooking the Ahar valley. It shows semi-arid terrain with negligible amount of vegetation. The Dungarpur and Chittorgarh is a densely vegetated terrain with large number of hillocks and scattered hills spread throughout the valley. The southwestern and northern part of the area is relatively plain.
Mineral exploration is the systematic investigation of a mineral deposit, encompassing thorough geological investigation to ascertain the target zone for further exploration. Hyper spectral remote sensing data provide unique spectral characteristics of many alteration and rock-forming minerals to map them with high accuracy and thereby contribute to the field of exploration geology.
Geological setting
Rajasthan comprises of a continuous geological sequence of rocks starting from oldest Archean rocks to recent alluvium formations. The oldest formation is known as Banded Gneissic Complex that is exposed in central and southern Rajasthan. The Aravalli hill range dividing the state diagonally is made up of
Legend Granie and Gneiss Pebbly meta arkose Phylite, mica schist, quartzite, marble Phyllite and mica Schist Phyllite and mica schist Quartzite Dolerite and amphibolite Migmatite gneiss and feldspathoid schist
Quartz-chliorite schist,phyllite mica,dolomite
Precambrian rocks of Aravalli and Delhi Super group comprising the metamorphosed gneiss, schist, marble, quartzite, calc silicate, ultra basic and acidic intrusive rocks. The eastern and southeastern parts of the State are occupied by rocks of Vindhyan Super group mainly forming a plateau of sandstone, shale and limestone. In the southern part, Deccan trap formations of Cretaceous age are exposed. Geologically the area belongs to Delhi-Aravalli Super group. The most significant result of compression tectonics is the developments of faults and dislocation of Aravalli fold belt. The Aravalli fold belt is made up of two lithological packages known as the Aravalli Super group and the Delhi Super group, unconformably overlying the Achaean complex of gneisses and granites. The Aravalli Super group is composed of basal quartzite, shale and conglomerate, composite gneisses and slate. It is mainly divided into three
groups such as Delwara, Debari and Jharol Group and ultramafics. The Delhi Super group overlies the Aravalli Super group. The geological evolution of south-eastern Rajasthan is attributed to three orogenic cycles represented by Banded Gneissic complex (BGC), Aravalli Super group and Delhi Super group (Heron, 1953).
These rocks are highly metamorphosed, intricately deformed and show ore minerals occurrences of great commercial importance. Rajasthan has the second largest mineral reserves in India. It produces 42 varieties of major minerals and 23 varieties of minor minerals. It is also a store-house of 70% of the country's non-ferrous metallic minerals. It produces 90% of the country's copper and zinc and the largest copper smelter in the country is located in the State (Roy and Jakhar, 2002).
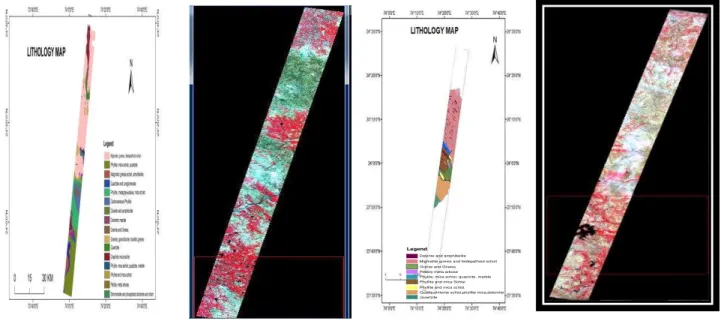
Fig. 1 a) Lithology Map of Scene-1
EO1H1480432013070110_KZ, Udaipur District,
Rajasthan.
b) Lithology Map of Scene-2
EO1H1470432013067110_kz, Dungarpur District,
Rajasthan.
(Source: District Resource Map, Udaipur District (1:2,50,000) and District Resource Map, Dungarpur
District (1:2,50,000).
Material and Methods
Hyper spectral image processing chain described below has been adopted for the present study. This approach was implemented in ENVI software developed by RSI. The Hyperion sensor on board EO-I satellite from a 705 km orbit covers a spectral range of 0.4 to 2.5 µm in 242 spectral bands with spectral resolution of 10 nm and spatial resolution of 30 m. This data consist some bad bands and bad column that were removed by the preprocessing techniques. The atmospheric effects present in the data were using atmospheric correction model named as Fast
Line-of-sight Atmospheric Analysis of Spectral Hyper-cubes (FLAASH). Since the hyper spectral data has many correlated contiguous spectral bands, in order to reduce the dimensionality and redundancy in data, Minimum Noise Fraction (MNF) transformation was used. The MNF bands with high Eigen value (>1) were used as an input for pixel purity index (PPI) to find pure pixels , as these band have more variance and less redundancy. The PPI was performed on selected MNF bands and it provided the most spectrally pure or
computation is based on projections of n-dimensional scatter plots on to 2-D space, thereby defining the extreme pixels in each of the projections. In PPI image, the DN value of each pixel exhibits the number of times that pixel was recorded as pure pixel or extreme or corner pixel. Thus, bright pixels in the image depict the spatial location of the pixels which are likely to be more pure or end-members in an image. The pure pixels identified by PPI were plotted in n- dimensional visualizer to identify end-members that were used for classifying the image using Spectral Angle Mapper (SAM) algorithm.
Results and Discussion
Hyperion data for the Udaipur and Chittargorh, Rajasthan, India site were acquired on 8 &11 March 2013. Hyperion is an EOI satellite Hyper spectral sensor covering the 0.4 to 2.5 µm spectral range with 242 spectral bands at 10 nm spectral resolution and 30 m spatial resolution from a 705 km orbit.
Processing of high dimensional Hyper spectral data is a challenging task and the computational complexity is a result of vast data volume in numerous spectral bands. Since Hyperion sensor operates from a space platform with modest surface signal levels and a full column of atmosphere attenuating the signal, the data demand careful processing to manage sensor noise. The errors are said to be caused due to calibration differences in the detector array (Good enough et al., 2003). The Hyperion dataset were corrected for abnormal pixels, striping and smiling prior to the atmospheric correction. Pre-processing of Hyper spectral images is required not only for removing sensor errors during acquisition but also for display,
band selection (to reduce the data dimensionality) and to reduce computational complexity.
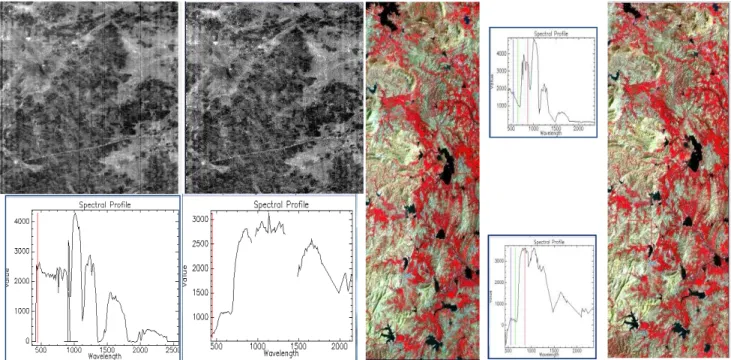
Effect of de striping filter
Detection of bad columns is carried out using thresholds based on the median values from its neighborhood. The bad pixel is then replaced with the median value of its neighborhood (Datt et al., 2003). The value of threshold is scene dependent and different for each containing stripes. Setting up of the threshold is at the cost of changing spectra.
Local band de-stripping techniques was used to remove the stripes in the various bands of the Hyperion dataset. Presence of vertical stripes in the various bands of dataset, it can be attributed to the sensor incapability. Examination of difference between the L1R products and de-stripped image indicates that the stripes in VNIR are removed and the image appears smooth. Fig. 3 shows the effect of de-stripping on the image and the corresponding DN values of one stripe on the image using the filter on the Hyperion datasets. From the visual inspection of the two images there is an overall contrast difference between the two. The difference is mainly due to the change in image statistics resulting from the de-stripping of bad columns.
The de-stripping results are well manifested in the resultant spectra. The image spectra improves after performing de-stripping spurious spike in the VNIR region (300 to 700 nm) are reduced, while no change in the spectra is seen in SWIR. Fig. 2 illustrates spectra taken at bad column in L1R product and de-stripping processing.
Fig. 2 Local balancing effect of de-stripping on the image spectra taken over know bad column. A) Spectra of L1R product B) spectra after de-stripping.
Atmospheric correction
The results of atmospheric correction of Hyperion data in the form of changes in reflectance spectra of vegetation on the images before and after FLAASH atmospheric correction are presented in Fig. 3. Most important parameters like atmospheric model-Tropical, water absorption feature (band)-1135 nm, aerosol model-rural, initial visibility-40km, and Modtran multiscaler model-scaled DISTORT, spectral resolution
15cm-1 are selected in the process of atmospheric
correction. To remove the noise during atmospheric correction of images, spectral polishing is using the average of neighbouring multiple bands. For Hyperion hyperspectral data with 10nm resolution, the number of 9 is used. The results observed that reflectance of Hyperion image showed the high spectral information of the objects. After FLAASH atmospheric correction, vegetation shows typical reflectance curve with high reflectance at green band, low reflectance at red band and again very high reflectance in NIR band.
Minimum Noise Fraction Result
MNF transformation was applied after atmospheric corrections. After applying the MNF technique on the both Hyperion datasets, 137 and 126 Hyperion bands 137 and 126 new bands were generated. MNF result shows that band-1 have the highest eigen values (46.05 and 37.74) and highest variance whereas values are
decreasing with increasing band numbers. When
Fig.
5. MNF Eigen values Plot in Scene 1&2
examining the values, it was observed that the first 10 and 15 bands have the highest Eigen values (>1) while the rest have values less than 1. These low Eigen values are seen in the image as noise. So the first 10 and 15 bands of the MNF transformation were selected for furtherprocessing.
Pixel Purity Index (PPI) and End member Spectra Generation
Pixel Purity Index (PPI) function was performed on selected MNF bands to find the most spectrally pure or
“extreme” pixels in hyperspectral data. PPI was
computed by projections of n-dimensional scatter plots to 2-D space and marked as the extreme pixels in each projection. PPI was performed using both Hyperion images, the first 07 and 15 bands respectively of MNF transformation. PPI was processed with 15000 iterations and threshold value of 2.3. Threshold factor should be approximately two to three times to the noise level in the data. Larger threshold values results more extreme pixels, but are likely less to be pure end members (ENVI User Guide 2006). PPI plot showed the total number of extreme pixels satisfying the threshold criteria. In PPI image, each pixel exhibits the number of times that pixel was recorded as extreme or
pure pixel. Thus, bright pixels in the image depict the
spatial location of spectral endmembers n-D
Visualization in conjunction with the Minimum Noise Fraction Transform (MNF) and Pixel Purity Index (PPI) tools was used to locate, identify and cluster the purest pixels and most extreme spectral responses in a data set. The distribution of these points in n-space was used to estimate the spectral endmembers and to locate the corresponding pixels on the satellite image (std. FCC). The field data were used to verify their location.
End members Spectra Generation
The n-Dimensional visualizer provides an opportunity for interactive selection of the end members in n-space. The n-D visualizer is used in conjunction with the Minimum Noise Fraction Transform (MNF) and Pixel Purity index (PPI) tools to locate, identify and cluster the purest pixels and most extreme spectral responses in a data set. The n-Dimensional visualizer allows for interactive rotation of data in n-D space, selection of groups of pixels into different classes (Boardman, 1993; Boardman and Kruse, 1994). Here in this study this procedure was followed to isolate different group of pixels representing different end members. Several groups of pixels were isolated mostly projected at the corners of the scatter plot or completely isolated in the interactive scatter plots.
Selection of end-members can be obtained in three ways-
i. By generating spectral library from field or
laboratory data
ii. Pixel Purity Index (PPI) and n-D visualization of
the image
iii. Existing spectral library such as USGS, JPL.
iv. The selected classes were matched with the USGS
spectral library.
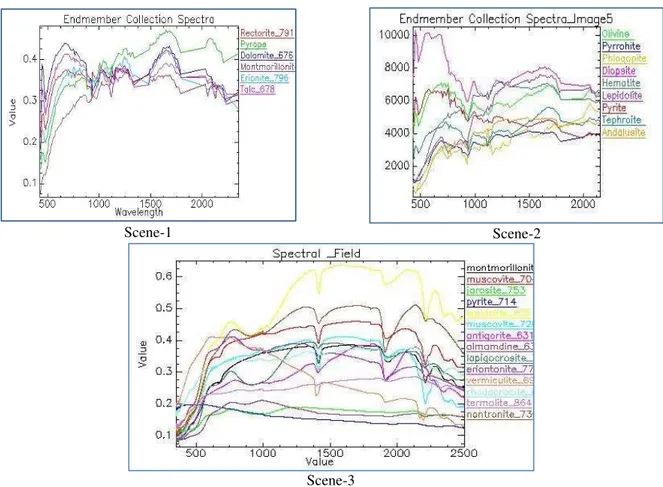
Within two Hyperion images 06 and 09 end members were selected those having scored more than 0.7
(Rectorite, Pyrope, Dolomite, Montmorillonite,
Scene-1 Scene-2
Scene-3
Fig. 4 Final end members from both Hyperion Image spectra scene 1 and scene 2 respectively and Field spectra.
SAM Classification Image
The Hyperion Images were classified using the end members scene1 six (06) and scene2 Nine (09) namely Rectorite, Pyrope, Dolomite, Montmorillonite, Erionite and Talc and Andalusite, Diopside, Lepidolite,
Phlogopite, Hematite, Pyrite, Pyrrohotite, Tephrite and Olivine respectively. The image classified by Spectral Angle Mapper (SAM) show the presence of these minerals in the study area (Fig. 5).
Discussion
The spectra of pure pixels were plot into an n- dimensional scatter plot to determine the end members. The resample USGS mineral library is used through spectral analyst to identify the material of the end members extracted from N-D Visualizer. The Spectral
Angle Mapper technique was used for the
identification. The pixel clusters for each material were refined and finalized by checking spectral profiles of each and every pixel in the cluster. Finally Fifteen (15) minerals were identified through the process in scene (1&2). The spectral profiles of the end member minerals were used for abundance mapping are shown in the following fig. 4. To locate the best places for each mineral, a combined map was prepared using angle mapper wherein threshold values of each end members were used. The final mineralogical map created from the abundance maps using Spectral Angle Mapper is shown in the fig. 5.
The study illustrates that Hyperion data is useful for identifying mineral abundances and mapping the
geological characteristics. Minerals identified are in
accordance with the ground lithology, but the spatial distribution of those minerals in the map is affected by topographic disturbances and presence of vegetation .Topography, vegetation along with the use of reference spectra from the standard spectral libraries which differ to a large extent from the spectra of actual minerals in the field conditions, has led to some amount of misclassification. Hence the output mineral
map shows many ‘false positives’ along with the
correct results. If Mixture Tune Matched Filtering is used, it may be give good result in mapping the end members than Spectral Angle Mapper technique.
Conclusion
The purpose of this study was to investigate the potential of Hyperion data in mineral potential mapping in parts of Rajasthan, western India. The hyper spectral data from EO-1 Hyperion was analysed and results were compared with the results field spectra and geological map of the study area. The standard hyper spectral techniques were applied to process the data in ENVI environment. In pre-processing, out of 242 original Hyperion bands, 137 and 126 bands were selected in scene-1 and 2
respectively. These bands were corrected
atmospherically using the FLAASH model and on corrected bands, MNF was applied for data reduction, finally PPI and n-dimensional visualization were carried out to finally select the end-members from the image. During the field investigation, rock samples were collected from both the study areas which have been used to generate the field spectra (reference spectra) using ASD. The end members were selected after understanding the geology of both the study areas. Six end members were selected for scene-1 and nine end members were selected for scene-2 in Udaipur, Dungarpur and Chittorgarh district. After
collection of end members, mapping technique spectral angle mapper (SAM) was used to map the different end members. For Udaipur study area (geologically dominated by orthoquartzites, carbonates, exposed with basal gneisses), minerals such as Rectorite, Pyrope, Dolomite, Montmorillonite, Erionite and Talc were mapped. In Dungarpur and Chittorgarh study area (dominated by meta-volcanics, schist, and their derivatives with basal gneiss) minerals such as
Andalusite, Diopside, Lepidolite, Phlogopite,
Hematite, Pyrite, Pyrrohotite, Tephrite and Olivine was mapped. Overall the study showed the potential of Hyperion data sets in mapping minerals in diverse geological conditions.
Acknowledgement
This research was done with support of different institutions on the base of CSSTEAP program. I am especially grateful to Geological survey of Bangladesh for nominating this Course, this supporting not only scientific research but also for developing communication between countries. I avail this opportunity to express my profound sense of reverence and humble gratitude to Dr. Y. V.N. Krishna Murthy, Director, IIRS and CSSTEAP, Dr. S.K. Saha, Dean, IIRS, Course Director Dr. Sarnam Singh and Course Coordinator Dr. Yogesh Kant for giving me an opportunity to undergo this training programme and for providing all sorts of facilities and support during the entire period of stay in the campus.
References
Boardman, J. W.; Kruse, F. A. (1993). Automated spectral analysis: A geologic example using AVIRIS data, north Grapevine Mountains, Nevada. In
proceedings, Tenth Thematic Conference on Geologic
Remote Sensing Environmental Research Institute of Michigan: 407-418.
Boardman, J. W. (1993). Automated spectral unmixing of AVIRIS data using convex geometry concepts: in Summaries, Fourth JPL Airborne
Geoscience Workshop, Jet Propulsion Laboratory
Publication; 1, 11 - 14.
Clark, R.N.; T.V.V. King.; M. Klejwa and G.A. Swayze. (1990). High spectral resolution spectroscopy
of minerals, J. Geophys. Res., 95 (B8), 12653-12680. 92
Datt, B.; T.R. McVicar.; T.G. Van Niel.; D.L.B.
Jupp.;J.S. Pearlman. (2003). “SMILE” distortion
effect
by applying the method described as global
statistical
destriping
may alter mid- frequency spatialeffects.
ENVI Tutorials,” Research Systems, Inc., Boulder, 2002 Websites.
for forest classification. IEEE Transactions on Geoscience and Remote Sensing, 41 (6 Part 1): 1321-1331.
Goetz, A. F. H.; Vane, G.; Solomon, J. E.; Rock, B. N. (1985). Imaging spectrometry for earth remote sensing. Science, 228, 1147-1153.
Goetz, A. F. H.; Vane, G.; Solomon, J. E.; Rock, B.N. (1985). Imaging spectrometry for earth remote
sensing: Science; 228, 1147-1153.
Heron, A. M. (1953). The geology of central
Rajaputana, Mem. Geol. Surv. Ind.; 79, 1-389.
Kruse, F. A.; Boardman J. W.; Huntington, J. F. (2003). Evaluation and Validation of EO-1 Hyperion
for Mineral Mapping,” IEEE Trans. Geosci. Rem.
Sens.; 41, 1388 – 1400.
Kruse, F. A., Boardman, J. W.; Huntington, J. F. (1999). Fifteen Years of Hyper spectral Data: northern Grapevine Mountains, Nevada: in Proceedings of the
8th JPL Airborne Earth Science Workshop: Jet
Propulsion Laboratory Publication; 99-17, 247 – 258.
Kruse, F. A.; Kiereinyoung, K. S.; Boardman, J. W.
(1990). Mineral Mapping at Cuprite, Nevada with a
63-Channel Imaging Spectrometer. Photogrammetric
Engineering and Remote Sensing; 56, 83-92.
Research Systems Inc (RSI), 2006, ENVI User’s
Guide, Research Systems Inc.
Rowan, L.C.; and J.C. Mars .(2003): Lithologic mapping in the Mountain Pass, California area using Advanced Spaceborne Thermal Emission and Reflection
Spectrometer (ASTER) data, Remote Sensing Environ.,
84, 350-366.
Roy, A. B.; Jakhar, S. R. (2002). Geology of Rajasthan (Northwest India) Precambrian to recent,. Scientific Publishers (India) Box 91, Jodhpur, p. 1-421.
S. Sinha-Roy and G. M., (1998) Geology of
Rajasthan. Bangalore, Geology Society of India,
1
stedition, 278 p.
www.ga.gov.au/image_cache/GA7833.pdf
http://glovis.usgs.gov/http://wwwgits4u.com/raj/ra