Abstract
We applied remote sensing techniques on a TM Landsat 5 image (1:50,000) to map land use and vegetation
cover of the Restinga de Jurubatiba National Park and surroundings. The thematic map generated from the
digital classification of the image allowed us to spatially characterize and quantify the different land uses
and soil covers of the area. Thirteen classes were identified. The most representative classes in the park were
the
Clusia
(31.99%) and Ericaceae formations (29.14%). More than 90% of the park is occupied by native
vegetation and coastal lagoons. The surroundings are very much altered by human activities (e.g. 70.64%
is used for agriculture and/or cattle raising). Two hundred and three forest fragments (0.3 to 235 ha) were
identified, of which 45.3% are less than 5 ha. Most fragments (56.7%) have a very elongated shape, and are
thus submitted to an intense edge effect. The intense fragmentation of the surroundings and the isolation of
this protected area can imply, in the long run, the loss of genetic diversity.
Key words
: Atlantic forest complex, landscape ecology, protected areas, remote sensing, restinga.
Resumo
Foram aplicadas técnicas de sensoriamento remoto em uma imagem TM Landsat 5 (1:50.000) para mapear uso
e cobertura vegetal do Parque Nacional da Restinga de Jurubatiba e seu entorno. O mapa temático gerado a
partir da classificação digital da imagem permitiu caracterizar espacialmente e quantificar os diferentes usos e
coberturas do solo da área. Treze classes foram identificadas. As classes mais representativas no parque foram
as formações de
Clusia
(31,99%) e Ericaceae (29,14%). Mais de 90% do parque é ocupado por vegetação nativa
e lagoas costeiras. O entorno está muito mais alterado por atividades humanas (e.g. 70,64% são utilizados
para agricultura e/ou pastagem). Duzentos e três fragmentos florestais (0,3 a 235 ha) foram identificados,
dos quais 45,3% menores que 5 ha. A maioria dos fragmentos (56,7%) tem a forma muito alongada, estando
assim submetidos a um forte efeito de borda. A intensa fragmentação do entorno e o isolamento desta área
protegida podem implicar, em longo prazo, em perda da diversidade genética.
Palavras-chave
: Complexo da Floresta Atlântica, ecologia da paisagem, áreas protegidas, sensoriamento remoto, restinga.
Vegetation cover and land use of a protected coastal area
and its surroundings, southeast Brazil
Cobertura vegetal e uso da terra de uma área costeira protegida e seu entorno no sudeste do Brasil
Elisa Araujo Penna Caris
1,6,
Bruno Coutinho Kurtz
2,
Carla Bernadete Madureira Cruz
1,3&
Fabio Rubio Scarano
4,5http://rodriguesia.jbrj.gov.br
1 Laboratório de Sensoriamento Remoto e Estudos Ambientais - ESPAÇO, Av. Brigadeiro Trompowski s/n, CCMN, bl. I – S/I-102, 21945-970, Rio de Janeiro, RJ, Brasil. 2 Instituto de Pesquisas Jardim Botânico do Rio de Janeiro, Diretoria de Pesquisa Científica, R. Pacheco Leão 915, s/ 115, 22460-030, Rio de Janeiro, RJ, Brasil. 3 Universidade Federal do Rio de Janeiro, Inst. Geociências, Depto. Geografia, Av. Brigadeiro Trompowski s/n, CCMN, bl. I – S/I-102, 21945-970, Rio de Janeiro, RJ, Brasil. 4 Universidade Federal do Rio de Janeiro, CCS, Inst. Biologia, Depto. Ecologia, C.P. 68020, 21941-970, Rio de Janeiro, RJ, Brasil.
5 Conservation International, R. Buenos Aires 68, 26º an., 20070-022, Rio de Janeiro, RJ, Brasil. 6 Corresponding author: elisacaris@yahoo.com.br
Introduction
The concept of national parks, as it first appeared in nineteenth century United States, was based on romantic visions of the beauty of nature and wilderness preservation. This was soon redefined as the preservation of complex
748
such as isolation and poor connection to other wild areas (e.g. Ayres et al. 2005). Thus, the focus on wilderness islands has been gradually shifting towards a landscape mosaic view, where networks of different types of protected areas (Metzger 2006) are fostered. Ecological corridors, for instance, are now an obvious way to perform environmental protection across size scales (Fonseca et al. 2004; Hilty et al. 2006).
This upscale movement towards a landscape approach, when dealing with protected areas, often requires application of remote sensing techniques on satellite images (e.g. Richter et al. 2004). Selection of viable and priority habitats for conservation (Anacleto et al. 2005; Ayres et al. 2005) and analysis of land use patterns and changes in time (Martins et al. 2006) are common procedures to which such tools are applied.
In this study we applied remote sensing techniques to provide a descriptive account of vegetation cover and land use of a national park protecting a coastal sandy plain ecosystem in southeast Brazil, locally named restinga, and its surroundings, here defined as a 10 km wide buffer. Our interest in this vegetation type derives from the fact that literature indicates a strong biogeographic and ecological influence of the neighboring Atlantic rain forest (Scarano 2002, 2009). For instance, it has been reported that restinga vegetation is composed by at least 80% of plant species originated from such rain forest (Araujo 2000). This descriptive effort allowed us to address two issues that are relevant to the conservation of this national park: (1) what is the land-use pattern of the national park’s surroundings? And (2) how this landscape-level analysis relates to the prevalent classification of local plant communities proposed by Araujo et al. (1998)?
Material and Methods
Study Area
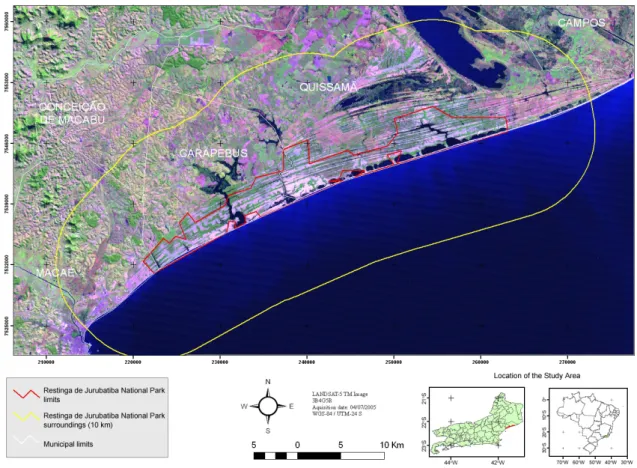
The Restinga de Jurubatiba National Park (22o08’–22o19’S; 41o17’–41o43’W) is located in the north coast of the state of Rio de Janeiro, southeast Brazil (Fig. 1). It was created on April 29th, 1998, to protect an area of 14,838 ha of sandplains and coastal lagoons, representing one of the largest
restinga ecosystems protected by federal law (Rocha et al. 2004). Jurubatiba appeared suitable for this type of study both because the results can contribute to its management and also for the fact that it has a long tradition of biodiversity research, since it houses a site of the Brazilian Long-Term Ecological Research Programs (Barbosa et al. 2004).
Unlike most sandy coastal plains in Rio de Janeiro, which date from the Holocene, the Jurubatiba plains consist of a series of parallel pleistocenic beach ridges (120,000 yr BP) formed by the silting of marine sediments (Martin et al. 1993). These beach ridges reach a maximum 10 km wide. The region is formed by three geomorphologic provinces: mountain region (area of occurrence of Precambrian crystal rocks), Tertiary tablelands (tabuleiros) and Quaternary sandy plains (see Martin et al. 1993). The park protects the Quaternary sandy plains, which display ten different plant communities according to Araujo et al. (1998): three forest formations, three open scrub areas, one closed scrub area, two grassland formations and one aquatic formation. The surroundings are composed mainly of Tertiary ground. Climate is Köppen’s Aw tropical rainy type, with hot and rainy summer and dry winter (Henriques et al. 1986).
Image processing
A Landsat 5 TM image (July 4th, 2005, referenced for the path/row 216/75) was used to generate the image map and the thematic map.
Geometric image correction was made using the Spring Software (version 4.1), based on an image of the same scene existent at the Laboratory of Remote Sensing and Environmental Studies ESPAÇO (Institute of Geosciences, Federal University of Rio de Janeiro). Control points distributed through the image, in places of easy recognition as highways, river mouths etc., were chosen. The root mean square error of the test points was of 56.04 m that is in accordance with the specification for cartographic accuracy standard for the scale proposed in category C (Cruz & Barros 2012), for elaboration of the image and thematic map. The projection used was UTM and datum WGS 84.
The limits of the national park were obtained in “shape” format (www.ibama.gov.br) with the North American 1927 datum. Datum transformation and the surrounding buffer (Fig. 1) were made in ArcMap module from ArcGis software (version 9.1).
2005 and 2007. In this occasion, the area of the national park and of the surroundings were surveyed by car in almost their entire extensions and GPS landmarks were annotated as sample areas for classification and to minimize uncertainty in the final editing process.
The scale parameter used for segmentation was 10 and the bands used were 1 (blue); 2 (green); 3 (red); 4 (near-infrared); 5 (mid-infrared) and 7 (mid-infrared). A first classification was generated based on the nearest neighbor, and a second one was generated based on modeling the descriptors average, standard deviation and ratio between all bands, and NDVI (normalized difference vegetation index). The GEOBIA classification allows for the association of a wide range of descriptors during the analysis of the best set of rules that would permit a more accurate class discrimination. In this case, this mean NDVI associated to reflectance values of some isolated bands allowed the discrimination of some classes.
The process adopted for classification is not totally automatized. Even with the supervision of
Figure 1 – Landsat 5 TM image showing the Restinga de Jurubatiba National Park and surroundings.
a specialist to establish the rules, there is a need to perform final manual editions. This procedure used the image 5R4G3B and the software ArcGis (9.1). To calculate the overall accuracy of the mapping, we used the tool “create random points”, in ArcGIS software version 9.3. It was decided to generate to each class 10 random points, since one of the classes is nearly 50% of the mapping. These points were projected on images (2005) available on Google Earth. Then, it was generated a confusion matrix, whose diagonal represents the overall accuracy. Later, the classes were quantified for the park and its surroundings.
A circularity index (CI) was obtained for each forest fragment presented in the surroundings,
following the equation CI = (2 √ π S)/P, where S = area
750
Results and Discussion
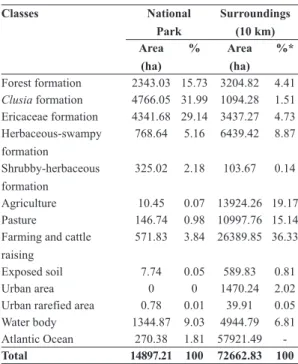
The legend of Figure 2 is the result of the automatic classification process combined with visual image interpretation and includes 13 classes of land use and soil cover for the national park and its surroundings. The overall accuracy of the mapping was 95%. The areas and percentages of each class are presented in Table 1. Due to the spatial resolution of 30 m, classes of vegetation cover comprised, in certain cases, more than one plant community described by Araujo et al. (1998). A description of classes is presented in Table 2.
Differently from some studies using remote sensing techniques already developed in this site (Henriques et al. 1986; Oliveira-Galvão 1991; Cruz
et al. 2003; Jamel 2004), we sought to correlate the classes for use and cover of the soil with the vegetation communities defined by Araujo et al. (1998), as well as to quantify these classes.
The most predominant class at the park was the Clusia formation (31.99%), where density of vegetation islands varies, thus generating different
Figure 2 – Map of vegetation cover and land use at the Restinga de Jurubatiba National Park and surroundings.
spectral images. Oliveira-Galvão (1991) recognized a “light” Clusia formation (less thicket density and greater level of anthropization) and a “dark” Clusiaformation, but our study included both in the
Clusia formation. The open formation of Palmae was included in the Clusia class. Second was the Ericaceae formation (29.14%), best represented between the Paulista lagoon and the extreme northeast of the park, where the sandy ridges are narrower. This formation is composed by three physiognomies forming together strips parallel to the sea. Taken jointly, it is easy to distinguish the Ericaceae formation, but when there are wider ridges we can confuse them with the Clusia
formation, because the spectral response is very similar. Therefore, the distinction between these formations is only possible through confirmation in the field, as done here. The mapping by Henriques
The water bodies represent 9.03% of the national park area. This includes all 18 coastal lagoons. These lagoons are shallow, with depths not over 3 m, and show considerable salinity variations among them (Enrich-Prast et al. 2004). The Atlantic Ocean was included as a class to be quantified, for being part of the official limits of the national park and it represents 1.81% of its area.
Over 90% of the park comprises native vegetation formations and water bodies. However, it would be desirable that degraded areas and/ or areas transformed into pasture and used for agriculture (4.89%) were recovered, which requires land tenure regularization. In this sense, the recent successes in ecological restoration of sandy coastal plains (e.g. Zamith & Scarano 2006) are encouraging.
Since a great part of the hydrological system of the region (lagoons, rivers and areas subject to floods; Martin et al. 1993) drains into the park, any impact or contamination (including the water table) by domestic sewage, chemical defensives and fertilizers can compromise its integrity (see
Soffiati 1998).
The surroundings of the park encompass the municipalities of Macaé, Carapebus, Quissamã, Conceição de Macabu and Campos dos Goytacazes. The Atlantic Ocean responds for 44% of the surrounding area of the park, followed by cattle raising farms (36.33%), agriculture (19.17%) and pastures (15.14%). Those three terrestrial classes together add up to 70.64% of the land use. Agriculture is represented mainly by sugar cane, although other cultures (e.g. coconut) are also found. In many cases, there are areas used both for agriculture and pasture. In the northern limit of the national park, the pasture areas reach the coastline. The agricultural activities removed the vegetation cover and changed the landscape, often entailing negative impacts in the study site. Typical examples are sugar-cane farming and the risks of associated fires, as well as the extensive grazing of cattle (that is already moving towards the interior of the national park). The lack of settlement of the land situation hinders the effective supervision of the protected area and its surroundings. Furthermore, it is apparent that most properties do not abide to the Brazilian forest code legislation (see Lewinsohn 2010; Metzger 2010). The result is that the forest fragments (N=203; 4.41% of the area) remaining in the surroundings of the park are usually isolated by a matrix composed of agriculture and cattle
Classes National
Park
Surroundings (10 km) Area
(ha)
% Area
(ha) %*
Forest formation 2343.03 15.73 3204.82 4.41 Clusia formation 4766.05 31.99 1094.28 1.51 Ericaceae formation 4341.68 29.14 3437.27 4.73 Herbaceous-swampy
formation
768.64 5.16 6439.42 8.87
Shrubby-herbaceous formation
325.02 2.18 103.67 0.14
Agriculture 10.45 0.07 13924.26 19.17 Pasture 146.74 0.98 10997.76 15.14 Farming and cattle
raising
571.83 3.84 26389.85 36.33
Exposed soil 7.74 0.05 589.83 0.81
Urban area 0 0 1470.24 2.02
Urban rarefied area 0.78 0.01 39.91 0.05 Water body 1344.87 9.03 4944.79 6.81 Atlantic Ocean 270.38 1.81 57921.49
-Total 14897.21 100 72662.83 100
* Atlantic Ocean excluded
Table 1
–Area and percentage of classes of land use
and vegetation cover of the Restinga de Jurubatiba
National Park and surroundings.
the Ericaceae formation, are very different from our study and show the non-uniform distribution of these formations along the site.
Caris, E.A.P.
et al.
Rodriguésia
64(4): 747-755. 2013
Vegetation formations found in thematic map
Plant communities described by
Araujo et al. (1998) Description
Shrubby-herbaceous formation
Reptant halophila-psammophila Post-beach dense shrubby form
Comprises two communities: the reptant halophila-psammophila that begins near the beach slope and usually assumes widths between 5 to 10 m (sometimes covering the external ridge entirely in places where the adjacent community was degraded); and the post-beach dense shrubby formation, adjacent to the former, that originally covered the external sandy ridge crest.
Clusia formation Clusia open scrub Palmae open scrub
Comprises two communities: the first one (Clusia open scrub), and more representative, is
formed by vegetation islands of varied sizes interspersed with sand stretches with sparse
vegetation. Clusia hilariana Schltdl. (Clusiaceae) is the dominant tree species. The second
(Palmae open scrub) occupies in general areas where original tree or shrub formations were
devastated or subjected to periodic fires. The dominant species is the dwarf palm Allagoptera
arenaria (Gomes) Kuntze, which is resistant to fire.
Ericaceae formation Ericaceae open scrub
This formation is composed by three physiognomies, forming together strips parallel to the sea.
The first is an open sandbank with vegetation islands, which are inserted by topographically lower strips, with dense herbaceous or more spaced cover (that flood in the periods of increased
rainfall). Between the strips with islands and herbaceous vegetation, there is a thicket of shrub-trees with approximately 4-6 m of height.
Forest formation
Periodically flooded forest Permanently flooded forest
Forest on sandy ridge
Comprises three communities: the periodically flooded woods, which occur in the swales
between sandy ridges, in ancient lagoon areas, and are subject to surfacing of the water table
during the rainy season; the permanently flooded woods, closer to the lagoons, which are subjected to almost constant flooding by the water table, and present an open and lower canopy; and the woods on sandy ridge, without influence of the water table, which are placed on older
ridges and present few remnants in the area. In some instances, those three physiognomies can occur side by side, following topographic variations.
Herbaceous-swampy
formation Herbaceous-swampy Aquatic
Comprises two communities: the herbaceous-swampy, which are frequently dominated by
Typhadomingensis Pers.; and the aquatic formation, adjacent to the former, which occurs in some of the local lagoons.
Table 2
– Relationship between the classes found in thematic map elaborated from Landsat 5 image, 2005, and the plant communities described by Araujo
et al
. (1998)
raising activities. This adds to the difficulty for preservation of those fragments and puts their sustainability at risk (see Viana & Pinheiro 1998). The smallest fragment is 0.3 ha while the largest is 235 ha. The latter is located on a slope, which may have favored its preservation. Fragments < 5 ha are the most frequent (45.3%), which is a common pattern elsewhere in the Atlantic forest domain (e.g. Ribeiro et al. 2009). These studies highlight the biological relevance of preserving such small fragments.
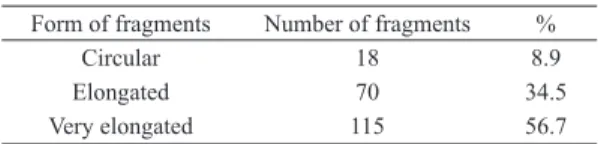
More than half (56.7%) of the forest fragments presented a “very elongated” shape (Tab. 3) and would, therefore, be subject to greater border effect (Viana & Pinheiro 1998). Considering that restinga species were mostly originated in the Atlantic forest, preservation and restoration of fragments in the surroundings of the national park should be essential to maintain gene flow and local biodiversity. Moreover, there are no available floristic surveys of such fragments.
Additional classes in the national park surroundings include water bodies (6.81%); herbaceous-swampy (8.87%); remnants of Clusia
(1.51%) and Ericaceae (4.73%) formations inside private properties and used for pasture; small remnants of the shrubby-herbaceous formation (0.14%) along the coastline, not yet destroyed by the construction of houses, pasture or transit of vehicles; and urban areas (2.02%) that do not have intense vertical constructions or large populations, except for an initially illegal housing development that borders the southwest limit of the park. Finally, beach houses at Carapebus (municipality of Carapebus), João Francisco and Visgueiro (municipality of Quissamã) correspond to the urban rarefied area (0.05%) and its impact on the national park is felt especially during weekends, holidays and vacation periods. The bare soil class (0.81%) is found along the entire park surrounding, without specific concentration.
Our study showed that the surroundings of this protected area are highly fragmented (see also Cruz et al. 2003). This results in a virtual isolation of the national park from the regional remnants of Atlantic Forest, which are located mainly on slopes of the Serra do Mar in a range that here varies from 10 to 30 km on a straight line. In this scenario, the reduction of gene flow may be critical to maintaining the diversity and functioning of the local restinga. Furthermore, resilience to climate change also diminishes (Scarano & Garbin 2013).
Restoration efforts, especially aimed at the creation of corridors, should also target the continent-sea axis, rather than focusing only the continent-continent axis.
The thematic map produced based on the digital classification of the Landsat 5 image allowed for a spatial characterization of the different uses and soil cover of the national park and its surroundings. The difficulty in determining all plant communities described for the park by Araujo
et al. (1998) led to a simplification of the legend. This was due to the spatial resolution of 30 m of the sensor. Since the limits between plant formations is very thin, the use of high resolution images would have favored a better class discrimination, as shown elsewhere (Kurihara & Encinas 2003; Dlugosz et al 2005; Caris et al 2009). However, given the high costs of acquisition of such images and the time needed to digitally process the data, images of medium resolution, as the one used in this study, offer a better cost-benefit ratio. For this reason these images and their products have been frequently used as important tools in the management of protected areas (e.g. Richter et al. 2004).
Acknowledgements
We thank the Brazilian Environmental Agency (IBAMA) for working permits and local staff for logistic support; J. Caruzo, O. Faber, T.S. Conceição and Keidel, G. for field and technical assistance; the Research Center of the Brazilian Oil Company (Cenpes-Petrobras) for financial support; the National Institute for Space Research (INPE) for the Landsat image cession; R.R. Oliveira, L.M.M. Liu, D.S.D. Araujo, C.A. Bohrer and anonymous reviewers for critical reading of the manuscript; and Brazilian Research Council (CNPq) for productivity grant to FRS.
References
Anacleto, T.C.S.; Ferreira, A.A.; Diniz Filho, J.A.F. & Ferreira, L.G. 2005. Seleção de áreas de interesse
Table 3 – Form of forest fragments in the surroundings
of the Restinga de Jurubatiba National Park, calculated
by the circularity index.
Form of fragments Number of fragments %
Circular 18 8.9
Elongated 70 34.5
754
ecológico através de sensoriamento remoto e de otimização matemática: um estudo de caso no município de Cocalinho, MT. Acta Amazônica 35: 437-444. Araujo, D.S.D.; Scarano, F.R.; Sá, C.F.C.; Kurtz, B.C.;
Zaluar, H.L.T.; Montezuma, R.C.M. & Oliveira, R.C. 1998. Comunidades vegetais do Parque Nacional da Restinga de Jurubatiba. In: Esteves, F.A (ed.). Ecologia das lagoas costeiras do Parque Nacional da Restinga de Jurubatiba e do município de Macaé. NUPEM-UFRJ, Rio de Janeiro. Pp. 37-62.
Araujo, D.S.D. 2000. Análise florística e fitogeográfica
das “restingas” do estado do Rio de Janeiro. Tese de Doutorado. Universidade Federal do Rio de Janeiro, Rio de Janeiro. 176p.
Ayres, M.; Fonseca, A.B.G.; Rylands, A.B.; Queiroz, H.L.; Pinto, L.P.S.; Masterson, D. & Cavalcanti, R.B. 2005. Os corredores ecológicos das florestas tropicais do Brasil. Sociedade Civil Mamirauá, Belém. 256p.
Barbosa, F.A.R.; Scarano, F.R.; Sabara, MG. & Esteves, F.A. 2004. Brazilian LTER: ecosystem and biodiversity informations in support of decision-making. Environmental Monitoring and Assessment 90: 121-133.
Caris, E.A.P.; Kurtz, B.C.; Cruz, C.B.M. & Scarano, F.R. 2009. As perspectivas do uso de imagens de alta resolução em estudos ecológicos – um estudo de caso para o Parque Nacional da Restinga de Jurubatiba, RJ. In: Anais XIV Simpósio Brasileiro de Sensoriamento Remoto. Instituto de Pesquisas Espaciais, Natal. Pp:2637-2644.
Cruz, C.B.M.; Freitas, S.R.; Seabra, V.S.; Barros, R.S. & Medeiros, A.F.F. 2003. Dinamismo Ambiental do Parque Nacional de Jurubatiba e seu entorno – Rio de Janeiro. In: Anais XXI Congresso Brasileiro de
Cartografia. Sociedade Brasileira de Cartografia,
Belo Horizonte.
Cruz, C.B.M.; Vicens, R.S.; Seabra, V.S.; Reis, R.B.; Faber, O.A.; Arnaut, P.K.E & Araujo, M. 2007.
Classificação orientada a objetos no mapeamento dos
remanescentes da cobertura vegetal do bioma Mata Atlântica, na escala 1:250.000. In: XIII Simpósio Brasileiro de Sensoriamento Remoto. Instituto de Pesquisas Espaciais, Florianópolis. Pp. 5961-5698 Cruz, C.B.M. & Barros, R.S. 2012. Contribution
of new sensors to cartography. In: C. Bateira, Cartography – A Toll for Spatial Analysis. InTech, DOI. Disponível em <http://www.intechopen.com/ books/cartography-a-tool-for-spatial-analysis/ contribution-of-new-sensors-to-cartography>. Acesso em 15 Abr 2013.
Dlugosz, F.L.; Rosot, N.C.; Rosot, M.A.D. & Oliveira, Y.M.M. 2005. Uso da segmentação por crescimento de regiões em imagens Ikonos na discriminação de
tipologias da Floresta Ombrófila Mista. In: Anais do XII Simpósio Brasileiro de Sensoriamento
Remoto. Instituto de Pesquisas Espaciais, Goiânia. Pp. 1493-1500.
Enrich-Prast, A.; Bozelli, R.L.; Esteves, F.A. & Meirelles, F.P. 2004. Lagoas costeiras da restinga de Jurubatiba. In: Rocha, C.F.D.; Esteves, F.A. & Scarano, F.R (eds.). Pesquisas de longa duração na Restinga de Jurubatiba: ecologia, história natural e conservação. Ed. RiMa, São Carlos. Pp. 245-253. Fonseca, G.A.B.; Alger, K.; Pinto, M.; Araujo &
Cavalcanti, R. 2004. Corredores de biodiversidade: o corredor central da Mata Atlântica. In: Aruda, M.B. & Sá, L.F.S.N (eds.) Corredores ecológicos: uma abordagem integradora de ecossistemas no Brasil. Ibama, Brasília. Pp. 47-65.
Henriques, R.P.B.; Araujo, D.S.D. & Hay, J.D. 1986.
Descrição e classificação dos tipos de vegetação
da restinga de Carapebus, Rio de Janeiro. Revista Brasileira de Botânica 9: 173-189.
Hilty, J.A.; Lidicker, Jr. W.Z. & Merenlender, A.M. 2006. Corridor ecology: the science and practice of linking landsacapes for biodiversity conservation. Island Press, Washington. 344p.
Hironaka, A. 2003. Science and the environment. In:
Drori, G.S.; Meyer, J.W.; Ramirez, F.O. & Schofer, E. (eds.). Science in the modern world polity. Stanford University Press, Stanford. Pp. 249-264. Jamel, C.E.G. 2004. Caracterização da vegetação da
Restinga de Jurubatiba com base em Sensoriamento
Remoto e Sistema de Informações Geográficas:
estado atual e perspectivas. In: Rocha, C.F.D.; Esteves, F.A. & Scarano, F.R. (eds.).Pesquisas de longa duração na Restinga de Jurubatiba: ecologia, história natural e conservação. Ed. RiMa, São Carlos. Pp.25-42.
Kurihara, D.L. & Encinas, J.I. 2003. Análise da arborização do Campus da Universidade de Brasília através de imagens Ikonos. Brasil Florestal 78:81-87. Lewinsohn, T.M. 2010. The ABECO and the Brazilian
Forest Code. Natureza & Conservação 8: 100-101.
Martin, L.; Suguio, K. & Flexor, J.M. 1993. As flutuações
de nível do mar durante o quaternário superior e a evolução geológica de “deltas” brasileiros. Boletim do Instituto de Geologia – USP 15: 1-186. Martins e Souza Filho, P.W.; Paradella, W.R. & Souza
Junior, C. 2006. Sensoriamento remoto e recursos naturais da Amazônia.Ciência e Cultura 58: 37-41. Metzger, J.P. 2006. Novas perspectivas de conservação baseadas na Rcologia de Paisagens. In: Mariath, J.E.A.& Santo, R.P. (eds.). Os avanços da botânica
no início do século XXI – morfologia, fisiologia,
taxonomia, ecologia e genética. Sociedade Botânica do Brasil, Porto Alegre. Pp. 453-456.
Metzger J.P. 2010. O Código Florestal tem base
científica? Natureza & Conservação8:92-99. Nascimento, M.C.; Soares, V.P.; Ribeiro, C.A.A.S. &
vegetação florestal nativa da bacia hidrográfica do
Rio Alegre, Espírito Santo, a partir de imagens do satélite Ikonos II. Revista Árvore 30: 389-398. Oliveira-Galvão, A.L.C. 1991. Caracterização
fitofisionômica da Restinga de Carapebus, Macaé
(RJ), a partir de imagens digitais do sensor TM – Landsat 5. Dissertação de Mestrado, Instituto Nacional de Pesquisas Espaciais, São José dos Campos. 223p.
Ribeiro, M.C.; Metzger, J.P.; Martensen, A.C.; Ponzoni, F.J. & Hirota, M.M. 2009. Brazilian Atlantic forest: how much is left and how is the remaining forest distributed? Implications for conservation. Biological Conservation 142: 1141-1153.
Richter, M.; Cruz, C.B.M. & Valentim, L. 2004. Análise do uso e ocupação do solo no Parque Nacional do Itatiaia a partir de produtos de Sensoriamento Remoto. In: Anais do IV Congresso Brasileiro de Unidades de Conservação, Vol. I, Trabalhos Técnicos. Rede Nacional Pró-Unidades de Conservação / Fundação O Boticário de Proteção à Natureza, Curitiba. Pp. 481-490.
Rocha, C.F.D.; Bergallo, H.G.; Alves, M.A.S. & Sluys, M.V. 2004. A restinga de Jurubatiba e a conservação dos ambientes de restinga do estado do Rio de Janeiro. In: Rocha, C.F.D.; Esteves, F.A.
& Scarano, F.R. (eds.).Pesquisas de longa duração na Restinga de Jurubatiba: ecologia, história natural e conservação. RiMa, São Carlos. Pp. 341-352.
Scarano, F.R. 2002. Structure, function and floristic
relationships of plant communities in stressful habitats marginal to the Brazilian Atlantic rainforest. Annals of Botany 90: 517-524.
Scarano, F.R. 2009. Plant communities at the periphery of the Atlantic rain forest: rare-species bias and its risks for conservation. Biological Conservation 142: 1201-1208.
Scarano, F.R. & Garbin, M.L. 2013. Stem species: the regenerating cells of Gaia. Nova Acta Leopoldina 114 (in press).
Soffiati, A. 1998. Aspectos históricos das lagoas do norte
do estado do Rio de Janeiro. In: Esteves, F.A. (ed.). Ecologia das lagoas costeiras do Parque Nacional da Restinga de Jurubatiba e do Município de Macaé (RJ). NUPEM, UFRJ, Rio de Janeiro. Pp. 1-35 Viana, V.M. & Pinheiro, L.A.F.V. 1998. Conservação
da biodiversidade em fragmentos florestais. Série Técnica IPEF12: 25-42.
Zamith, L.R. & Scarano, F.R. 2006. Restoration of a restinga sandy coastal plain in Brazil: survival and growth of planted woody species. Restoration Ecology14: 87-94.