HESSD
2, 209–227, 2005Research on evaporation of Taiyuan basin area
X. Jin et al.
Title Page
Abstract Introduction
Conclusions References
Tables Figures
◭ ◮
◭ ◮
Back Close
Full Screen / Esc
Print Version
Interactive Discussion
EGU
Hydrol. Earth Syst. Sci. Discuss., 2, 209–227, 2005 www.copernicus.org/EGU/hess/hessd/2/209/ SRef-ID: 1812-2116/hessd/2005-2-209 European Geosciences Union
Hydrology and Earth System Sciences Discussions
Research on evaporation of Taiyuan basin
area by using remote sensing
X. Jin1, L. Wan1, and Z. Su2
1
School of Water Resources and Environment, China University of Geosciences, Beijing, China
2
International Institute for Geo-Information Science and Earth Observation (ITC), Enschede, The Netherlands
Received: 28 December 2004 – Accepted: 13 January 2005 – Published: 21 January 2005 Correspondence to: X. Jin ([email protected])
HESSD
2, 209–227, 2005Research on evaporation of Taiyuan basin area
X. Jin et al.
Title Page
Abstract Introduction
Conclusions References
Tables Figures
◭ ◮
◭ ◮
Back Close
Full Screen / Esc
Print Version
Interactive Discussion
EGU Abstract
Taiyuan basin is enclosed by hills and mountains, located in the middle of Shanxi province, standing between longitudes 111◦40′–113◦00′E and latitude 37◦00′–
38◦00′N. With various types and wide distribution, the mineral resources are very
abun-dant in this basin area. However, there is a great shortage of water resources. Due 5
to continual fall of groundwater level caused by excessive extraction of ground water, some severe environmental problems are induced in this area, such as ground sub-sidence, etc. The goal of this paper is to estimate the spatial distribution of actual evaporation over the basin by using remote sensing data.
The Surface Energy Balance System (SEBS) has been developed (Su, 2001, 2002). 10
Using visible and infrared satellite remote sensing data, SEBS is based on land surface energy balance theory combined with the in-situ meteorological data or the product of atmospheric numerical model to estimate land surface turbulent flux and the relative evaporation at different scales. SEBS was served as the core methodology of this paper and was used for evaporation estimation.
15
On the basis of hydro-geological data and NOAA satellite data, the SEBS was used in this paper for the estimation of actual evaporation of Taiyuan basin. The spatial distribution of the evaporative fraction and daily evaporation over the basin area was shown. On the other hand, the difference of land surface parameters and evaporation for various target types in the basin area was discussed.
20
1. Introduction
Evapotranspiration (ET) is a kind of very important energy in soil-vegetation-atmosphere system. As a key component in water resources management, it is es-sential to estimate ET accurately for water resources evaluation, drought monitoring and crop production simulation. To date, there have been a series of methods for ET 25
measure-HESSD
2, 209–227, 2005Research on evaporation of Taiyuan basin area
X. Jin et al.
Title Page
Abstract Introduction
Conclusions References
Tables Figures
◭ ◮
◭ ◮
Back Close
Full Screen / Esc
Print Version
Interactive Discussion
EGU
ments to estimate ET are only representative of local scales and can not be extended to large areas because of the heterogeneity of the land surface and the dynamic na-ture of the heat transfer process. Therefore, conventional techniques may not be able to effectively address the prescribed complexities, resulting in large inaccuracies.
Remote sensing is probably one of few techniques which can provide representa-5
tive measurements of several relevant physical parameters at scales from a point to a continent.
Methods using remote sensing information to estimate heat exchange between the land surface and atmosphere can be broadly put into two categories: to calculate the sensible heat flux first and then to obtain the latent heat flux as the residual of the 10
energy balance equation, or to estimate the relative evaporation by means of an index using a combination equation (Menenti, 1984; Bastiaanssen, 1995; Su and Menenti, 1999). Classical remote sensing flux algorithms based on surface temperature mea-surements in combination with spatially constant surface meteorological parameters may be suitable for assessing the surface fluxes on a small scale, but they will fail for 15
larger constant, the surface geometrical and thermal conditions are not homogenous and constant any more.
A Surface Energy Balance System (SEBS) for the estimation of atmosphere turbulent fluxes and surface evaporation using satellite earth observation data in the visible, near infra-red, and thermal infrared frequency range (Su, 2001) have been designed for 20
composite terrain at a larger scale with heterogeneous surface. Being applied to some case studies in China, it has been shown that SEBS is one of the most logical and precise methods in ET estimation at present.
HESSD
2, 209–227, 2005Research on evaporation of Taiyuan basin area
X. Jin et al.
Title Page
Abstract Introduction
Conclusions References
Tables Figures
◭ ◮
◭ ◮
Back Close
Full Screen / Esc
Print Version
Interactive Discussion
EGU 2. Study area
Taiyuan basin, surrounded by hills and mountains, is located in the middle of Shanxi province, China, with longitude/latitude between 111◦30′–113◦00′E and 37◦00′–
38◦20′N. The alluvial plain lies in middle of the basin composed of large areas of
croplands. The strip-shaped loess mesa distributes around the basin with different 5
width. The Fenhe River flows through all the basin area. Due to the latitude and ter-rain, the climate is semi-arid and the average annual precipitation is between 433 mm and 528 mm.
3. Method
Using visible and infrared satellite remote sensing data, SEBS is based on land surface 10
energy balance theory combined with the in-situ meteorological data or the product of atmospheric numerical model to estimate land surface turbulent flux and the relative evaporation at different scales.
The relative evaporation can be estimated from SEBS in following four steps: the retrieval of land surface parameters; the computation of fraction wind velocity, sensible 15
heat flux and stability length; the estimation of momentum and heat transfer roughness; the computation of relative evaporation.
The Surface Energy Balance is commonly written as
Rn=Go+H+λE, (1)
whereRnis the net radiation,G0is the soil heat flux,H is the sensible heat flux, andλE
20
is the latent heat flux. On the basis of energy balance and energy partitioning under dry and wet limit conditions, SEBS estimates the evaporative fraction (E F) as
E F =1−
H −Hwet Hdry−Hwet
HESSD
2, 209–227, 2005Research on evaporation of Taiyuan basin area
X. Jin et al.
Title Page
Abstract Introduction
Conclusions References
Tables Figures
◭ ◮
◭ ◮
Back Close
Full Screen / Esc
Print Version
Interactive Discussion
EGU
and the daily evaporationEdailyis expressed as
Edaily=8.64×107× 24
Λ
0 ×
Rn−G0 λρw
, (3)
whereHdry is the sensible heat flux at the dry limit,Hwetis the sensible heat flux at the
wet limit,24Λ
0
is the daily evaporative fraction,ρw is the density of water.
Land surface parameters used in this method are albedo, NDVI and surface tem-5
perature which were derived from NOAA-AVHRR data in visible, infrared and thermal infrared spectral domain respectively. The meteorological variables were obtained by interpolating observations collected in the meteorological stations over the concerned area.
Evaporative fraction and daily evaporation were finally calculated by using Eqs. (2) 10
and (3) and the data described above.
4. Datasets
The daily NOAA/AVHRR data in July were obtained from NOAA Satellite Active Archive (SAA) Pathfinder. The NOAA images were projected to Transverse Mercator Projection in order to be consistent with the projection of the Taiyuan Basin maps used in China. 15
The daily ground meteorological data were obtained from 51 meteorological stations within or around the Taiyuan Basin, including surface pressure, air temperature, dew-point air temperature, wind speed, wind direction and surface visibility (July, 2003).
The data pre-processing includes two components: satellite remote sensing data and ground meteorological data.
20
4.1. Satellite data processing
HESSD
2, 209–227, 2005Research on evaporation of Taiyuan basin area
X. Jin et al.
Title Page
Abstract Introduction
Conclusions References
Tables Figures
◭ ◮
◭ ◮
Back Close
Full Screen / Esc
Print Version
Interactive Discussion
EGU
4.1.1. Radiation calibration
The NOAA/AVHRR 1b data were converted into planetary reflectance in channel 1 and 2 and Kelvin brightness temperature in channel 3, 4, 5.
4.1.2. Geometry calibration
The pixel geographic location, solar and satellite zenith angles can be derived from 5
AVHRR 1b data.
4.2. Meteorological data processing
The meteorological data need to be interpolated and converted to match the satellite data before they are imported into SEBS.
4.2.1. Data interpolation 10
The large amount of ground measured meteorological data are required to compute the regional relative evaporation in SEBS. The ground-measured data will be interpo-lated into image format which are consistent with the corresponding satellite pixels in geographic coordinate. In this project, the ground measured meteorological data are interpolated with a Distance Weighing algorithm.
15
4.2.2. Data conversion
The most meteorological parameters needed in the calculation are not direct measur-ables, instead they are calculated or converted from the measured parameters. There-fore, the data conversion is a key pre-process. The detailed schemes are shown as below:
HESSD
2, 209–227, 2005Research on evaporation of Taiyuan basin area
X. Jin et al.
Title Page
Abstract Introduction
Conclusions References
Tables Figures
◭ ◮
◭ ◮
Back Close
Full Screen / Esc
Print Version
Interactive Discussion
EGU
Surface air pressure:
Ps =P0
1− al t 44331
(1/0.1903)
(Pa), (4)
whereP0is the sea level air pressure,al tis the altitude of observation sites.
Saturation vapor pressure:
es =611 exp
17.502
×Ta
240.97+Ta
(Pa), (5)
5
whereTais air temperature measured in near surface layer.
Actual vapor pressure:
e=611 exp
17.502
×T d ewpt 240.97+T d ewpt
(Pa), (6)
whereT d ewptis the measured dew-point temperature in near surface layer. Specific humidity:
10
q=(Rd/Rv)×e/Ps (kg/kg), (7)
whereRd,Rv are the gas constants for the dry air and water vapor air. Potential temperature in near surface layer:
θa=Ta
P
s
P0
−0.286
(K). (8)
Virtual potential temperature in near surface layer: 15
θv =Ta×(1+0.61×q)×
P
s
P0
−0.286
HESSD
2, 209–227, 2005Research on evaporation of Taiyuan basin area
X. Jin et al.
Title Page
Abstract Introduction
Conclusions References
Tables Figures
◭ ◮
◭ ◮
Back Close
Full Screen / Esc
Print Version
Interactive Discussion
EGU
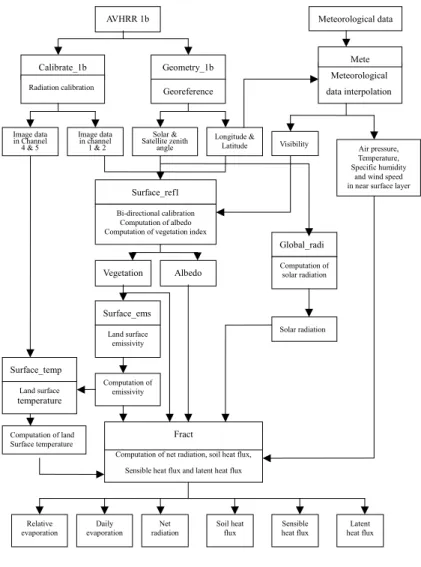
4.3. Computational process
The computation consists of three parts, which are the data pre-processing, land sur-face parameter retrieval and the computation of relative evaporation (Lu and Su, 2002). The whole process are divided into eight steps as given in the following flowchart (Fig. 1).
5
5. Results and discussions
A case study was carried out using NOAA-AVHRR data on 4 July 2003. Taiyuan basin has a large range of NDVI and surface temperature distribution with peak values around 0.2 and 40◦. Accordingly, the evaporation over the basin shows relatively large range
but it apparently has two dominated categories: higher values ofE F (>0.5) andEdaily
10
(>4.2 mm) corresponds to the croplands area, while lower values ofE F andEdaily are
related to the loess area with much less vegetation covering. During the crop growth season, the higher evaporation from the croplands attributes to the irrigation. On the contrary, with relatively less precipitation, the loess area shows the natural climate characteristics of semiarid region.
15
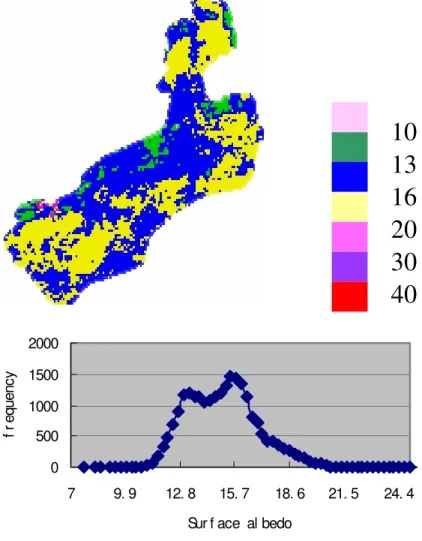
5.1. Albedo
From the regional distribution of surface albedo (Fig. 2a) over the study area on 4 July 2003, albedo, expressed in percentage, goes from 7.7 to 25.0 over the study area. Low values are found at city areas – Taiyuan city for instance, whiles high values are distributed at north and south mountainous area, loess mesa around the basin. Albedo 20
ranges between 10 and 16 in the alluvial plain, the mountainous area and loess mesa around the basin has albedo of 16 to 20.
HESSD
2, 209–227, 2005Research on evaporation of Taiyuan basin area
X. Jin et al.
Title Page
Abstract Introduction
Conclusions References
Tables Figures
◭ ◮
◭ ◮
Back Close
Full Screen / Esc
Print Version
Interactive Discussion
EGU
study area, approximating to 16, concentrating in the mountainous area and loess mesa. The mean value of the surface albedo is 15.34 with a standard deviation of 5.56.
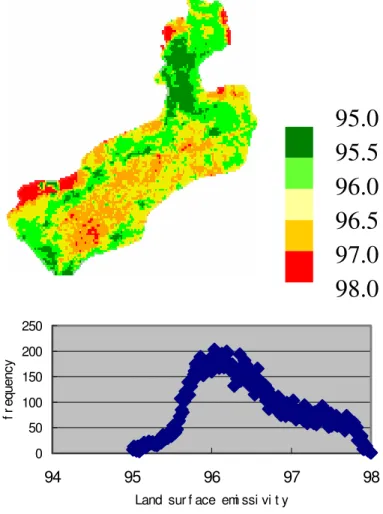
5.2. Emissivity
The present emissivity images (Fig. 3a) are also in percent unit. It appears to be 95 to 5
95.5 (green) in the city areas, 95.5 to 96 in mountainous area and 96 to 96.5 in loess mesa area. High emissivity occurs at alluvial plain, with the value of 96.5 to 97.
The histogram of land surface emissivity (Fig. 3b) presents one peak in the study area, which is around 96, occurring in the loess mesa area. The mean surface emis-sivity is 96.45 with a standard deviation of 0.64.
10
5.3. NDVI
The NDVI value has also been defined in percentage in this case (Fig. 4a). It should be mentioned that for the convenience of calculation, NDVI has been set to 0 for a water body although in principle it should be negative. Mountainous bare soil area and loess mesa around the basin are shown in reddish color, with value of 0 to 20, whereas in 15
the alluvial plain, NDVI is generally between 20 and 40, locally reaching 45.
One peak value occurs in the histogram of NDVI (Fig. 4b) over the study area, which is around 20% NDVI unit, concentrating in the bare soil and loess mesa area. The mean value of NDVI is 27.14 with a standard deviation of 13.40.
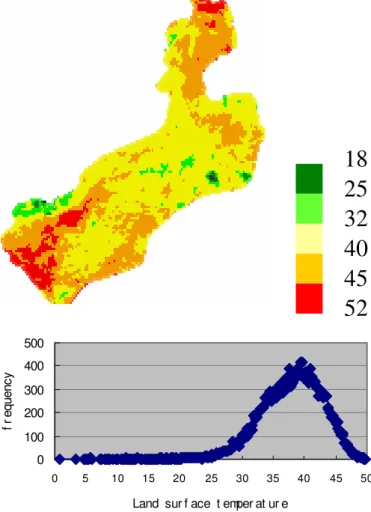
5.4. Land surface temperature 20
Land surface temperature ranges between 0◦and 52◦due to the variety of land surface
type (Fig. 5a). Hot and dry bare soil is presented in reddish color, with the highest value of 52◦. The city areas and loess mesa area around the basin show high temperatures,
ranging from 40◦and 50◦. The alluvial plain covered by crop land is shown in light tones
of yellow, with the value of 32◦ to 40◦.
HESSD
2, 209–227, 2005Research on evaporation of Taiyuan basin area
X. Jin et al.
Title Page
Abstract Introduction
Conclusions References
Tables Figures
◭ ◮
◭ ◮
Back Close
Full Screen / Esc
Print Version
Interactive Discussion
EGU
The histogram of surface temperature (Fig. 5b) has one peak in 40◦, which
corre-sponded to loess mesa area. The mean value of the temperature is 39.98◦ with a
standard deviation of 5.10◦.
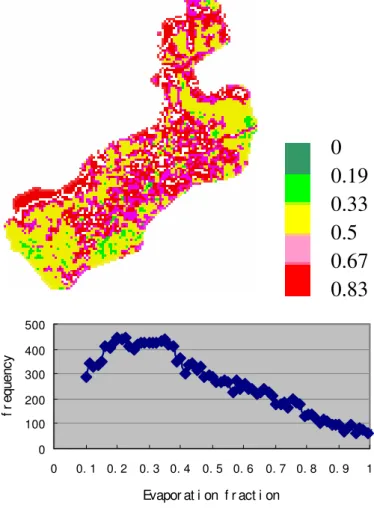
5.5. Evaporative fraction and daily evaporation
The images and histograms of the calculated evaporation are shown in Fig. 6a. The 5
evaporative fraction is confined between 0 and 1. The highest values of 0.67 to 0.83 are shown in centre of the basin covered by crop land. Wet condition provides the poten-tiality for the strong evaporation. Values of 0.5 to 0.67 are found in north mountainous areas. A low evaporation fraction, ranging between 0.19 and 0.33, is distributed in the loess area. The histogram of evaporative fraction (Fig. 6b) has two peaks in the study 10
area, which are around 0.2 and 0.35. The mean value is 0.43 with a standard deviation of 0.33.
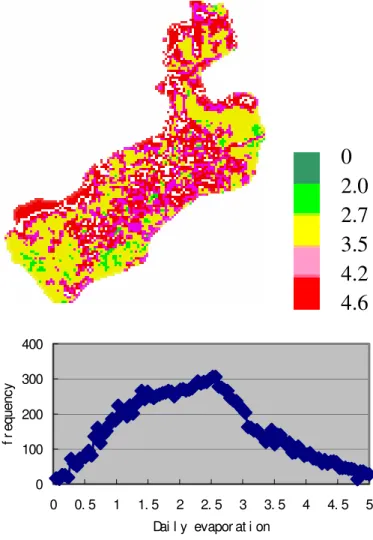
Daily evaporation (Fig. 7a) can generally match that of evaporative fraction. Low evaporation, 2 mm/d to 3.5 mm/d, is found in the loess area around the basin. The high evaporation, varying from 4.2 mm/d to 4.6 mm/d, is in the centre of the basin. The 15
distribution reflects that wet conditions give more evaporation than dry conditions in spite of the high temperature in loess area. The histogram of daily evaporation (Fig. 7b) has one peak at 2.7 mm/d, the mean value of the daily evaporation is 3.2 mm/d with a standard deviation of 1.26.
6. Conclusions
20
SEBS has proven to be a useful tool for evaporative estimation. This study shows that the distribution character of evaporative fraction and daily evaporation is in ac-cordance with vegetation coverage in Taiyuan basin area. High evaporation matches higher NDVI, whereas low evaporation corresponds to bare loess soil with much less vegetation covering.
HESSD
2, 209–227, 2005Research on evaporation of Taiyuan basin area
X. Jin et al.
Title Page
Abstract Introduction
Conclusions References
Tables Figures
◭ ◮
◭ ◮
Back Close
Full Screen / Esc
Print Version
Interactive Discussion
EGU
The second conclusion is that most of the vegetation in centre of the basin area is covered by croplands and during the crop growth season, the higher evaporation from the croplands attributes to the irrigation. For the loess area, with relatively less precipitation, it shows the natural climate characteristics of semiarid region.
Acknowledgements. This research was supported by the Project of Evaluation of Groundwater
5
and Environment for Shanxi Six Basins. The authors would like to express their thanks for the geological data of Shanxi Geological Institute.
We would like to thank F. Hu for discussions and suggestions and would like to acknowledge NASA for their NOAA satellite data, which were essential for the completion of this project.
References 10
Bastiaanssen, W. G. M. and Menenti, M.: Mapping groundwater losses in the western desert of Egypt with satellite measurements of surface reflectance and surface temperature, Water Management and Remote Sensing, J. C. Hooghat, The Hague, 61–90, 1990.
Bastiaanssen, W. G. M.: Regionalization of surface flux densities and moisture indicators in composite terrain – A remote sensing approach under clear skies in Mediterranean climates,
15
Ph.D. thesis, Wageningen Agricultural University, The Netherlands, 273, 1995.
Chen, J., J ¨onsson, P., Tamura, M., Gu, Z., Matsushita, B., and Eklundh, L.: A simple method for reconstructing a high-quality NDVI time-series data set based on the Savitzky-Golay filter, Remote Sensing of Environment, 91, 332–344, 2004.
Li, X. M.: Estimation of evaporation with remotely sensed data – A case study in Urumqi river
20
basin, Xinjiang Autonomous Region, China, M.Sc. thesis, IHE, Delft, The Netherlands, 82, 2001.
Lu, G. H., Zhang, J. J., and Su, Z.: A technique for large scale drought monitoring, Report of China National 94.8 Technique Import Project, 44, 2002.
Ma, Y. M.: Estimation of evapotranspiration of Heihe area with the aid of satellite remote
sens-25
ing and field observation, M.Sc. thesis, Lanzhou Institute for Plateau Atmospheric Physics, China Academy of Science, 77, 1995.
HESSD
2, 209–227, 2005Research on evaporation of Taiyuan basin area
X. Jin et al.
Title Page
Abstract Introduction
Conclusions References
Tables Figures
◭ ◮
◭ ◮
Back Close
Full Screen / Esc
Print Version
Interactive Discussion
EGU
location dependent potential evaporation and surface temperature range, Proc. Yokohama Symposium, IAHS Pbul, 212, 561–568, 1993.
Menenti, M.: Physical aspects and determination of evaporation in deserts applying remote sensing techniques. Institute for Land and Water Management Research (ICW), The Nether-lands, 202, 1998.
5
Ray, S. S. and Dadhwal, V. K.: Estimation of crop evapotranspiration of irrigation command area using remote sensing and GIS, Agricultural Water Management, 49, 239–249, 2001. Roerink, G. J., Su, Z., and Menenti, M.: S-SEBI: A simple remote sensing algorithm to estimate
the surface energy balance, Phys. Chem. Earth., 25, 147–157, 2000.
Shanxi Geological Survey Institute: Report on geological survey of six basins, Shanxi, China,
10
67, 2003.
Su, Z.: A Surface Energy Balance System (SEBS) for estimation of turbulent heat fluxes from point to continental scale, Advanced Earth Observation-Land surface Climate, Publications of the National Remote Sensing Board(BCRS), USP-2, 01-02, 183, 2001.
Su, Z., Menenti, M., Pelgrum, H., Herk, B. J. J. M., and Bastiaanseen, W. G. M.: Remote
15
sensing of land surface fluxes for updating numerical weather predictions, In Operational Remote Sensing for Sustainable Development, edited by Nieuwenhuis, G. J. A., Vaughan, R. A., Molenaar, M., Balkema, 393–402, 1998.
Su, Z.: The Surface Energy Balance System (SEBS) for estimation of turbulent heat fluxes, Hydrol. Earth Sys. Sc., 6, 85–89, 2002,
20
SRef-ID: 1607-7938/hess/2002-6-85.
Sun, R., Gao, X., Liu, C. M., and Li, X. W.: Evapotranspiration estimation in the Yellow River Basin, China using integrated NDVI data, Int. J. Rem. Sens., 25, 2523–2534, 2004.
Wang, J. M., Ma, Y. M., Menenti, M., Bastiaanssen, W. G. M., and Mitsuta, Y.: The scaling-up of processes in the heterogeneous landscape of HEIFE with the aid of satellite remote sensing,
25
HESSD
2, 209–227, 2005Research on evaporation of Taiyuan basin area
X. Jin et al.
Title Page Abstract Introduction Conclusions References Tables Figures ◭ ◮ ◭ ◮ Back Close
Full Screen / Esc
Print Version
Interactive Discussion
EGU
AVHRR 1b Meteorological data
Calibrate_1b Geometry_1b
Georeference
Radiation calibration
Image data in Channel 4 & 5
Image data in channel 1 & 2
Solar & Satellite zenith angle Longitude & Latitude Bi-directional calibration Computation of albedo Computation of vegetation index
Surface_ref1
Vegetation Albedo
Land surface emissivity Surface_ems Computation of emissivity Surface_temp Land surface temperature
Computation of land Surface temperature
Computation of net radiation, soil heat flux, Sensible heat flux and latent heat flux
Fract Relative evaporation Net radiation Sensible heat flux Latent heat flux Soil heat flux Meteorological data interpolation Mete Visibility Air pressure, Temperature, Specific humidity
and wind speed in near surface layer
Computation of solar radiation Global_radi Solar radiation Daily evaporation
HESSD
2, 209–227, 2005Research on evaporation of Taiyuan basin area
X. Jin et al.
Title Page
Abstract Introduction
Conclusions References
Tables Figures
◭ ◮
◭ ◮
Back Close
Full Screen / Esc
Print Version
Interactive Discussion
EGU
10
13
16
20
30
40
0 500 1000 1500 2000
7 9. 9 12. 8 15. 7 18. 6 21. 5 24. 4
Sur f ace al bedo
f
r
e
q
u
e
n
cy
HESSD
2, 209–227, 2005Research on evaporation of Taiyuan basin area
X. Jin et al.
Title Page
Abstract Introduction
Conclusions References
Tables Figures
◭ ◮
◭ ◮
Back Close
Full Screen / Esc
Print Version
Interactive Discussion
EGU
95.0
95.5
96.0
96.5
97.0
98.0
0 50 100 150 200 250
94 95 96 97 98
Land sur f ace emi ssi vi t y
f
r
e
q
u
e
n
cy
HESSD
2, 209–227, 2005Research on evaporation of Taiyuan basin area
X. Jin et al.
Title Page
Abstract Introduction
Conclusions References
Tables Figures
◭ ◮
◭ ◮
Back Close
Full Screen / Esc
Print Version
Interactive Discussion
EGU
20
30
40
50
60
0 50 100 150 200 250
0 20 40 60 80
NDVI
f
r
e
q
u
e
n
c
y
HESSD
2, 209–227, 2005Research on evaporation of Taiyuan basin area
X. Jin et al.
Title Page
Abstract Introduction
Conclusions References
Tables Figures
◭ ◮
◭ ◮
Back Close
Full Screen / Esc
Print Version
Interactive Discussion
EGU
18
25
32
40
45
52
0 100 200 300 400 500
0 5 10 15 20 25 30 35 40 45 50
Land sur f ace t emper at ur e
f
r
e
q
u
e
n
c
y
HESSD
2, 209–227, 2005Research on evaporation of Taiyuan basin area
X. Jin et al.
Title Page
Abstract Introduction
Conclusions References
Tables Figures
◭ ◮
◭ ◮
Back Close
Full Screen / Esc
Print Version
Interactive Discussion
EGU
0
0.19
0.33
0.5
0.67
0.83
0 100 200 300 400 500
0 0. 1 0. 2 0. 3 0. 4 0. 5 0. 6 0. 7 0. 8 0. 9 1
Evapor at i on f r act i on
f
r
e
q
u
e
n
cy
HESSD
2, 209–227, 2005Research on evaporation of Taiyuan basin area
X. Jin et al.
Title Page
Abstract Introduction
Conclusions References
Tables Figures
◭ ◮
◭ ◮
Back Close
Full Screen / Esc
Print Version
Interactive Discussion
EGU
0
2.0
2.7
3.5
4.2
4.6
0 100 200 300 400
0 0. 5 1 1. 5 2 2. 5 3 3. 5 4 4. 5 5
Dai l y evapor at i on
f
r
e
q
u
e
n
cy