Comparison of different vegetation indices for very high-resolution images, specific case
UltraCam-D imagery
Maryam Barzegar*a, Hamid Ebadib, Abbas Kianic
a* Corresponding author, BSc student, K. N. Toosi University of Technology, Tehran, Iran - [email protected]; b Associate professor of Geodesy and Geomatics Eng. faculty, K. N. Toosi University of Technology, Tehran, Iran-
c PhD Candidate Geodesy and Geomatics Eng. faculty, K.N.Toosi University of Technology,Tehran,
KEY WORDS: Vegetation indices, High-resolution images, UltraCam, DVI
ABSTRACT
Today digital aerial images acquired with UltraCam sensor are known to be a valuable resource for producing high resolution information of land covers. In this research, different methods for extracting vegetation from semi-urban and agricultural regions were studied and their results were compared in terms of overall accuracy and Kappa statistic. To do this, several vegetation indices were first tested on three image datasets with different object-based classifications in terms of presence or absence of sample data, defining other features and also more classes. The effects of all these cases were evaluated on final results. After it, pixe l-based classification was performed on each dataset and their accuracies were compared to optimum object-based classification. The importance of this research is to test different indices in several cases (about 75 cases) and to find the quantitative and q ualitative effects of increasing or decreasing auxiliary data. This way, researchers who intent to work with such high resolution data are given an insight on the whole procedure of detecting vegetation species as one of the outstanding and common features from such images. Results showed that DVI index can better detect vegetation regions in test images. Also, the object-based classification with average 93.6% overall accuracy and 86.5% Kappa was more suitable for extracting vegetation rather than the pixel-based classification with average 81.2% overall accuracy and 59.7% Kappa.
1. INTRODUCTION
Vegetation is counted as one of the most important components of each ecosystem. Determining vegetation regions is crucial to understand the interactions between earth and atmosphere, its effects on climate, soil erosion and drought, and for natural resource management. Now, photogrammetry and remote sensing are one of the most important technologies to acquire and/or produce such information. Nowadays, digital aerial images taken with advanced UltraCam sensor are used extensively in our country and are known to be a valuable resource to produce high resolution land cover information.
Image processing techniques are categorized in two broad classes. The first ones, are those in which their processing unit is a single pixel. These techniques are called pixel-based and are highly used for extracting descriptive information. In cases where the region under study has the same size with image pixel, pixel-based methods can achieve acceptable results (Blaschke, 2010). Therefore, these methods can perform properly on low or mid resolution images (Wei, 2009). In recent years, with the advent of high resolution images, limitations of pixel-based methods are gradually revealed. Despite spectral features, additional information such as texture, geometry and shape indices can be extracted from high resolution images with low and mid-level processes. Because of low variation in spectral information of high resolution images, using only spectral features can make some problems in high level processes. As an example, for urban applications of such images, objects like buildings
and roads might contain a number of pixels. So, using a single pixel instead of a group of pixels may lead to errors in final results. Some researchers have reported the pepper-salt noise in results of implementing pixel-based methods on high resolution images (Liu, 2008; Pu, 2011). Also, results of such methods are not matched well with reality.
The second class of image processing techniques are object-based. The application of such methods holds back to 70s (Yan, 2006). Here, processing unit is a homogenous group of pixels (as image object) and the image is processed in object space instead of pixel space. In such methods, the image is first segmented and then classified. Each segment is known as a meaningful object. These methods have some advantages over pixel-based methods including: 1- Because of using objects instead of single pixels, all aspects of remote sensing field such as spectral and spatial information, morphological and structural information, context information and also temporal information can be involved. 2- These methods can use geospatial information systems as an auxiliary data, distance criteria etc. 3- Objects can be formed in different sizes and in multi-scale levels of the image. So, one can first remove the unwanted additional objects in a bigger scale and then focus on extracting desirable objects. Moreover, to create image objects in different levels, parent-child relationships can be used to improve the process of detecting and extracting objects for change detection applications (Navulur, 2006).
There are many researches in literature for extracting vegetation in urban areas. Li and Shao (2014) produced land
cover maps of west America using object-oriented classification and multi-scale segmentation of high resolution aerial images. They used NDVI to extract vegetation. Several other studies have been dedicated to compare different vegetation indices. Barati et al. (2011) evaluated different vegetation indices on IRS-LISIII image and found that DVI was the best index for the region. Also, many researches have compared pixel-based and object-oriented classifications. Myint et al. (2011) extracted vegetation from Quickbird image using both classifiers. Results showed that object-oriented classification could achieve 93.03% overall accuracy and 91.81% Kappa while pixel-based classifier got 80% and 76.31% respectively. They reported the lowest accuracy of extracting vegetation and soil classes due to their mix with other classes.
In this research, after studying recent methods with their results and their pros and cones, several cases (about 75 ones) were designed to compare quantitative and qualitative effects of increasing or decreasing auxiliary data. These cases evaluate the presence or absence of sample data, different vegetation indices (10 indices), using other features (redness, coloration, hue, saturation, brightness and NDWI), defining other classes (soil, artificial objects, shadow etc.), imaging conditions, whether to use near infrared bands or not (i.e. only RGB bands), all to find the optimum object-based classification and vegetation index for Ultracam images. Also, object-based and pixel-based classifications were compared to each other.
2. MATERIALS AND METHODS
2.1. Data
Test images used in this study cover two different climates. The first study region is a part of Alborz area in Mazandaran, Bandar-Anzali and the second region is in Tehran, Damavand and near Absard region.
Both datasets are images form UltraCam D with 8 cm ground pixel size. One image from the first region (image 1) and two images from the second region acquired in two flight lines (images 2 & 3) are used to study different imaging situations. Ground truth map was provided visually based on archived information.
2.2. Segmentation
Segmentation refers to dividing image into uniform non-overlapped conceptual regions which are named image objects or image segments. In other words, a group of neighborhood pixels with a similar property such as gray level, texture, shape and scale is called an image object.
In this research, multi-resolution segmentation is used. This method can use texture, shape, size, spectral and spatial characteristics, and previous information. It is able to extract objects with different sizes and weighting parameters like color, size, shape etc. In this segmentation, image objects are given weights according to their pixel size and the average heterogeneity of two adjacent objects is quantified based on
“degree of fitting” criteria (Eq. 1).
ℎ ���= ∑ � � ℎ� − ℎ + � ℎ� − ℎ (1)
Where c= number of channels
�& � = size of adjacent objects � = weight of each channel
If the “degree of fitting” for adjacent objects is lower than the defined “least degree of fitting” the objects are merged
together (Baatz and Schape, 2000).
2.3. Classification
To perform the object-oriented classification, nearest neighbor method is used. In this approach, a group of n-pairs {(x1, Ɵ1), …, (xn, Ɵn)} is defined where X stands for image
object and Ɵ stands for class. The nearest neighborhood rule
studies the following equation (Eq. 2):
min d xi, x = d x′n, x (2)
Where x’n{x1, x2, …, xn}, i= 1,2,…,n.
If the above equation is satisfied, then x is related to class
Ɵ’n which contains x’n objects (Cover and Hart, 1967).
3. THE PROPOSED METHOD
Different methods for vegetation extraction (pixel-based and object-based) where studied in semi-urban and agricultural regions. Fig. 1 describes the flowchart of object-based classification
.
To find the optimum vegetation index, 10 different vegetation indices (Table 1) were studied according to the flowchart illustrated at Fig. 1. Then using this index (DVI) other cases of object-oriented classification were evaluated. These cases include the following 4 ones:
1. Defining vegetation class + vegetation index
2. Defining vegetation class + vegetation index + other classes (water, soil etc.)
3. Defining vegetation class + vegetation index + other classes (water, soil etc.) + other features (Table 2)
4. Defining vegetation class + vegetation index + other classes (water, soil etc.) + other features + sampling
In this investigation, only BI and NDWI features improved the classification result and because they had same results, NDWI feature was used to study other cases. All object-based classifications were performed by eCognition 8.7.2. After this, pixel-based classification was carried out for the three test images and the results were compared to optimum object-based classification in terms of overall accuracy and Kappa. The next section discusses these results.
4. RESULTS AND SUGGESTIONS
and its results were compared to optimum object-based classification (Table 5).
Fig. 2 illustrates result of optimum OBC, ground truth image and pixel based classification for image 1, fig. 3 for image 2 and fig. 4 for image 3.
Fig 1. General process of object-based classification ( : The process of finding optimum vegetation index, : The process
was done for different cases of object-based classification after finding optimum vegetation index, :common procedures in both of the processes.)
���+�
DVI ���−� (Tucker, 1980)
SAVI
(1+L)* [(NIR – red) / (NIR + red + L)]
Where L = 0.5
(Huete, 1988)
GARI NIR NIR [green – [green –– (blue (blue –– red)] red)] / (Gitelson et al, 1996)
GNDVI (NIR – green) / (NIR + green)
(Buschmann and Nagel, 1993)
Cl (NIR/G) -1 (Vescovo and Gianelle, 2008)
RDVI ���� ∗ ���
= ��� − �
√��� + �
(Roujean and Breon, 1995)
EGI ∗ ( �
� + � + �) − (Wobbecke et al, 1995)
DGR � − �
� + � + � (Wobbecke et al, 1995)
NDI � − �
� + � (Bargen et al, 1995)
Table 1. Vegetation indexes investigated in test images
Brightness Index, BI
� + � + � ⁄ .5 (Mathieu et
al, 1998)
Saturation Index, SI
� − � ⁄� + � (Mathieu et
al, 1998)
Hue Index, HI
∗ � − � − �⁄� − � (Mathieu et
al, 1998)
Coloration Index, CI
� − � ⁄� + � (Mathieu et
al, 1998)
Redness Index, RI
�⁄� ∗ � (Mathieu et
al, 1998)
NDWI � − ���⁄� + ��� (Gao, 1996)
Table 2. features used in classification
SAVI GNDVI GARI RDVI NDVI cl DVI NDI DGR EGI Index 80.0219 83.2452 70.9069 82.8809 79.9260 73.5382 91.1715 65.8669 65.7028 69.7244 Overall accuracy(%) Image 1 48.8896 59.5216 19.7987 57.1617 50 30.2592 80.0359 1.7613 1.2008 16.6413 Kappa(%) 92.8410 79.0827 88.0490 96.6923 93.2461 87.8429 98.4168 50.2118 49.9574 50.3200 Overall accuracy(%) Image 2 85.6887 58.3703 76.1493 93.3797 86.5063 75.7426 96.8318 1.6467 1.1639 1.8771 Kappa(%) 80.3779 60.5503 86.7387 95.8819 72.8516 57.1921 88.2388 52.6118 45.9290 41.8607 Overall accuracy(%) Image 3 62.0253 29.1314 73.6981 91.3708 48.9497 23.9870 74.5165 16.3555 7.6846 2.0993 Kappa(%)
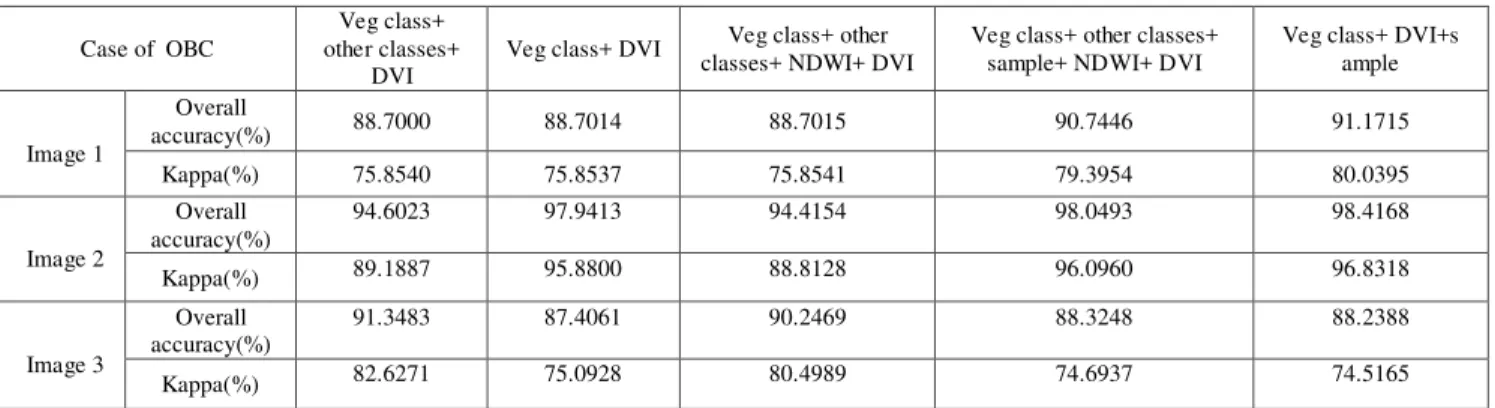
Table 3. Results of different cases of object oriented classification for test images
Case of OBC
Veg class+ other classes+
DVI
Veg class+ DVI Veg class+ other classes+ NDWI+ DVI
Veg class+ other classes+ sample+ NDWI+ DVI
Veg class+ DVI+s ample
Image 1
Overall
accuracy(%) 88.7000 88.7014 88.7015 90.7446 91.1715
Kappa(%) 75.8540 75.8537 75.8541 79.3954 80.0395
Image 2
Overall accuracy(%)
94.6023 97.9413 94.4154 98.0493 98.4168
Kappa(%) 89.1887 95.8800 88.8128 96.0960 96.8318
Image 3
Overall accuracy(%)
91.3483 87.4061 90.2469 88.3248 88.2388
Kappa(%) 82.6271 75.0928 80.4989 74.6937 74.5165
Method of classification Optimum case of object based Pixel based
Image 1 Overall accuracy(%) 91.1715 77.3715
Kappa(%) 80.0395 47.6401
Image 2 Overall accuracy(%) 98.4168 84.3317
Kappa(%) 96.8318 68.7228
Image 3 Overall accuracy(%) 91.3483 81.8484
Kappa(%) 82.6271 62.6401
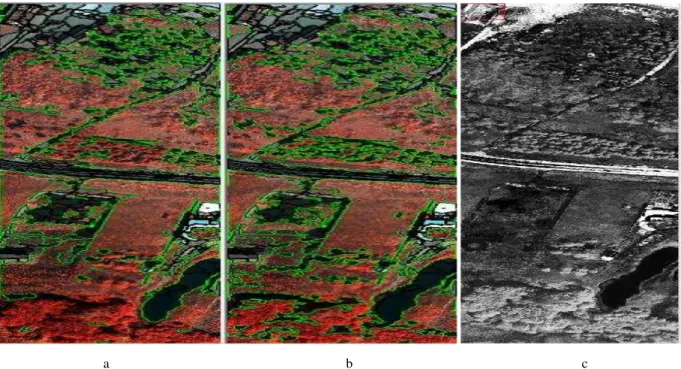
a b c
Fig 2. Results for parts of image 1(NIR band instead of Red band), a) optimum OBC (green edges are boundaries of vegetation (merged)), b) ground truth image, c) pixel based classification
a b
c
Fig 3. Results for image 2 (NIR band instead of Red band), a) optimum OBC (green edges are boundaries of vegetation (merged)), b) ground truth image, c) pixel based classification
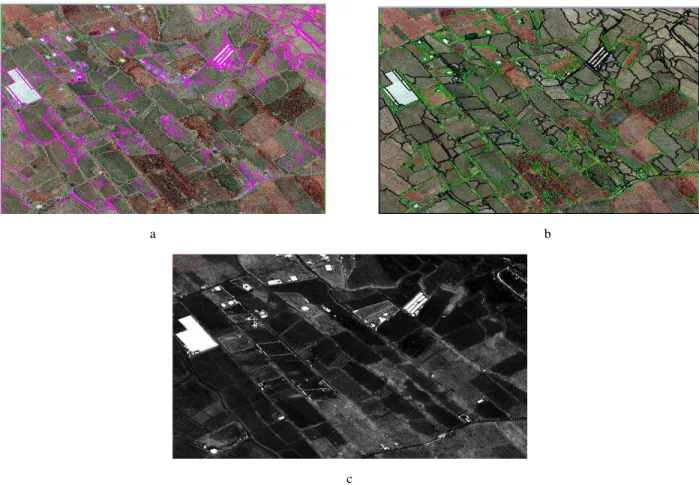
a b
c
Fig 4. Results for image 3 (NIR band instead of Red band), a) optimum OBC (green edges are boundaries of vegetation (merged), pink edges are boundaries of soil), b) ground truth image, c) pixel based classification
Using different vegetation indices in object-based classification along with sampling implies that DVI and RDVI lead to best results in terms of overall accuracy and Kappa. Because Kappa of RDVI is not proper on the image 2, DVI is selected as the optimum vegetation index with 92.6% overall accuracy and 83.8% Kappa. DVI is less affected by background spectra (Roujean and Breon, 1995). Furthermore, although NDVI is a proper index for extracting vegetation, its relation with vegetation amount is non-linear
(Fig. 2) and doesn’t perform well in shrub and grassland
classes (Montandon and Small, 2008). These prove that
DVI’s performance is better for vegetation extraction
compared to NDVI.
Fig 2. Calculated variation for vegetation indices as a function of fractional vegetation cover (Jones and
Vaughan, 2010)
Indices which use only ratios of visible bands had lower accuracy than those with NIR band. For instance, DVI and RDVI which use NIR band had average overall accuracy of 92% and 91% respectively on the three test images while NDI and DGR which use only visible bands had overall accuracy of 55% and 53% respectively. As a result of this considerable difference, it is suggested to use indices with NIR bands for vegetation extraction
.
In all test images, object-based approach gives better results than pixel-based approach and its outputs are visually more interpretable and better understood. Results showed that the object-based classification with average 93.6% overall accuracy and 86.5% Kappa was better for vegetation extraction than the pixel-based classification with average 81.2% overall accuracy and 89.7% Kappa. The high difference between overall accuracy and Kappa in pixel-based method illustrates its low accuracy and the effects of omission and commission errors which have decreased Kappa considerably
.
feature is first applied to the building class. Therefore, extracted features form an image may lead to good results only if a specific order of actions is taken. When this order changes, features seem to be unsuitable for the purpose.
All tested cases with DVI showed that if samples are used, results will improve. The amount of this difference in all images is approximately 2% for overall accuracy and 6% for Kappa which is negligible. In practice, sampling is done only when a high accuracy is required
.
Definition of other classes decreased the overall accuracy in image 1 & 2 but increased it 4% in the image 3. So, to use this case or not depends on the image itself. The image 1 & 2 had denser vegetation and higher reflectance in NIR band in comparison to the image 3 These differences makes the definition of other classes to be effect less in these images because vegetation segments are well segmented due to the higher weight of NIR band and less combination with the covers like soil which degrades the accuracy in most images.
Definition of other features like NDWI increased the accuracy in image 1 & 2 (2% and 4% overall accuracy increase, and Kappa increase of 4% and 7% respectively when using samples) while decreased the accuracy in the image 3. So to use this case or not depends also to the image itself. Image 1 has numerous water basins and because NDWI improves results of images with highly water contained vegetation and water decreases reflectance in NIR band, using this index improves the results of this image.
5. CONCLUSION
Vegetation is counted as one of the most important component in each ecosystem. Performance of indices on images of different sensors are not same and there is no optimum index for all images. Also different extraction methods leads to different results. To study this matter on high resolution images different vegetation indices were tested on UltraCam images and their overall accuracy and Kappa were calculated and compared to each other. In addition, various vegetation extraction methods including pixel-based and object-oriented were studied in semi-urban and agricultural regions. Next, different cases of object-oriented classification (presence or absence of sample data, using other features such as NDWI, Brightness etc. and definition of other classes like water, soil and others.) and pixel-based classification were evaluated and compared. After all these, it is concluded that among different indices, DVI leads to better results for extracting vegetation in test images. The reason for this is that DVI is less sensitive to background spectra, has linear relation with vegetation amount and better preforms in areas with low vegetation. Moreover, results showed that object-oriented classification with 93.6% overall accuracy and 86.5% Kappa could better extract vegetation in test images and got more real results in comparison to pixel-based classification with 81.2% overall accuracy and 59.7% Kappa.
REFERENCES
Baatz, M., Schape, A., 2000. Multiresolution segmentation: an optimization approach for high quality multi-scale image segmentation, In: Strobl, J., et al.(Eds.): Angewandte Geographische Informationsverarbeitung, Vol. XII, Karlsruhhe:Herbert Wichman, pp. 12-23.
Barati, S., Raiegani, B., Saati, M., Sharifi, A., Nasri, M., 2011. Comparison the accuracies of different spectral indices for estimation of vegetation cover fraction sparse vegetated areas. The Egyptian Journal of Remote Sensing and Space Sciences 14, pp. 49-56.
Bargen V.K. Mortensen D. A. Woebbecke D. M., Meyer G. E, 1995. Color indices for weed identi_cation under various soil, residue, and lighting conditions. Transactions of the ASAE 38, pp. 259-269.
Blaschke, T., 2010. Object Based Image Analysis for Remote Sensing. ISPRS Journal of Photogrammetry and Remote Sensing65, pp. 2-16.
Buschmann, C., Nagel, E., 1993. In vivo spectroscopy and internal optics of leaves as basis for remote sensing of vegetation .Int. J.Remote Sens 14(4),pp.711-722..(4) Cover, T.M., Hart, P.E., 1967. Nearest neighbor pattern classification. IEE transcations on information theory, vol. IT-13, No. 1.
Gao, B. C. 1996. NDWI - A normalized difference water index for remote sensing of vegetation liquid water from space. Remote Sensing of Environment 58, pp. 257-266.
Gitelson, A. A., Kaufman, Y.J., Merzlyak, M.N., 1996. Use of a green channel in remote sensing of global vegetation from EOS-MODIS. Remote Sensing of Environment 58, pp. 289–298.
Huete, A. R., 1988, A soil adjusted vegetation index SAVI. Remote Sensing of Environment 25, pp. 295–309.
Jones, H.G., Vaughan, R.A., 2010. Remote sensing of vegetation: principles, techniques, and applications. pp. 173.
Li, X., Shao, G., 2014, Object-based land-cover mapping with high resolution aerial photography at a county scale in midwestern USA, Remote Sens 6, pp. 11372-11390.
Liu, S., Du, P. , 2008. Object-Oriented Change Detection from Multi-Temporal Remotely Sensed Images. The International Archieve of the Photogrammetry, Remote Sensing and Spatial Information Sciences XXXVIII, part 4/C7.
Mathieu, R., M. Pouget, B. Cervelle, and R. Escadafal, 1998. Relationships between satellite-based radiometric indices simulated using laboratory reflectance data and typical soil color of an arid environment, Remote Sens. Environ 66, pp. 17– 28.
Montandon, L.M., Small, E.E., 2008. The impact of soil reflectance onthe quantification of the green vegetation
fraction from NDVI.Remote Sensing of Environment 112, 1835–1845.
Myint, S.W., Gober, P., Brazel, A., Grossman-Clarke, S., Weng, Q., 2011. Per-pixel vs. object-based classification of urban land cover extraction using high spatial resolution imagery, Remote Sensing of Environment 115, pp. 1145-1161.
Navulur, K., 2006, Multispectral Image Analysis Using the Object-Oriented Paradigm. Taylor & Francis Group.
Pu, R., Landry, S., Yu, Q., 2011. Object-Based Landscape Analysis. International Journal of Remote Sensing 32:12 , pp. 3285-3308.
Roujean, J.L, Breon, F.M, 1995. Estimating PAR absorbed by vegetation from bidirectional reflectance measurements. Remote Sense. Environ. 51, pp. 375- 384.
Rouse, J. W., Haas, R.H., Schell, J.A., Deering, D.W. 1973. Monitoring vegetation systems in the Great Plains with ERTS. In: Third ERTS Symposium. NASA, pp. 309-317
Tucker, C.J. 1979. Red and photographic infrared linear combinations formonitoring vegetation. Remote Sensing of Environment 8: 127–150.
Vescovo, L., Gianelle, D., 2008. Using the MIR bands in vegetation indices for the estimation of grassland
biophysical parameters from satellite remote sensing in the Alps region of Trentino (Italy). Advances in Space Research 41, pp. 1764–1772.
Wei, L., Li, P., Zhong, Y. 2009. An Advanced Change Detection Methode Based on Object-oriented Classification of Multi-band Remote Sensing Image. Geoinformatics, 18th International Conference on.: 1-6.
Wobbecke, D. M., G. E. Meyer, K. Von Bargen, and D. A. Mortensen. 1995. Color indices for weed identification under various soil, residue, and lighting conditions. Trans. ASAE 38(1), pp. 259-269.