Research and Politics July-September 2014: 1 –8 © The Author(s) 2014 DOI: 10.1177/2053168014545414 rap.sagepub.com
Creative Commons Non Commercial CC-BY-NC: This article is distributed under the terms of the Creative Commons
Attribution-NonCommercial 3.0 License (http://www.creativecommons.org/licenses/by-nc/3.0/) which permits non-commercial use, reproduction and distribution of the work without further permission provided the original work is attributed as specified on the SAGE and Open Access pages (http://www.uk.sagepub.com/aboutus/openaccess.htm).
In Innumeracy (1988: 3), John Allen Paulos asserts that “innumeracy, an inability to deal comfortably with the fun-damental notions of number and chance, plagues far too many otherwise knowledgeable citizens.” For many citi-zens, innumeracy means unfamiliarity with politically rel-evant numbers. Is this lack of familiarity consequential? Would creating “numeracy” change political attitudes? Investigations of innumeracy and political ignorance have done more to map their contours than demonstrate their consequences. But as Lupia (2006) argues, it is important to justify why any particular fact is important to know. One way is to show that learning facts changes opinions.
We investigate the consequences of remediating innu-meracy. The paper makes two central contributions. First, we extend previous studies by examining unexplored or under-explored topics, including knowledge of the racial composition of the United States population, the median income, educational attainment, the unemployment rate, and the poverty rate in the United States.
Second, we conduct three original survey experiments to investigate whether providing individuals with correct information actually affects opinions. Some previous work on innumeracy has examined correlations among numeri-cal estimates and politinumeri-cal attitudes. However, there have been few tests of what happens when erroneous estimates are corrected.
We find that correct information has little effect on related political attitudes, even when that information corrects serious misperceptions. However lamentable ignorance of
political facts may be, our results suggest that remediating this ignorance may not affect actual opinions.
Innumeracy and its (potential)
consequences
Although scholars debate the extent of the public’s factual knowledge of politics (e.g. Delli Carpini and Keeter, 1996; Gibson and Caldeira, 2009; Lupia, 2006; Luskin and Bullock, 2011; Prior and Lupia, 2008), certainly a large proportion of the public does not know many differ-ent political facts, which in turns suggests that “enlighten-ing” them could change their attitudes. This conclusion applies to political innumeracy in particular. Many citi-zens do not accurately estimate quantities related to popu-lation demographics (Alba et al., 2005; Citrin and Sides, 2008; Herda, 2013; Kuklinski et al., 2000; Morales, 2011; Nadeau et al., 1993; Theiss-Morse, 2003), macroeco-nomic statistics (Conover et al., 1986; Holbrook and Garand, 1996; Sigelman and Yanarella, 1986), and the federal budget and other quantities related to public
The consequences of political
innumeracy
Eric D Lawrence and John Sides
Abstract
The prevalence of political innumeracy – or ignorance of politically relevant numbers – is well-documented. However, little is known about its consequences. We report on three original survey experiments in which respondents were randomly assigned to see correct information about the racial composition of the US population, median income and educational attainment, and the unemployment and poverty rates. Although estimates of these quantities were frequently far from the truth, providing correct information had little effect on attitudes toward relevant public policies.
Keywords
Public opinion, innumeracy, political information
The George Washington University, USA
Corresponding author:
John Sides, Associate Professor, Department of Political Science, George Washington University, 2115 G Street NW, Suite 440, Washington, 20052, USA.
policies (Berinsky, 2007; Gilens, 1999; Kuklinski et al., 2000; Kull, 1995–96).
Why should these kinds of factual misperceptions affect attitudes? One reason is that attitudes may be distillations of relevant beliefs, where beliefs are “all thoughts that peo-ple have about attitude objects” (Eagly and Chaiken, 1993: 11). As Eagly and Chaiken put it: “The assumption is com-mon acom-mong attitude theorists that people have beliefs about attitude objects and that these beliefs are in some sense the basic building blocks of attitudes” (103). For example, atti-tudes toward public policies depend on beliefs about the beneficiaries of those policies, such as their deservingness (e.g. Iyengar, 1991). Similarly, beliefs about the importance of social problems, as manifested in estimates of quantities like the unemployment rate, could affect attitudes about the government’s response.
If beliefs are the building blocks of attitudes, then chang-ing beliefs could change attitudes. A variety of psychologi-cal theories speak to this possibility, but among the most successful and durable is Festinger’s (1957) dissonance theory. Festinger argues that when people hold beliefs that imply divergent or opposite conclusions, they tend to change one or more of those beliefs to bring them into greater agreement. Correcting a factual misperception may induce dissonance and thereby lead people to change other attitudes. For example, after finding out that a social prob-lem is more or less serious than you initially believed, you may think differently about how the government should respond to the problem.
However, other theories suggest that attempts to correct misperceptions would not necessarily change attitudes. For one, misperceptions can be stubborn. The estimates of politically relevant numbers noted earlier are far from ran-dom guesses. They vary systematically with cognitive abil-ity as well as contextual information (see Citrin and Sides, 2008; Herda, 2010; Hutchings, 2003; Jerit et al., 2006; Luskin, 1990; Nadeau and Niemi, 1995; Nadeau et al., 1993; Sigelman and Niemi, 2001; Wong, 2007) and are often held with considerable certainty (Kuklinski et al., 2000).
Second, people tend to resist changing their attitudes. Festinger noted that people often avoid information that conflicts with existing beliefs. And when that information is impossible to avoid, people may ignore it, discount it, or rationalize it away (Lodge and Taber, 2013). For exam-ple, Gaines et al. (2007) describe how Democrats and Republicans correctly perceived that casualties in the Iraq War were increasing over time, but interpreted that fact dif-ferently – with Republicans more likely to perceive the number of casualties as moderate or small. Correcting mis-perceptions can even “backfire” by worsening mispercep-tions among those least predisposed to believe the correct information (Nyhan and Reifler, 2010). In these studies, beliefs are not so much building blocks of attitudes but
consequences of attitudes. People shape their perceptions of fact to fit the opinions they already hold.
These competing theories suggest that correcting infor-mation could be effective or ineffective. It is perhaps no surprise, then, that the evidence is mixed. Misperceptions can be correlated with attitudes. For example, Nadeau et al. (1993: 343) find that people who overestimate the size of minority groups also perceive them as a greater threat (see also Citrin and Sides, 2007), but understandably qualify their conclusion: “the connection may be one of cause or effect” (see also Herda, 2010; Hochschild, 2001; Kuklinski et al., 2000: 801). Studies using experimental designs to correct innumeracy have found both that information changes political opinions (Gilens, 2001; Howell et al., 2011) and that it does not (Berinsky, 2007; Kuklinski et al., 2000). In the conclusion, we discuss our results in light of these studies to identify potential reasons for apparently divergent findings.
Experiment #1: correcting estimates
of average income and educational
attainment
The first experiment was conducted in the 2007 Cooperative Congressional Election Study (CCES). Respondents (N=1,000) were asked to estimate the aver-age household income in the United States and the per-centage of Americans with four-year college degrees. Respondents entered a number in a textbox or checked a box that said “I don’t know.”1 In this and subsequent experiments, these items were designed to help respond-ents make quantitative estimates. The items avoided jar-gon (e.g. “median income”), asked about relatively uncomplicated but still relevant categories (those with “a four-year college degree”), and simplified the task of sup-plying a percentage (see Ansolabehere et al., 2013). Eighty-three percent of the sample provided an estimate of average income and 82% provided an estimate of the percentage with a college degree.
Although the estimates varied, on average they were close to reality (Figure 1). The median estimate for income was US$40,000; the actual median household income at that time was US$49,000.2 The median estimate of the per-cent with a college degree was 30%; the actual Census fig-ure was 27%. The correlation between the two estimates was modest (r=.15; p<.001).
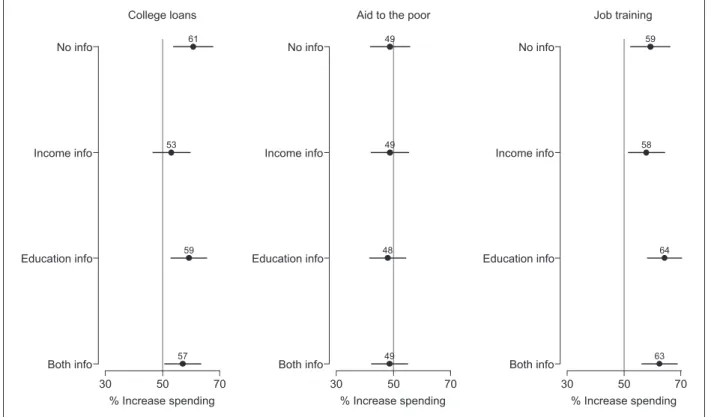
household earned about $49,000 in 2006.” The other con-dition asked whether they had heard of this report but pro-vided no correct information. A similar experiment was carried out after respondents gave their estimates of edu-cational attainment.3 Immediately after these two experi-ments, respondents were asked whether government spending on various programs should be increased, decreased, or kept the same. The programs were: loans for college tuition, the war on terrorism, aid to the poor, national defense, and job training. We focus on student loans, aid to the poor, and job training, which are most relevant to national income and educational attainment. People who overestimated the median income or the pro-portion with a college degree should support more spend-ing on these areas when they learn that conditions in the country are “worse” than they had presumed. Similarly, people who underestimated should support less spending, since the information would suggest that conditions in the country are “better” than they had presumed.
Across the four experimental conditions, there were no significant differences in preferences for increased spend-ing in these areas (Figure 2). For example, the percent favoring increased spending on aid to the poor ranged from 48–49% across the four conditions. Regressing respondents’ estimates on the treatment groups suggested no statistically significant differences across treatment groups (see Panel A of Table A-1 in the supplemental appendix). The experimental treatments had little direct effect.
Experiment #2: correcting estimates
of the unemployment and poverty
rates
The second experiment was conducted in the pre-election wave of the 2010 CCES (N=1,000). Its structure varied slightly from the first experiment. Respondents were rand-omized into one of three conditions: 40% of respondents estimated the unemployment or poverty rate, 40% esti-mated these rates and were given the correct information, and 20% did not provide estimates or receive this informa-tion. This randomization occurred separately for questions concerning unemployment and poverty, making the experi-mental design a 3×3 factorial. Eighty-eight percent of respondents provided an estimate of the unemployment rate; 82% estimated the poverty rate.
Estimates of the unemployment rate were clustered around the actual rate at that time (9.6% – see Figure 3).4 The median estimate was 12%. Approximately 25% of the sample gave an estimate that was 15% or higher, accounting for the long right tail of the distribution. Estimates of the poverty rate were more variable, but on average higher than the actual rate (20% vs. 13%). This dovetails with Kuklinski et al.’s (2000) finding that the public overestimates the fraction of Americans on wel-fare. The correlation between these sets of estimates was r=−0.06 (p=0.23).
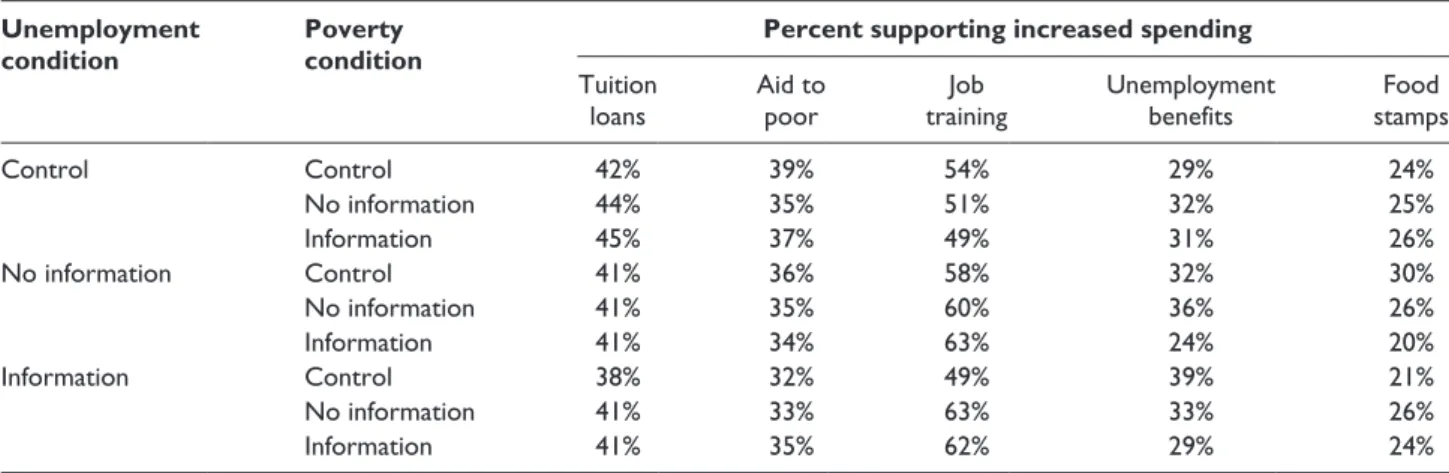
The experimental manipulations were framed as ques-tions about news or government reports, with one version of the manipulation including the actual unemployment or poverty rate. All respondents were then asked about the level of government spending on loans for college tuition, aid to the poor, job training, unemployment benefits, and food stamps – which in theory should be more connected to these economic statistics than they were median income or educational attainment.
Again, there is little effect of correct information on pref-erences for increased spending (Table 1). There are very small differences between those who guessed but did not receive information, and those who guessed and then received one or both pieces of correct information. Models of spending pref-erences also suggest no systematic diffpref-erences across experi-mental conditions (see Panel B of Table A-1).
Median estimate: US$40,000
Correct figure: US$49,000
0% 5% 10% 15% 20%
US$0 US$20K US$40K US$49K US$60K US$80K US$100K Estimated Average Income
Estimates of average income
Median estimate=30% Correct figure=27%
0% 5% 10% 15% 20%
0% 20% 27% 40% 60% 80% 100% Estimated percent with college degree
Estimates of educational attainment
Figure 1. The distribution of estimates of average income and the percentage with a college degree.
Experiment #3: correcting estimates
of the racial composition of the
population
The third experiment was conducted in the post-election wave of the 2010 CCES (N=844). Respondents were ran-domly assigned to three conditions: 40% guessed the frac-tion of the populafrac-tion in each of three racial groups (“white or Caucasian,” “black or African-American,” and “Latino or Hispanic”), 40% guessed those fractions and subse-quently received correct information, and 20% did not guess at all (the control group).
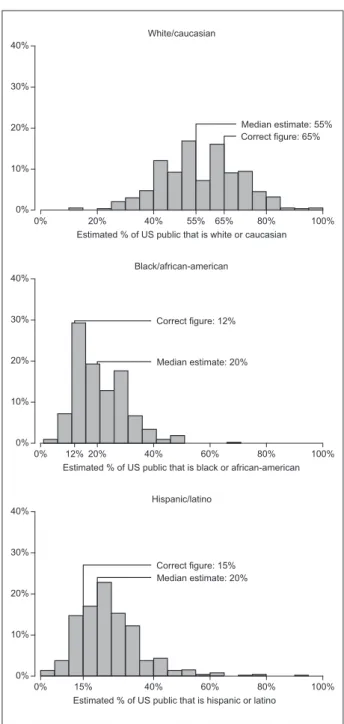
As in previous studies (e.g. Nadeau et al., 1993; Theiss-Morse, 2003) respondents underestimated the percentage of the population that is white and overestimated the per-centages that are black or Latino (Figure 4). The median estimate of the percent white was 55% (vs. 65% in reality), while the median estimates of the percent black and percent Latino, 20% in both cases, were larger than reality (12% and 15%, respectively). Larger estimates of the percent white were associated with smaller estimates of the percent black (r=−0.55; p<0.001) and the percent Latino (r=−0.61; p<0.001). Estimates of the size of the two minority ethnic groups were positively correlated (r=0.24; p<0.001).
The experimental manipulation involved a news story about Census Bureau estimates of the racial composition of
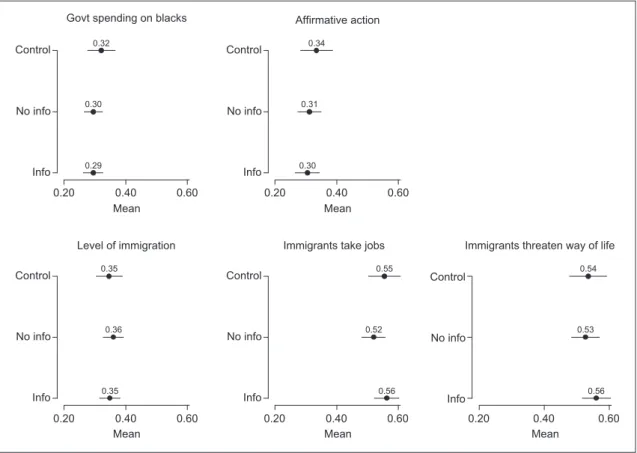
the American population. Following this prompt, respond-ents were asked five questions about three policy areas rel-evant to black and Latinos: government spending to help blacks, affirmative action, and immigration. Correcting overestimates of minority group population size should cre-ate more willingness to support policies that would benefit these groups, while correcting underestimates of minority group population size should create less willingness to sup-port policies that would benefit these groups.
Once again respondents who received the correct infor-mation gave similar responses on average to those who pro-vided guesses but did not receive the information and to those in the control group (Figure 5). The largest pair-wise difference was .04 on scales that range from 0 to 1. Additional analysis also found no statistically significant treatment effects (Panel C of Table A-1).
Conclusion
We find that correcting examples of a particular type of misinformation – political innumeracy – has little effect on political attitudes. These null effects emerged regard-less of policy domain or the particular kinds of numbers provided.5
This raises at least two questions. Why did correct infor-mation matter so little? And, across the scholarly literature,
57 59 53
61
Both info Education info Income info No info
30 50 70
% Increase spending
fake
College loans
49 48 49 49
Both info Education info Income info No info
30 50 70
% Increase spending
fake
Aid to the poor
63 64 58
59
Both info Education info Income info No info
30 50 70
% Increase spending
fake
Job training
Figure 2. The effects of correct information about income and educational attainment.
why are the effects of factual information so inconsistent? Based on our findings and other studies (Berinsky, 2007;
Gilens, 2001; Howell et al., 2011; Kuklinski et al., 2000) that also involve experimental treatments with correct numerical information, there is no clear answer. The incon-sistencies do not appear to depend on several features of research design. Across these studies, the treatments all involved similar statements of correct numerical quantities, such as the number of American military casualties in Iraq (Berinsky, 2007), the average teacher’s salary (Howell et al., 2011), or the percent of the budget spent on foreign aid (Gilens, 2001) or welfare (Kuklinski et al., 2000). Moreover, both Gilens’ and our experiments frame the cor-rect facts as originating in a news story or government report, although Gilens finds significant effects of correct facts and we do not.
In terms of the sequence of questions and information in the survey experiment, our design most closely resembles the second experiment presented in Kuklinski et al. (2000). Their study and ours first asked respondents to provide esti-mates and then directly corrected the estiesti-mates of a random subset. (The other studies did not ask for estimates first.) Kuklinski et al. liken this to hitting respondents “right between the eyes” with the correct information. In their study this was the only experiment that had a significant impact: directly correcting people’s estimates of how much of the budget goes to welfare made them less opposed to welfare spending. But this same design did not elicit similar findings in our experiments.
The types of issues examined in these studies also offer little insight into their divergent findings. One might expect that correcting information should matter less for attitudes about issues tied to durable and deeply rooted predispositions, such as partisan or racial identities. This might explain why our experiment involving the racial composition of the population and attitudes about affirma-tive action and immigration did not turn up a significant treatment effect. The same finding emerged from the first experiment in Kuklinski et al. (2000), which examined
Median estimate: 12%
Correct figure: 9.6%
0% 10% 20% 30% 40%
0% 20% 40% 60% 80% 100% Estimated unemployment rate
Estimates of unemployment rate
Median estimate: 20% Correct figure: 13%
0% 10% 20% 30% 40%
0% 20% 40% 60% 80% 100% Estimated poverty rate
Estimates of poverty rate
Figure 3. The distribution of estimates of the unemployment and poverty rates.
Distributions of estimates of percent unemployed and percent living in poverty. The actual figures and median estimates are noted. Source: 2010 CCES.
Table 1. The effects of correct information about the unemployment and poverty rates.
Unemployment condition
Poverty condition
Percent supporting increased spending
Tuition loans
Aid to poor
Job training
Unemployment benefits
Food stamps
Control Control 42% 39% 54% 29% 24%
No information 44% 35% 51% 32% 25%
Information 45% 37% 49% 31% 26%
No information Control 41% 36% 58% 32% 30%
No information 41% 35% 60% 36% 26%
Information 41% 34% 63% 24% 20%
Information Control 38% 32% 49% 39% 21%
No information 41% 33% 63% 33% 26%
Information 41% 35% 62% 29% 24%
attitudes toward another racialized issue, welfare (see Gilens, 1999). The same finding also emerged from Berinsky’s study of attitudes toward Iraq War, which was a highly polarizing issue for Democrats and Republicans (Jacobson, 2007).
However, these studies mostly examine issues related to the budget, government spending, and taxes. Although attitudes about these issues are connected to durable
predispositions such as partisanship and ideology, these attitudes also vary a great deal over time (Wlezien, 1995). But despite a similar focus on spending – whether on for-eign aid and prisons, on teacher salaries, on welfare (Gilens, 2001; Howell et al., 2011; and Kuklinski et al., 2000, experiment 2, respectively), or on spending on vari-ous programs, as in our experiments – these studies still have divergent findings. This is true even though the rele-vance of the facts to the specific policy items seems com-parable in these studies – e.g., the crime rate and spending on prisons in Gilens (2001) and the unemployment and poverty rates and spending on unemployment benefits and aid to the poor in our studies.
There is clearly much more we need to know about the conditions under which correct information affects atti-tudes. A promising direction for future research is to bet-ter understand people’s willingness to incorporate factual information into their attitudes. In other words, although innumeracy may reflect “an inability to deal comfortably with the fundamental notions of number and chance,” as Paulos puts it, the willingness to draw upon correct numerical information may be more a matter of motiva-tion than ability. For example, people appear more moti-vated to answer factual questions correctly when provided a financial incentive (Prior and Lupia, 2008) and to incor-porate substantive information when polarizing party cues are not present (Druckman et al., 2013). Further research should elaborate on the factors that influence this motivation.
Better understanding the connection between facts and attitudes has important stakes for both empirical and nor-mative political inquiry. For empirical inquiry, the impor-tant question is the extent to which citizens function like “motivated reasoners” or are actually willing to update their beliefs and attitudes in the face of new and even dis-sonant information. The competing theoretical perspectives and empirical findings suggest that this question is far from resolved. For normative inquiry, the crucial debate is over how much citizens need factual information in the first place (see Lupia, 2006). And of course the two questions are related: the normative value of facts may depend on whether the public incorporates facts into their thinking.
Conflict of interest
The authors declare that there is no conflict of interest.
Funding
This research received no specific grant from any funding agency in the public, commercial, or not-for-profit sectors.
Supplementary Material
The online appendix is available at: http://rap.sagepub.com/ content/by/supplemental-data
Median estimate: 55% Correct figure: 65%
0% 10% 20% 30% 40%
0% 20% 40% 55% 65% 80% 100%
Estimated % of US public that is white or caucasian White/caucasian
Median estimate: 20% Correct figure: 12%
0% 10% 20% 30% 40%
0% 12% 20% 40% 60% 80% 100%
Estimated % of US public that is black or african-american Black/african-american
Median estimate: 20% Correct figure: 15%
0% 10% 20% 30% 40%
0% 15% 40% 60% 80% 100%
Estimated % of US public that is hispanic or latino Hispanic/latino
Figure 4. The distributions of estimates of the racial composition of the population.
Notes
1. The textbox for the income item had a dollar sign in front of it. The textbox for the education item would accept only numbers between 0 and 100. Exact question wordings for the items in all experiments are in the supplemental appendix, along with information about the CCES.
2. Figure 1 and all subsequent analyses exclude six observations with very high estimates of income (ranging from $200,000 to $6.0 million) and three observations with very low estimates ($0 to $9,000). This does not change the median estimate. 3. The vast majority of respondents, 90%, reported that they
had not heard of these (fictional) reports.
4. In this sample, 48% estimated the unemployment rate cor-rectly, plus or minus 1 percentage point, which was similar to the rate (52%) reported in Ansolabehere and Schaffner (2014). 5. Null effects could mask offsetting effects among under-estimators and over-under-estimators, since correct information has opposite implications for the attitudes of each group. However, we found little evidence that the effect of correct information depended on people’s original estimates of the quantities in question. We present these results in the sup-plementary materials.
References
Alba R, Rumbaut R and Marotz K (2005) A distorted nation: Perceptions of racial/ethnic group sizes and attitudes toward
immigrants and other minorities. Social Forces 84(2): 901– 919.
Ansolabehere S and Schaffner B (2014) Does survey mode still matter? Findings from a 2010 multi-mode comparison. Political Analysis 22(3): 285–303.
Ansolabehere S, Meredith M and Snowberg E (2013) Asking about numbers: Why and how. Political Analysis 21(1): 48–69.
Berinsky A (2007) Assuming the costs of war: Events, elites, and American public support for military conflict. Journal of Politics 69(4): 975–997.
Citrin J and Sides J (2008) Immigration and the imagined com-munity in Europe and the United States. Political Studies 56: 33–56.
Conover PJ, Feldman S and Knight K (1986) Judging inflation and unemployment: The origins of retrospective evaluations. Journal of Politics 48(3): 565–588.
Delli Carpini M and Keeter S (1996) What Americans Know about Politics and Why It Matters. New Haven: Yale University Press.
Druckman JN, Peterson E and Slothuus R (2013) How elite parti-san polarization affects public opinion formation. American Political Science Review 107(1): 57–79.
Eagly AH and Chaiken S (1993) The Psychology of Attitudes. Fort Worth: Harcourt Brace Jovanovich.
Festinger L (1957) A Theory of Cognitive Dissonance. Evanston, IL: Row, Peterson.
0.32
0.30
0.29
Control
No info
Info
0.20 0.40 0.60
Mean
fake
0.34
0.31
0.30
Control
No info
Info
0.20 0.40 0.60
Mean
fake
Affirmative action
0.35
0.36
0.35
Control
No info
Info
0.20 0.40 0.60
Mean
fake
Level of immigration
0.55
0.52
0.56
Control
No info
Info
0.20 0.40 0.60
Mean
fake
Immigrants take jobs
0.54
0.53
0.56
Control
No info
Info
0.20 0.40 0.60
Mean
fake
Immigrants threaten way of life Govt spending on blacks
Figure 5. The effects of correct information about racial composition.
Gaines BJ, Kuklinski JH, Quirk PJ, et al. (2007) Same facts, dif-ferent interpretations: Partisan motivation and opinion on Iraq. Journal of Politics 69(4): 957–974.
Gibson JL and Caldeira GA (2009) Knowing the supreme court? A reconsideration of public ignorance of the high court. Journal of Politics 71: 429–441.
Gilens M (1999) Why Americans Hate Welfare: Race, Media, and the Politics of Antipoverty Policy. Chicago: University of Chicago Press.
Gilens M (2001) Political ignorance and collective policy prefer-ences. American Political Science Review 95(2): 379–396. Herda D (2010) How many immigrants? Foreign-born
popula-tion innumeracy in Europe. Public Opinion Quarterly 74(4): 674–695.
Herda D (2013) Innocuous ignorance? Perceptions of the American Jewish population size. Contemporary Jewry 33(3), 241–255.
Hochschild JL (2001) Where you stand depends on what you see: Connections among values, perceptions of fact, and policy prescriptions. In Kuklinski JH (ed) Citizens and Politics: Perspectives from Political Psychology. Cambridge: Cambridge University Press. pp. 313–340.
Holbrook T and Garand JC (1996) Homo economus? Economic information and economic voting. Political Research Quarterly 49(2): 351–375.
Howell W, Peterson PE and West M (2011) Meeting of the minds. Education Next 11(1): 20–31.
Hutchings VL (2003) Public Opinion and Democratic Accountability: How Citizens Learn about Politics. Princeton: Princeton University Press.
Iyengar S (1991) Is Anyone Responsible? How Television Frames Political Issues. Chicago: Chicago University Press. Jacobson GC (2007) A Divider, Not a Uniter: George W. Bush
and the American People. New York: Pearson Longman. Jerit J, Barabas J and Belson T (2006) Citizens, knowledge, and
the information environment. American Journal of Political Science 50: 266–282.
Kuklinski JH, Quirk PJ, Jerit J, et al. (2000) Misinformation and the currency of citizenship. Journal of Politics 62: 791–816. Kull S (1995–96) What the public knows that Washington doesn’t.
Foreign Policy 101: 102–115.
Lodge M and Taber CS (2013) The Rationalizing Voter. New York: Cambridge University Press.
Lupia A (2006) How elitism undermines the study of voter com-petence. Critical Review 18: 217–232.
Luskin RC (1990) Explaining political sophistication. Political Behavior 12(4): 331–361.
Luskin RC and Bullock JG (2011) “Don’t know” means “don’t know”: DK responses and the public’s level of political knowledge. Journal of Politics 73(2): 547–557.
Morales L (2011) U.S. adults estimate that 25% of Americans are gay or lesbian. http://www.gallup.com/poll/147824/Adults-Estimate-Americans-Gay-Lesbian.aspx.
Nadeau R and Niemi RG (1995) Educated guesses: The process of answering factual knowledge questions in surveys. Public Opinion Quarterly 59: 323–346.
Nadeau R, Niemi RG and Levine J (1993) Innumeracy about minority populations. Public Opinion Quarterly 57: 332–347. Nyhan B and Reifler J (2010) When corrections fail: The per-sistence of political misperceptions. Political Behavior 32: 303–330.
Paulos JA (1988) Innumeracy: Mathematical Illiteracy and its Consequences. New York: Hill and Wang.
Prior M and Lupia A (2008) Money, time, and political knowl-edge: Distinguishing quick recall and political learning skills. American Journal of Political Science 52(1): 169–183. Sides, John. 2008. Cooperative Congressional Election Study
2007: George Washington University content. [Computer File] Release: February 2, 2008. Washington DC [producer] http://web.mit.edu/polisci/portl/cces/teamcontent.html Sides, John. 2011. Cooperative Congressional Election Study
2010: George Washington University content. [Computer File] Release: March 1, 2011. Washington DC [producer] http://cces.gov.harvard.edu.
Sides J and Citrin J (2007) European opinion about immigration: The role of identities, interests, and information. British Journal of Political Science 37(3): 477–504.
Sigelman L and Yanarella EJ (1986) Public information on public issues: A multivariate analysis. Social Science Quarterly 67: 402–410.
Sigelman L and Niemi R (2001) Innumeracy about minority pop-ulations: African Americans and whites compared. Public Opinion Quarterly 65(1): 86–94.
Theiss-Morse E (2003) Characterizations and consequences: How Americans envision the American people. Paper presented at the 2003 Annual Meeting of the Midwest Political Science Association, Chicago, IL, 3–6 April 2003.
Wlezien C (1995) The public as thermostat: Dynamics of prefer-ences for spending. American Journal of Political Science 39(4): 981–1000.