www.biogeosciences.net/9/5031/2012/ doi:10.5194/bg-9-5031-2012
© Author(s) 2012. CC Attribution 3.0 License.
Biogeosciences
Bacterial diversity and biogeochemistry of different chemosynthetic
habitats of the REGAB cold seep (West African margin, 3160 m
water depth)
P. Pop Ristova1,2,3, F. Wenzh¨ofer1,2,3, A. Ramette1,2, M. Zabel3, D. Fischer3, S. Kasten4, and A. Boetius1,2,3 1HGF-MPG Group for Deep Sea Ecology and Technology, Alfred Wegener Institute for Polar and Marine Research, Am
Handelshafen 12, 27570 Bremerhaven, Germany
2Max Planck Institute for Marine Microbiology, Celsius Strasse 1, 28359 Bremen, Germany
3MARUM – Center for Marine Environmental Science, University of Bremen, Leobener Strasse, 28359 Bremen, Germany 4Alfred Wegener Institute for Polar and Marine Research, Am Handelshafen 12, 27570 Bremerhaven, Germany
Correspondence to:P. Pop Ristova (pristova@marum.de)
Received: 11 June 2012 – Published in Biogeosciences Discuss.: 12 July 2012
Revised: 5 November 2012 – Accepted: 15 November 2012 – Published: 7 December 2012
Abstract.The giant pockmark REGAB (West African
mar-gin, 3160 m water depth) is an active methane-emitting cold seep ecosystem, where the energy derived from microbially mediated oxidation of methane supports high biomass and diversity of chemosynthetic communities. Bare sediments in-terspersed with heterogeneous chemosynthetic assemblages of mytilid mussels, vesicomyid clams and siboglinid tube-worms form a complex seep ecosystem. To better understand if benthic bacterial communities reflect the patchy distribu-tion of chemosynthetic fauna, all major chemosynthetic habi-tats at REGAB were investigated using an interdisciplinary approach combining pore water geochemistry, in situ quan-tification of fluxes and consumption of methane, as well as bacterial community fingerprinting. This study revealed that sediments populated by different fauna assemblages show distinct biogeochemical activities and are associated with distinct sediment bacterial communities. The methane con-sumption rates and methane effluxes ranged over one to two orders of magnitude across habitats, and reached highest val-ues at the mussel habitat, which hosted a different bacte-rial community compared to the other habitats. Clam as-semblages had a profound impact on the sediment geochem-istry, but less so on the bacterial community structure. More-over, all clam assemblages at REGAB were restricted to sed-iments characterized by complete methane consumption in the seafloor, and intermediate biogeochemical activity. Over-all, variations in the sediment geochemistry were reflected
in the distribution of both fauna and microbial communities; and were mostly determined by methane flux.
1 Introduction
show a fragmented distribution along the global continental margins, leading to isolation of populations. Hence, studies dedicated to the geobiology of cold seeps have been seek-ing to answer the followseek-ing overarchseek-ing questions (i) how diverse and specific are microbial and faunal communities at cold seeps compared to the background environment; (ii) to what extent are seep communities indicative of geological processes such as the strength of hydrocarbon seepage; and (iii) which factors control the diversity and dispersal rates of seep-associated organisms on both regional and global scales (among and within cold seeps).
These questions were central to this study of the bacte-rial communities of the giant pockmark cold seep REGAB (Charlou et al., 2004). Studies investigating seep microor-ganism have predominantly been focusing on the taxonomi-cal identification of the key microbial players mediating the core energy producing processes, i.e. anaerobic oxidation of methane (AOM) coupled to sulphate reduction (SR) and sul-phide oxidation, their phylogenetic affiliation, and relation of their abundances and activities to the local geochemistry (Boetius et al., 2000; Knittel et al., 2003; Heijs et al., 2007; Cambon-Bonavita et al., 2009; Knittel and Boetius, 2010; Orcutt et al., 2010). However, high-resolution studies inves-tigating the structure of microbial communities as a whole, over a range of habitats within a single cold seep (m to km scale) are still rare, hence the abiotic and biotic factors that may directly influence the bacterial diversity at cold seeps remain elusive.
Here we tested the hypotheses that the bacterial diversity at cold seeps changes along geochemical gradients with sed-iment depth, and moreover that the availabilities of methane and sulphide as main energy sources at cold seeps struc-ture the bacterial communities. Secondly, similar to what has been shown for small-size fauna (Van Gaever et al., 2009), we tested if the type and specific activity of chemosynthetic megafauna can exert a selective pressure and therefore influ-ence bacterial diversity patterns at cold seeps. Therefore we combined pore water geochemistry, quantification of fluxes and consumption rates of methane and bacterial community fingerprinting of the major habitat types at REGAB, popu-lated by different chemosynthetic organisms (mytilid mus-sels, vesicomyid clams or thiotrophic bacterial mats). The main aims were to better understand (i) if the bacterial com-munity within a cold seep ecosystem varies according to habitat distribution on a “landscape” scale; (ii) if the bac-terial diversity is shaped by availability of energy; and (iii) if habitat partitioning by large symbiotic megafauna influences the structure of bacterial communities.
2 Material and methods
2.1 Description of sampling sites and sampling
procedure
The REGAB pockmark, situated at 3160 m water depth on the Congo–Angola margin represents the second largest (800 m Ø and 15–20 m deep) single cold seep site known to date in the Eastern Atlantic (Sibuet and Olu-Le Roy, 2002; Ondr´eas et al., 2005). REGAB has unusual sedimen-tological features resulting from the large amount of ter-rigenous input by the Congo river and the vicinity of one of the largest submarine canyons, the Congo deep-sea fan (Ondr´eas et al., 2005 and references therein; Pierre and Fou-quet, 2007). The pockmark formation has been related to a sudden release of overpressurized gas followed by a col-lapse of a sediment dome (Ondr´eas et al., 2005). The cur-rent escape of gas is assumed to occur along a deep pipe (300 m) rooted in a buried paleo-channel (Gay et al., 2003; Ondr´eas et al., 2005). The seafloor of the REGAB pockmark is characterized by high biomasses of diverse chemosynthetic megafauna which occur clustered as non-overlapping aggre-gations of mytilid mussels or vesicomyid clams, or siboglinid tubeworms (Ondr´eas et al., 2005; Olu-Le Roy et al., 2007a). Video surveys during this study in 2008 (METEOR 76/3b report http://www.dfg-ozean.de/de/berichte/fs meteor/) re-vealed that the REGAB pockmark was dominated by the same three major types of megafauna assemblages already discovered during previous investigations of this cold seep in 1998, 2000 and 2001 (Ondr´eas et al., 2005; Sibuet and Van-griesheim, 2009; Fig. 2). Extensive carbonate cements and outcropping gas hydrates mark the central part of REGAB, where also strong venting of gas and surface precipitates of gas hydrate were observed (Fig. 1). This area was densely populated by mussels and tubeworms attached to the car-bonates, and was surrounded by soft sediments littered with clam shells, and patchily distributed beds of living clams. In comparison to the areal coverage of fauna estimated in 2000 (Olu-Le Roy et al., 2007a), the number and sizes of mussel patches associated with soft sediments seemed to have de-clined with time, as deduced from the Remotely Operated Vehicle (ROV) video observations performed in 2008. How-ever, the spatial distribution of clam species forming hetero-geneous patches (Fig. 2) has remained more or less the same, indicating that relatively stable biogeochemical conditions prevail over time at REGAB.
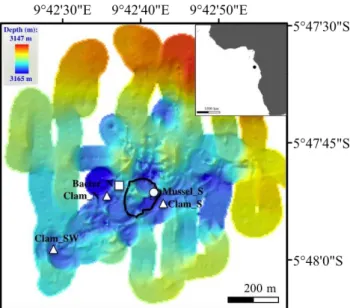
Fig. 1.Map of the REGAB pockmark (adopted from Ondr´eas et al., 2005), derived from ROV Victor 6000 data (Ifremer, France), with the main sampling locations, i.e. Bacter N, Clam N, Mussel S, Clam S and Clam SW. The black line indicates the approximate extension of carbonates with associated mytilids and siboglinids. The investigated bacterial mat is depicted with a square, the various clam patches with triangles and the mussels with a circle symbol.
sites devoid of symbiotic megafauna characterized by bare sediment (Bacter N Env, Clam N Env, Clam S Env, Mus-sel S Env, Clam SW Env). Push coring and biogeochemi-cal measurements were not possible in the central carbonate-hydrate site, due to the hard substrate at this location. The distances between the megafaunal patches and the adjacent bare sediment were in the range of 3–28 m. Approximate distances between the main sampling locations were: 100– 150 m between N REGAB and S REGAB, 400–450 m be-tween S REGAB and SW REGAB and 350–400 m bebe-tween N REGAB and SW REGAB (Fig. 1). Sampling locations and sample labels are summarized in Table 1 and Supplement Ta-ble 1, and all related data are availaTa-ble in the PANGAEA database under doi:10.1594/PANGAEA.788883.
Push core (Ø 8 cm, sediment height 10–20 cm) targeted sampling of the individual habitats was performed using the ROV QUEST camera system and the manipulator arm. Im-mediately after recovery, the push cores were transferred to a tempered room kept at in situ temperature (4◦C) and sub-sampled for different type of analyses.
2.2 Biogeochemical measurements
2.2.1 Pore water chemistry
Pore water was extracted in one centimetre resolution, from the top 0–20 cm sediment depth, using Rhizon moisture sam-plers (Seeberg-Elverfeldt et al., 2005; pore size 0.1 µm)
in-Fig. 2.Typical habitats at the REGAB pockmark: central area with extensive carbonate crust and outcropping hydrates populated by mussels and tubeworms(a); clam patches overlying blackened re-duced sediment (b), (c), (f); mussel patch on soft sediment(d); white bacterial mat at the REGAB N(e); Benthic chamber incu-bation is visible in(b)picture.
serted into holes of pre-drilled push core liners at all investi-gated sites (Table 1). The pore water was immediately sub-sampled for different types of analyses (total H2S, SO24−,
NH+4, Fe2+, Mn2+, PO3− 4 , Cl
−, and Alkalinity). Descrip-tion of the measurement procedure for Fe2+, Mn2+, PO3− 4
as well as pH can be found in the supplementary mate-rial. Alkalinity was calculated from a volumetric analysis by titration of 1 ml of the pore water samples with 0.01 or 0.05 M HCl, performed on board. Concentration of ammo-nium was determined via the conductivity method (Hall and Aller, 1992) on board. Pore water subsamples (1.5 mL) were immediately fixed with 0.6 mL zinc acetate, and the total sulphide (6H2S = H2S + HS−+ S2−) concentration was
de-termined photometrically (Cline, 1969) in the home labora-tory. Sulphate and chloride subsamples were diluted 1 : 100 and stored frozen at −20◦C until further processing and determination of the concentration by ion chromatography (Metrohm IC Advanced Compact 861) at a flow rate of 0.7 mL min−1.
To estimate the proportions of bio-irrigation and advection on the transport of solutes, the transport-reaction model Ex-plicite was applied (Zabel and Schulz, 2001; K¨uster-Heins et al., 2010). For this purpose we used the pore water concen-tration profiles of sulphate and sulphide. Values for sulphate reduction rates used in the model correspond to the analytical results (see Table 2).
2.2.2 Methane and sulphate consumption rates
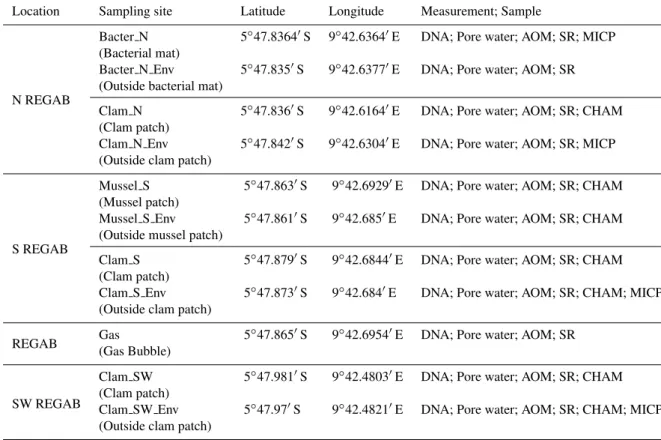
Table 1.Overview of the sampling sites, their geographic position and type of measurements performed within this study. Sampling and mea-surements were conducted in July–August 2008. AOM = Anaerobic Oxidation of Methane, SR = Sulphate Reduction, MICP = microprofiler measurement, CHAM = Benthic Chamber Incubation.
Location Sampling site Latitude Longitude Measurement; Sample
N REGAB
Bacter N 5◦47.8364′S 9◦42.6364′E DNA; Pore water; AOM; SR; MICP (Bacterial mat)
Bacter N Env 5◦47.835′S 9◦42.6377′E DNA; Pore water; AOM; SR (Outside bacterial mat)
Clam N 5◦47.836′S 9◦42.6164′E DNA; Pore water; AOM; SR; CHAM (Clam patch)
Clam N Env 5◦47.842′S 9◦42.6304′E DNA; Pore water; AOM; SR; MICP (Outside clam patch)
S REGAB
Mussel S 5◦47.863′S 9◦42.6929′E DNA; Pore water; AOM; SR; CHAM (Mussel patch)
Mussel S Env 5◦47.861′S 9◦42.685′E DNA; Pore water; AOM; SR; CHAM (Outside mussel patch)
Clam S 5◦47.879′S 9◦42.6844′E DNA; Pore water; AOM; SR; CHAM
(Clam patch)
Clam S Env 5◦47.873′S 9◦42.684′E DNA; Pore water; AOM; SR; CHAM; MICP (Outside clam patch)
REGAB Gas 5
◦47.865′S 9◦42.6954′E DNA; Pore water; AOM; SR
(Gas Bubble)
SW REGAB
Clam SW 5◦47.981′S 9◦42.4803′E DNA; Pore water; AOM; SR; CHAM (Clam patch)
Clam SW Env 5◦47.97′S 9◦42.4821′E DNA; Pore water; AOM; SR; CHAM; MICP (Outside clam patch)
intervals, according to the procedure described in Felden et al. (2010). Methane and sulphate concentrations were mea-sured by gas chromatography (5890A, Hewlett Packard) and anion exchange chromatography (Waters IC-Pak anion ex-change column, waters 430 conductivity detector) in the home laboratory, respectively. Turnover rates of methane and sulphate were determined in the home laboratory by scintillation counting according to Treude et al. (2003) and Kallmeyer et al. (2004), respectively.
2.2.3 Benthic chamber measurements (TOU and CH4
efflux)
The Total Oxygen Uptake (TOU) and methane efflux through the sediment-water interface were determined in situ for most of the investigated habitats (Table 1) using an ROV-operated benthic chamber module (CHAM). A technical description of the benthic chamber module (transparent cylinder shape with a diameter of 19 cm) and details on the CH4
measure-ment procedure can be found in Felden et al. (2010) and Duperron et al. (2011). Briefly, 284 cm2 of sediment with
10–15 cm overlying water (equivalent to a volume of 2.8– 4.3 L) was incubated in situ and changes in oxygen and methane concentrations were monitored over time by pre-programmed syringe sampling and optode measurements.
Oxygen concentration in the enclosed bottom water was con-tinuously measured with the help of an oxygen optode, and the TOU flux (mmol m−2d−1) was calculated from the initial
linear decrease in O2concentration versus time (Wenzh¨ofer
and Glud, 2002; Felden et al., 2010). Methane concentrations were determined on water samples taken from the incubated water column, on board using a gas chromatograph (Agilent 6890N) as described previously (Niemann et al., 2009 and references therein). The methane efflux (mmol m−2d−1) was
calculated as the change of methane concentration in the en-closed bottom water over time (Felden et al., 2010).
2.2.4 Oxygen microsensor measurements
reference (Revsbech, 1989). The microsensors were cali-brated by applying a two-point calibration (estimated from the O2concentration in the bottom water and in the anoxic
part of the sediment). Bottom water was sampled by means of ROV water sampler (KIPS) (Garbe-Sch¨onberg et al., 2006) and the oxygen concentration was determined with the Win-kler titration method (Grasshoff et al., 1999). Diffusive Oxy-gen Uptake (DOU) was calculated from the linear concentra-tion gradient in the Diffusive Boundary Layer (DBL) by ap-plying Fick’s first law of diffusion, as described in (Jørgensen and Des Marais, 1990). The diffusion coefficient of O2 in
seawater was corrected for salinity and temperature (Li and Gregory, 1974).
2.3 Bacterial community characterization
2.3.1 Bacterial cell numbers
The total number of single cells was determined at every sta-tion by applying the Acridine Orange Direct Count (AODC) method. Push cores were subsampled vertically with smaller cores (Ø 28 mm), which in turn were sliced into 2 cm sec-tions. Samples were fixed in 4 % formaldehyde/seawater and stored at 4◦C. The AO-staining was done in the home labora-tory as previously described (Meyer-Reil, 1983; Boetius and Lochte, 1996). For each sample, a minimum of two replicate filters and 30 grids per filter were randomly counted.
2.3.2 DNA samples
On board, sediment cores for DNA analysis were sliced in 2 cm intervals, down to 18 cm depth and stored at −20◦C for further analysis in the home laboratory. DNA was ex-tracted from one gram of sediment with the Ultra Clean Soil DNA Kit (MoBio Laboratories, Inc., Carlsbad, CA, USA) following the manufacture’s recommendations for maximum yields. DNA was finally eluted in 100 µL 1×TE buffer (Promega, Madison, WI, USA). DNA quality was confirmed with a gel electrophoresis (1 % agarose gel). Extracted DNA was quantified with a microplate spectrometer (Infinite® 200 PRO NanoQuant, TECAN Ltd, Switzerland).
2.3.3 Automated Ribosomal Intergenic Spacer Analysis
(ARISA)
The bacterial community structure at REGAB was de-termined by Automated Ribosomal Intergenic Analysis (ARISA; Fisher and Triplett, 1999). Standardized amounts of DNA (10 µL) from each sample were amplified in tripli-cates using the forward FAM-labelled ITSF and reverse IT-SReub primers (Cardinale et al., 2004). The PCR procedure, purification of PCR-products, capillary electrophoresis reac-tion, as well as data transformation were carried out as de-scribed previously (Ramette, 2009). The ARISA peaks were binned, using a bin size of 2 bp, to account for slight peak shifts between runs and for peak size calling imprecision
(In-teractive Binner function, http://www.ecology-research.com; Ramette, 2009).
2.3.4 Statistical analyses
All statistical analyses were performed with the open-source software R (The R Project for Statistical Computing v.2.9.2; http://www.r-project.org/) using the ”vegan” package (Oksa-nen et al., 2011). All statistical analyses were restricted to the 0–10 cm sediment depth. Correlation between differences in geochemical fluxes and β-diversity, the change in commu-nity structure and/or composition among sites calculated us-ing the Bray-Curtis or Jaccard index (Whittaker, 1960), was tested applying the Mantel correlation test based on spear-man ranking. The Mantel test is often used in the field of ecology to test the significance of the correlation between two matrices (Ramette, 2007 and references therein), such as in our case the difference in geochemical fluxes and the β-diversity. The Mantel p-values were corrected for multi-ple testing using the Bonferroni correction (Ramette, 2007). A reduced data set, including the following sites: Clam N, Clam S, Clam S Env, Mussel S, Mussel S Env, Clam SW, Clam SW Env, and pooled samples within individual habi-tats (0–10 cm merged ARISA peaks) were used for this anal-ysis. All other statistical analyses were performed on indi-vidual non-pooled ARISA samples derived from indiindi-vidual sediment depth samples. The bacterial community structure at REGAB was visualized by applying Non-metric MultiDi-mensional Scaling (NMDS) analysis. The NMDS algorithm ranks distances between objects, and uses these ranks to map the objects nonlinearly onto a simplified, two-dimensional ordination space in order to preserve their ranked differences, and not the original distances (Shepard, 1966). Hence, it has been shown that NMDS is generally efficient at identifying underlying gradients and at representing relationships in var-ious multisample data sets as derived from molecular finger-printing techniques (Ramette, 2007 and references therein). Separations of groups identified on the NMDS plot were tested for significance using the non-parametric Analysis of Similarity (ANOSIM) test. ANOSIM test compares the ranks of distances (as derived from any distance measure) between two or more groups with the ranks of distances within groups (Clarke, 1993).
Forward selection procedure was used to choose the sim-plest model that can explain most of the variation in the com-munity. The effect of the geochemistry (pore water concen-trations of CH4, total H2S, SO24−, pH, Mn2+, Fe2+, Cl−,
respective contribution of each set of environmental variables and into their covariations using ordinations (Ramette, 2007 and references therein). The Hellinger-transformation is rec-ommended for data sets that contain many zeros, in order to make them suitable for analyses by linear methods (Legendre and Gallagher, 2001). Single and combined effects of factors in our data set were tested for significance by performing 999 Monte Carlo permutations. Clam presence/absence was dummy-coded assuming that clams directly influence only the topmost 6 cm of sediment, based on their average shell length and distance reached by their foot.
A distance-based test for homogeneity of multivariate dis-persions (Anderson et al., 2006) was applied to test for the in-fluence of the clams on the dispersion of bacterialβ-diversity on smaller scales. The difference among dispersion groups was tested for significance using the Kruskal Wallis and Mann Whitney U test for unmatched samples. The later test was also used to assess if differences in shared OTUs among sites are statistically significant.
As all investigated environmental variables departed from normality, prior to the multivariate analyses, the geochemical data was normalized using the log-transformation, as well as standardized in order to remove the undue influence of magnitude differences between scales or units. Pairwise dis-tances among samples were calculated using the Bray-Curtis dissimilarity index (Bray and Curtis, 1957) for the ARISA diversity data and Euclidean distances for geochemical data (for both, flux and concentration data) prior to the analyses mentioned above.
3 Results
3.1 Visual description of the main habitats at REGAB
In the northern part of REGAB (REGAB N; Fig. 2) two main types of habitats were sampled: white thiotrophic bacterial mats (not found in the other parts of REGAB) and clam patches. The two investigated sites (Bacter N and Clam N) were found<36 m apart. The Clam N patch was the largest of all investigated patches and was dominated by one clam species –Christineconcha regab(von Cosel and Olu, 2009). The seafloor at REGAB N was littered with empty and bro-ken shells of clams. Intermingled among the clam shells, high numbers of holothurians could be observed. Additional sampling of the bare sediments surrounding the clam patch (Clam N Env) and the bacterial mat (Bacter N Env) was also performed.
Two distinct types of megafauna assemblages dominated by either mussels or clams were detected in the southern part of REGAB (REGAB S; Fig. 2). The different megafauna patches were found close to each other (20–30 m), however in no occasion did they overlap. Uniquely, at this site (Mus-sel S) the mus(Mus-sels were surrounded by soft sediment, thus sampling was possible.Bathymodiolus sp. aff. boomerang
(Olu-Le Roy et al., 2007a) was the mussel patch-forming species. Within the mussel patch, individuals of the si-boglinid polychaetes –Escarpia southwardae(Andersen et al., 2004) were visible, as well as numerous shrimps and occasionally galatheid crabs. The investigated clam patch (Clam S) consisted ofChristineconcha regab(von Cosel and Olu, 2009) species buried in dark sediment. No shrimps were observed inhabiting the clams’ assemblages. The larger area of the surrounding sediment at the mussel patch was overlain with shell and tubeworm debris compared to the sediment in the vicinity of the clam patch. Two additional sites, lo-cated in the vicinity of the respective megafauna assemblages (Clam S Env and Mussel S Env) were investigated during this study.
Clams were the only chemosynthetic organisms form-ing assemblages in the southwestern part of REGAB (RE-GAB SW; Fig. 2). Distinctly, the sampled patch (Clam SW) at this part of REGAB was dominated by two species of vesi-comyid clams:Christineconcha regab (von Cosel and Olu, 2009) andLaubiericoncha chuni(Thiele and Jaeckel, 1931; von Cosel and Olu, 2009) immersed in very dark sediment. No other vagrant megafauna were noticed to dwell in the Clam SW clam site upon sampling. The sediment adjacent to the Clam SW Env was from one side covered by shell de-bris, and from the other more or less barren.
3.2 Biogeochemistry of different habitats at REGAB
3.2.1 Pore water geochemistry
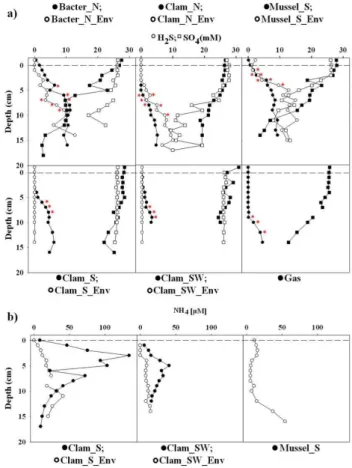
Pore water concentrations of sulphide varied substantially between different habitats of REGAB, both in terms of ranges as well depth profiles (Fig. 3a). The sulphide concen-tration increased with increasing sediment depth at most of the sampling sites. At the bacterial mat and the mussel habi-tat 0.1–2 mM of sulphide was detected already in the surface layers. At all investigated clam habitats, as well as the gas bubble site, sulphide was only detected below 3–9 cm sedi-ment depth (Fig. 3a). The maximum sulphide concentrations at the Mussel S and Bacter N sites reached 9 and 11 mM, which was almost two times higher (3–6 mM) compared to the maximum concentrations measured at any of the clam-populated sites. Comparison of the sulphide fluxes revealed similar patterns, with highest values measured at the Mus-sel S site, followed by slightly lower values at the Bacter N site (Table 2). The lowest sulphide fluxes (5–9 mmol m2d−1)
were associated with the clam patches (Clam N, Clam S, Clam SW) (Table 2). The bare sediment sites surrounding the mussel, Clam N and bacterial patches exhibited even higher ranges of sulphide fluxes, but at the Clam SW Env and Clam S Env sites no sulphide flux could be detected out-side the clam bed (Fig. 3a, Table 2).
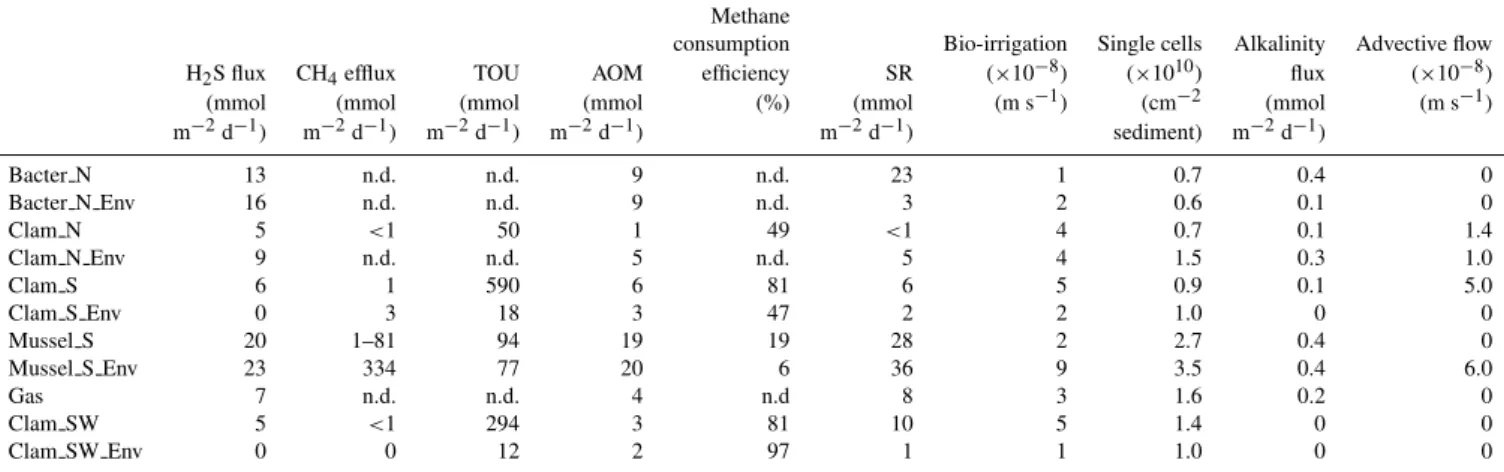
Table 2.Biogeochemical characterization of different habitats at REGAB. Maximum H2S flux in the sediment, CH4efflux, total oxygen
uptake (TOU), average integrated (0–10 cm sediment depth) anaerobic oxidation of methane (AOM) and sulphate reduction (SR) rates, methane consumption efficiency calculated as the percentage of methane consumption (AOM) from the total methane flux (AOM + CH4
efflux), total integrated (0–10 cm sediment depth) single cell numbers, as well as alkalinity flux and modelled values of bio-irrigation and advective flow.
Methane
consumption Bio-irrigation Single cells Alkalinity Advective flow H2S flux CH4efflux TOU AOM efficiency SR (×10−8) (×1010) flux (×10−8)
(mmol (mmol (mmol (mmol (%) (mmol (m s−1) (cm−2 (mmol (m s−1)
m−2d−1) m−2d−1) m−2d−1) m−2d−1) m−2d−1) sediment) m−2d−1)
Bacter N 13 n.d. n.d. 9 n.d. 23 1 0.7 0.4 0
Bacter N Env 16 n.d. n.d. 9 n.d. 3 2 0.6 0.1 0
Clam N 5 <1 50 1 49 <1 4 0.7 0.1 1.4
Clam N Env 9 n.d. n.d. 5 n.d. 5 4 1.5 0.3 1.0
Clam S 6 1 590 6 81 6 5 0.9 0.1 5.0
Clam S Env 0 3 18 3 47 2 2 1.0 0 0
Mussel S 20 1–81 94 19 19 28 2 2.7 0.4 0
Mussel S Env 23 334 77 20 6 36 9 3.5 0.4 6.0
Gas 7 n.d. n.d. 4 n.d 8 3 1.6 0.2 0
Clam SW 5 <1 294 3 81 10 5 1.4 0 0
Clam SW Env 0 0 12 2 97 1 1 1.0 0 0
sulphide at the respective sites, as well as the increase in al-kalinity (Fig. 3a). At the Bacter N and Mussel S sites low-est concentrations of only 2–3 mM were measured at 15– 16 cm sediment depth. In contrast, at all clam-populated sites sulphate penetrated deep into the sediment and substantial amounts (19–24 mM) were measured up to 17 cm sediment depth. Sulphate was not completely depleted at any of the investigated sites at REGAB (Fig. 3a). Most of the sulphate profiles at the bare sediment sites were similar to the ones measured within the megafauna patches. Exceptions were the Bacter N Env and Clam N Env sites, where minimum sul-phate concentrations of 17 and 10 mM were measured. The sulphate depth profile at the Gas site was similar to the clam patches where sulphate concentrations decreased only after 5 cm sediment depth. pH was around 7.6 in the cores, which did not show substantial degassing (see Supplement Fig. 1, also for other pore water constituents not further discussed here).
Ammonium was measured only at few of the investi-gated sites, due to restricted availability of pore water vol-umes (Fig. 3b). At both locations (REGAB S and RE-GAB SW), NH+4 concentrations were higher inside the clam patches (Clam S and Clam SW) relative to the adjacent bare sediment (Clam S Env and Clam SW Env). Moreover, within the clam patches ammonium was peaking in shal-lower depths (3–5 cm), while outside the patches ammonium steadily increased with depth. The ammonium content and depth distribution pattern at the Mussel S Env was similar to that of the bare sediment sites in the vicinity of the clam patches.
3.2.2 Rates of methane and sulphate consumption
The average integrated (0–10 cm) sulphate reduction (SR) rates measured at different habitats at REGAB confirmed the trend observed for the sulphide fluxes. The lowest rate of <1 mmol m−2d−1 was observed at Clam N, and the
high-est rate of 36 mmol m−2d−1at the Mussel S Env (Table 2).
Of the habitats populated by different chemosynthetic organ-isms, the Mussel S site exhibited highest average integrated SR rates of 28 mmol m−2d−1, followed by slightly lower
rates at the Bacter N (23 mmol m−2d−1) and lowest
inte-grated SR rates at the clam patches (<1–10 mmol m−2d−1).
SR rate depth patterns differed substantially among habi-tats, ranging from surface peaks (Clam S and Clam SW) to deep sediment maxima (Bacter N and Mussel S Env) (Sup-plement Fig. 2). The bare sediment sites had lower SR rates than the adjacent fauna-populated sites, except for the con-spicuous Clam N Env, where an average integrated SR rate of 4.5 mmol m−2d−1was detected. Sulphate reduction rates
at the Bacter N Env were an order of magnitude lower com-pared to the Bacter N site.
The average integrated (0–10 cm) rates of anaerobic oxi-dation of methane (AOM) matched well the corresponding SR rates, and for most of the habitats a 1 : 1 ratio between methane oxidized and sulphate consumed could be observed as predicted by the AOM stoichiometry (Boetius et al., 2000). As already observed when integrated SR rates and sulphide fluxes were compared among fauna-populated habitats, high-est integrated AOM average rates were measured at the Mus-sel S (19 mmol m−2d−1), followed by intermediate rates at
the Bacter N (9 mmol m−2d−1) sites and the lowest rates at
the clam patches (<1–6 mmol m−2d−1) (Clam N, Clam S,
(208 nmol cm−3d−1), mid-sediment peaks (4.5 cm) at the
Mussel S site (465 nmol cm−3d−1) and deep-sediment
max-ima (8.5 cm) at the Clam SW site (67 nmol cm−3d−1)
(Sup-plement Fig. 2). At the Clam N site the AOM rates remained low (<11 nmol cm−3d−1) throughout the whole investigated
sediment depth. The integrated average AOM rates of fauna-populated sites were similar to their adjacent bare sediment sites, despite the difference in the depth-distribution of AOM rates.
3.2.3 In situ fluxes of methane and oxygen
CH4 effluxes were hardly detectable with only <1–
3 mmol m−2d−1measured at the investigated clam habitats
– both inside and outside the clam patches (Table 2, see also Supplement Fig. 3). The opposite was true for the mussel-related site (Mussel S Env), where two orders of magnitude higher methane efflux was measured (334 mmol m−2d−1).
Within the mussel patch CH4 efflux varied substantially –
from 1 to 81 mmol m−2d−1(the lower value being measured
during the beginning of the incubation and the higher towards the end of the same 3 h benthic chamber incubation), most probably reflecting temporal variations in the seepage of methane during the period of incubation (Supplement Fig. 3). The REGAB megafauna contributed substantially to the benthic total oxygen uptake (TOU) measured at all fauna-populated sites (Table 2, see also Supplement Fig. 3). Within the clam patches TOU was on average one order of magnitude higher (50–590 mmol m−2d−1) relative to the
bare sediment sites (12–18 mmol m−2d−1). The TOU
mea-sured at the bare sediment site (Mussel S Env) adjacent to the mussel patch was approximately four times higher (70 mmol m−2d−1) than the other bare sediment sites, and
was almost as high as the TOU detected at the Mussel S site (94 mmol m−2d−1).
The Bacter N site had the highest Diffusive Oxygen Up-take (DOU; 13 mmol m−2d−1) and shallowest Oxygen
Pen-etration Depth (OPD; 2 mm) compared to other investigated sediment sites (Table 3, see also Supplement Fig. 4). The dif-fusive fluxes of oxygen determined on bare sediments were not uniform, and fluxes changed drastically in dependence on the vicinity of the measurement site to a clam patch. In gen-eral, measurements performed on bare sediment found more than 1 m away from a clam patch, showed deep OPD and low DOU (35–13 mm and 3 mmol m−2d−1, respectively), while
similar sites located app. 20 cm from a clam patch exhib-ited shallower OPD (2–3 mm) and much higher DOU (6– 11 mmol m−2d−1), most probably revealing hotspots of
ac-tivity in the surrounding of the clam patch.
Fig. 3.Geochemical depth profiles of sulphide (circles) and sul-phate (squares)(a), as well as ammonium(b)measured at the dif-ferent habitats at REGAB. Closed symbols denote measurements taken within the patches/bacterial mat, and open symbols denote measurements taken at the nearby bare sediments. Red star sym-bol (*) denotes the concentration gradients used for calculating the sulphide fluxes presented in Table 2.
3.3 Characterization of bacterial communities at
REGAB
3.3.1 Bacterial cell numbers
The number of single cells varied substantially among habi-tats at REGAB. The Mussel S site had up to two times higher (2.7×1010cm−2sediment) total integrated (0–10 cm)
cell counts compared to the other fauna-populated sites (0.7–1.4×1010cm−2 sediment) (Table 2). Unusually low
cell numbers were detected below the bacterial mat (0.7× 1010cm−2sediment). A sharp decrease in cell numbers with
Table 3.Sediment oxygen penetration depth (OPD) and diffusive oxygen uptake (DOU) of sediments in relation to the vicinity of clam patches and bacterial mat at REGAB, as measured in situ with a microprofiler.
Distance to clam OPD DOU (mmol patch/bacterial mat (mm) m−2d−1) Bacter N Env within bacterial mat 2 13 Clam S Env <1 m from clam patch 2 6 Clam SW Env <1 m from clam patch 3 11 Clam N Env >1 m from clam patch 35 3 Clam SW Env >1 m from clam patch 13 3
cell number integrated over depth (0.7×1010cm−2sediment)
compared to the Clam N Env site. The Mussel S Env was the site with highest cell numbers (3.5×1010cm−2sediment)
at REGAB.
3.3.2 Bacterial community structure
The analysis of occurrence, abundance and distribution of bacterial types at the REGAB cold seep was based on defin-ing operational taxonomic units (OTU) representdefin-ing rela-tively abundant bacterial populations as detected with the ARISA fingerprinting method (Brown and Fuhrman, 2005; Hewson and Fuhrman, 2006; B¨oer et al., 2009). Within indi-vidual habitats, all horizons sampled from the top 10 cm sed-iment depth shared on average only 30 % of the OTUs, with maximum similarity detected at the Gas site (40 %) and min-imum at the Mussel S (18 %). In general, no depth-related pattern in the OTU richness was observed, except for the mussel sites, Clam SW and Clam S Env which were asso-ciated with a decline in the percentage of shared OTUs with increasing depth. Overall 450 unique OTUs were detected across all 11 sites investigated here, with the maximum num-ber of unique OTUs per single site (401) in the top 10 cm layer at Bacter N, and the minimum number (252) at Mus-sel S Env. All OTUs occurred at least at 2 sites, and 24 % occurred at all sites. The megafauna and bacterial mat pop-ulated sites shared on average 74 % of their OTUs with the adjacent bare sediments (Supplement Table 2). In general the adjacent sites had more OTUs in common compared to more distant sites (Supplement Table 2). The percentage of shared OTUs among samples at the clam-populated sites was not significantly different from the shared OTUs among samples at the non-clam-populated sites (Mann-Whitney U-test for unmatched samples W=4, p=1) (Supplement Table 3). Finally, no clam habitat-specific bacterial signature was re-vealed, as shown by the comparison of shared OTUs by all clam patches versus the OTUs present at all other investi-gated sites at REGAB (Supplement Figs. 5 and 6).
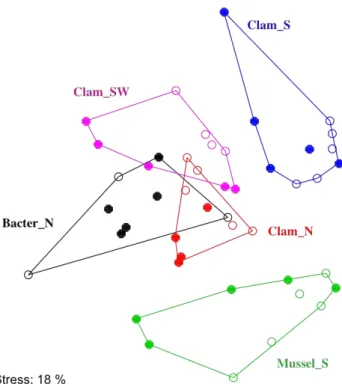
The bacterial community structure of samples from two adjacent sites i.e. samples from within a patch and samples from the respective adjacent bare sediment, grouped very
Fig. 4. Non-metric multidimensional scaling (NMDS) ordination plot (based on Bray Curtis distance matrix) of ARISA merged files (2–3 PCR replicates were pooled to form a consensus pro-file). Ordihull grouping of samples (0–10 cm) according to sam-pling location (samples from within the patches and the samples from the respective bare sediment were grouped together). NMDS stress 18 %. Open symbols denote samples from the bare sediment sites – outside of the respective patch; closed symbols denote sam-ples from within the respective patch.
close to each other, (Fig. 4), indicating high similarities be-tween the patches and the corresponding adjacent bare sed-iments (here defined as one habitat). Different habitats had different bacterial community structures (Table 4, Fig. 4). The mussel habitat, characterized by highest fluxes and con-sumption rates of methane and sulphate (Table 2), had a very distinct bacterial community structure, which was sig-nificantly different from all other sites (Fig. 4, Table 4). The bacterial mat habitat, where intermediate levels of geochem-ical fluxes were detected (Table 2) had a rather similar bac-terial community with the low-geochemical flux habitats, the Clam N and Clam SW habitats (Fig. 4, Table 4). Although all clam habitats had similar low fluxes (Table 2), it was shown that the Clam S habitat had a significantly different bacterial community structure from the other two clam habi-tats (Clam N and Clam SW) (Table 4, Fig. 4).
Bacterial β-diversity at REGAB was significantly and positively correlated to differences in CH4 effluxes among
Table 4.Analysis of Similarity (ANOSIM; lower triangle), testing for significant differences in bacterial community structure between habitats and percentage of shared OTUs between habitats (upper triangle). ANOSIM R-values (lower triangle) are interpreted as fol-lows:R <0.25 = strongly overlapping, 0.25< R <0.5 = separated but with overlap, 0.5< R <0.75 = separated with only minor over-lap,R >0.75 = strongly separated. *p <0.05, **p <0.01, ***
<0.001.
Bacter N Clam N Mussel S Clam S Clam SW
Bacter N – 92 77 80 87
Clam N 0.3 – 78 78 86
Mussel S 0.7** 0.6** – 70 76
Clam S 0.8*** 0.8*** 0.8*** – 78
Clam SW 0.5** 0.4* 0.8*** 0.7** –
and differences in integrated AOM and SR rates, as well as with differences in alkalinity fluxes, but not with variation in any other single pore water parameter (Table 5).
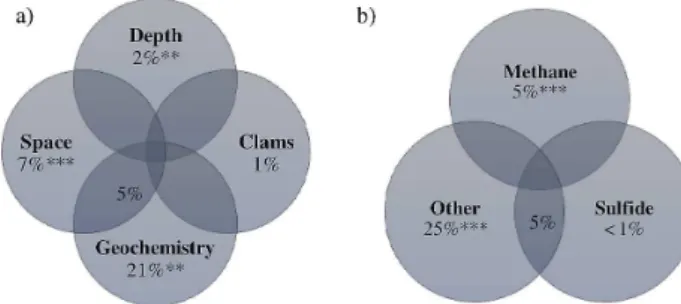
Variation partitioning analysis performed on the full data set, including all pore water concentrations and ARISA sam-ples from all sediment depths, showed that environmental variables comprised under “sediment geochemistry” (21 %, p=0.001), “space” (geographic distances among sites; 7 %, p=0.001), and “sediment depth” (0 to 10 cm, in 1 cm horizons) (2 %, p=0.012) explained most of the varia-tion in the bacterial community structure of REGAB habi-tats (Fig. 5a). The combined effect of “sediment geochem-istry” and “space” accounted for additional 5 % of the ob-served variations (Fig. 5a). Additional variation partition-ing analysis aimpartition-ing to disentangle the individual effects of the geochemical parameters considered above, revealed that methane sediment concentrations (5 %, p=0.001) signif-icantly explained the highest portion of the variability in the bacterial community at REGAB, including all sediment depth layers (Fig. 5b). In contrast, sulphide concentrations alone did not significantly account for the variation in the bacterial community, but the confounding effect with the other geochemical parameters explained 6 % of the observed diversity shifts (Fig. 5b). A small portion of the variation in the bacterial community structure at REGAB was related to shifts in alkalinity (1 %, p=0.038). Finally, the presence of clams had a very small direct overall effect, though not statistically significant, on the bacterial community struc-ture at REGAB (1 %,p=0.106) (Fig. 5a). Accordingly, the comparison of the community dispersions among the clam-populated sites and the adjacent bare sediment sites revealed no significant difference (Supplement Table 4).
4 Discussion
The giant pockmark REGAB is among the best-studied deep-water cold seeps in terms of biogeographical and geobiolog-ical processes shaping faunal communities (Sibuet and
Olu-Fig. 5.Variation partitioning analysis. Effect (%) of the geochem-istry (concentrations of CH4, H2S, Cl, Fe, Mn, PO4, SO4, pH),
clams presence (clams directly influence the top 6 cm sediment), space (geographic distance among sampling sites) and depth (sed-iment depth) on the bacterial diversity at REGAB(a). Geochem-istry, followed by space and depth, significantly shape the diversity at REGAB. Visualization of the individual influence of CH4 and
H2S on the bacterial community structure(b). Other=all
param-eters included in(a), excluding CH4and H2S individually. CH4
(p <0.001) significantly explains the variation in the ARISA data set. ***p <0.001, **p <0.002, *p <0.03. The complete model explained 36 % of the total variation in the bacterial diversity at RE-GAB.
Le Roy, 2002; Olu-Le Roy et al., 2007b; Sibuet and Van-griesheim, 2009; Cordes et al., 2010; Olu et al., 2010). On local scale, previous investigations have matched the distri-bution of the benthic communities to specific bottom water conditions indicative of methane seepage, and the presence of chemosynthetic megafauna (Olu-Le Roy et al., 2007a; Cambon-Bonavita et al. 2009; Olu et al., 2009; Van Gaever et al., 2009; Menot et al., 2010). This study combines a detailed biogeochemical description of the chemosynthetic megafauna habitats with their bacterial biodiversity, and shows that different biological habitats at REGAB are linked to distinct biogeochemical regimes and specific bacterial communities of the underlying sediment. The main aim was to evaluate the major factors shaping the structure of seep bacterial communities and to gain a better understanding of the complexity and heterogeneity of cold seep ecosystems caused by the interplay of geochemistry, faunal and micro-bial distribution.
4.1 Methane flux and its subsurface microbial consumption shapes habitats at the REGAB giant pockmark
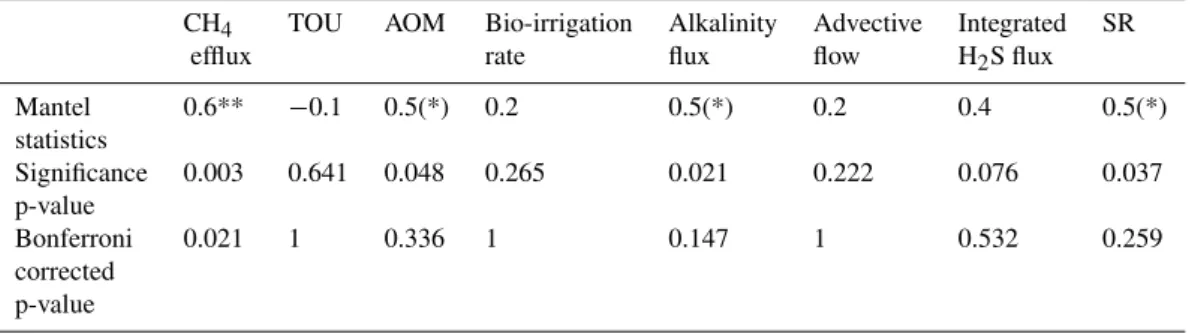
Table 5.Mantel test, checking for correlation betweenβ-diversity (calculated as Bray-Curtis dissimilarities) and difference in CH4efflux,
Total Oxygen Uptake (TOU), integrated Anaerobic Oxidation of Methane (AOM) and Sulphate Reduction (SR) rate, alkalinity flux, advective flow, integrated sulphide flux and bio-irrigation rate. The spearman rank coefficient was used for calculating correlations. * =p <0.01; Bonferroni correction was applied to correct for multiple testing. (*) only significant without Bonferroni correction. Mantel correlation test was performed on pooled ARISA samples (0–10 cm depth) according to habitat. For this analysis data from the following sites was used: Clam N, Mussel S, Mussel S Env, Clam S, Clam S Env, Clam SW, Clam SW Env.
CH4 TOU AOM Bio-irrigation Alkalinity Advective Integrated SR efflux rate flux flow H2S flux
Mantel 0.6** −0.1 0.5(*) 0.2 0.5(*) 0.2 0.4 0.5(*) statistics
Significance 0.003 0.641 0.048 0.265 0.021 0.222 0.076 0.037 p-value
Bonferroni 0.021 1 0.336 1 0.147 1 0.532 0.259 corrected
p-value
central carbonate cements (Fig. 2a). Previous investigations of deep water cold seeps have shown that free gas may es-cape from the seafloor within the gas hydrate stability zone, even at such high pressure and cold temperature as at RE-GAB (Suess et al., 1999; Fischer et al., 2012). Methane con-centrations in the bottom waters (10 cm above seafloor) were highest in the vicinity of the Mussel S Env (3.6 µM), around 0.4 µM at Clam S Env to and decreased to 0.2 µM at the clam habitat (Clam SW Env) furthest away from the central gas vents. These values fall into the low range of values de-tected previously on top of the respective megafauna patches (Duperron et al., 2005; Olu-Le Roy et al., 2007a).
For the first time we measured in situ methane fluxes from the sedimentary seafloor at REGAB using benthic cham-bers. Highest methane efflux and also highest methane con-sumption rates were found at the mussel habitat of REGAB (Mussel S and Mussel M Env). This Bathymodiolus type hosts higher abundance of methane-oxidizing than sulphur-oxidizing endosymbionts in the gills, and hence appears to depend mostly on methane as the main source of energy (Duperron et al., 2011). The methane and sulphate consump-tion rates in the sediments, as well as sulphide fluxes and to a certain extent TOU were 0.5–4 times higher compared to other habitats at REGAB. The high fluxes concomitantly supported up to 2 times higher numbers of bacterial cells at this site relative to the other habitats, and a dense colony of mussels interspersed with tubeworms (Fig. 2b). In a previous study at REGAB, Cambon-Bonavita et al. (2009) detected highest abundances of ANME/SRB aggregates – a microbial consortium shown to mediate AOM coupled to SR processes (Boetius et al., 2000), in the sediments inhabited by mus-sels. Despite the high AOM rates, the mussel habitat was the only site where extensive seepage of gaseous and dis-solved methane was observed, indicating substantial trans-port of methane to the bottom water. The AOM process re-moved only 6–20 % of the total upward diffusing methane. Accordingly, the highest bottom water methane
concentra-tions were also detected previously above mussel patches at REGAB (Charlou et al., 2004).
Sediments covered by bacterial mats, a common feature of many cold seeps (Treude et al., 2003; Niemann et al., 2006; Lessard-Pilon et al., 2010; Fischer et al., 2012; Gr¨unke et al., 2011), were rather scarce and restricted only to the northern part of REGAB. The sediment below the bacte-rial mat exhibited intermediate levels of AOM, SR rates and H2S fluxes, approximately 2 times higher than in the clam
patches, but lower relative to the mussel patch. At this habi-tat, SR rates differed by an order of magnitude and SR and AOM rate did not match well, probably reflecting substan-tial spasubstan-tial and temporal heterogeneity in the methane trans-port, as previously observed in relation with bacterial mats and other reduced habitats associated with hydrates (Treude et al., 2003; Lichtschlag et al., 2010b). However, both sites sampled within the bacterial mat habitat were characterized by low single cell counts in comparison to the other habi-tats at REGAB. In corroboration with our results, Cambon-Bonavita et al. (2009) found that ANME/SRB aggregates were the least abundant in the sediments covered by bacterial mat at the REGAB pockmark, which is a striking contrast to other cold seep settings (L¨osekann et al., 2007; Girnth et al., 2010).
geochemistry. These sediments were characterized by low-est CH4and SO4consumption rates, as well as lowest H2S
fluxes. Very little to no methane was escaping the sediment at the clam habitats, and AOM accounted for 50–80 % of the upward removal of methane. Lowest bottom water methane concentrations were also detected above clam patches dur-ing previous studies at REGAB (Olu-Le Roy et al., 2007a). A common feature of all clam habitats was the absence of sulphide from the topmost surface (up to 5 cm) sediment lay-ers. This appears to be a universal characteristics for clam beds at cold seeps, as it has been also shown for other seeps throughout the world i.e. Northern California Seeps (Levin et al., 2003) Cascadia Convergent margin seeps (Sahling et al., 2002), Monterey Bay cold seeps (Barry et al., 1997), Makran accretionary prism (Fischer et al., 2012). The bot-tom dwelling clams can exploit subsurface sulphide, allow-ing them to populate cold seeps of low geological activity, where methane and sulphide produced by AOM do not reach surface sediments (Fischer et al., 2012).
The gas bubble site (Gas) was the only other sedimentary site, apart from the mussel habitat, where escape of gas into the water column was observed. Although the AOM and SR rates, as well as sulphide fluxes were in the range of val-ues measured at the clam habitats, the gas bubble site was completely devoid of any visible megafauna. The relatively deep production of sulphide (>9 cm sediment depth) and the low surface methane concentrations can potentially limit the dispersal of megafaunal organisms, which for their survival need more or less constant supply of energy sources i.e. sul-phide and/or methane. It is possible that we had sampled a relatively fresh gas vent, which was not yet populated by the slow growing AOM communities transforming methane to sulphide and fuelling other chemosynthetic megafauna.
In this study we could show that the REGAB habitats differ in their methane efflux and pore water geochem-istry, and are associated with different types of megafauna. However, methane efflux was relatively similar between the megafauna patches and their direct surroundings. In con-trast, oxygen fluxes and oxygen penetration depths were dif-ferent between the bare sediments and those populated by bacterial mats. Based on the biogeochemical analyses done in our study, the sedimentary habitats at REGAB can be grouped in three categories: (i) mussel-associated sediments, characterized by highest methane efflux, methane consump-tion and bacterial counts; (ii) bacterial mat-associated sed-iments, characterized by intermediate activity and low bac-terial counts; and (iii) clam-associated sediments, character-ized by no methane efflux, intermediate methane consump-tion and bacterial counts. Overall, the megafauna distribuconsump-tion reflects well the underlying sediment characteristics. The dis-tribution patterns of the seep megafauna reflected methane fluxes and associated biogeochemical characteristics of the underlying seafloor. Thus megafauna assemblages are not only relevant indicators for the presence of seepage (Dando and Hovland, 1992), but also of local seepage activity, i.e. of
the magnitude of methane and oxygen fluxes, and of the depth of sulphide production within the sediments.
In general, the magnitude of the measured fluxes and geo-chemical processes at REGAB fell within the range of values previously reported from other gas hydrate- and carbonate-bearing cold seeps (Table 6). A striking exception is the to-tal oxygen uptake, detected within the dense clam patches at REGAB, which to our knowledge represents the highest oxygen consumption ever measured in a cold seep environ-ment (Table 6). The highest flux of dissolved methane at RE-GAB, detected at the mussel habitat, was in the range of maximum fluxes reported for bacterial mats at the Hydrate Ridge (Sommer et al., 2006), ampharetid polychaete habi-tats at the Hikurangi margin (Sommer et al., 2010) and the summit of Dvurechenskii Mud Volcano (DMV; Lichtschlag et al., 2010b; Table 6). AOM and SR rates can vary substan-tially among different cold seeps, but as well among different habitats within a single cold seep, as it is the case of the RE-GAB pockmark. The consumption of methane and sulphate at all investigated habitats at REGAB was quite low in com-parison to other cold seeps i.e. Hydrate Ridge (Treude et al., 2003), DMV (Lichtschlag et al., 2010b), respectively with ten and five times lower rates relative to maximum reported rates from other cold seeps (Table 6).
4.2 Methane flux influences bacterial community
structure at REGAB
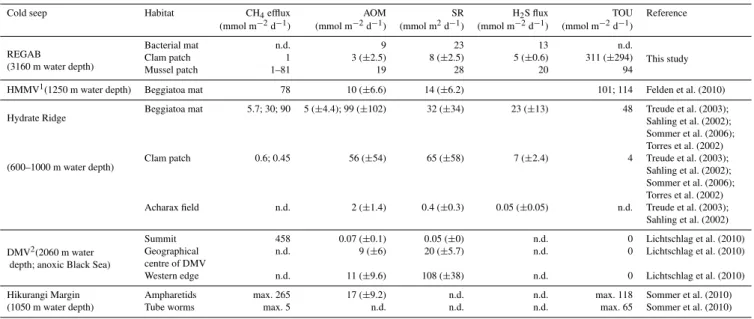
Table 6.Compilation of in situ CH4effluxes and total oxygen uptake (TOU), ex situ average integrated anaerobic oxidation of methane
(AOM) and sulphate reduction (SR) rates, as well as H2S fluxes from cold seep sites worldwide, including data from REGAB (this study).
Cold seep Habitat CH4efflux AOM SR H2S flux TOU Reference
(mmol m−2d−1) (mmol m−2d−1) (mmol m2d−1) (mmol m−2d−1) (mmol m−2d−1)
REGAB Bacterial mat n.d. 9 23 13 n.d. This study (3160 m water depth) Clam patch 1 3 (
±2.5) 8 (±2.5) 5 (±0.6) 311 (±294) Mussel patch 1–81 19 28 20 94
HMMV1(1250 m water depth) Beggiatoa mat 78 10 (±6.6) 14 (±6.2) 101; 114 Felden et al. (2010)
Hydrate Ridge Beggiatoa mat 5.7; 30; 90 5 (±4.4); 99 (±102) 32 (±34) 23 (±13) 48 Treude et al. (2003);Sahling et al. (2002); Sommer et al. (2006); Torres et al. (2002) (600–1000 m water depth) Clam patch 0.6; 0.45 56 (
±54) 65 (±58) 7 (±2.4) 4 Treude et al. (2003); Sahling et al. (2002); Sommer et al. (2006); Torres et al. (2002) Acharax field n.d. 2 (±1.4) 0.4 (±0.3) 0.05 (±0.05) n.d. Treude et al. (2003);
Sahling et al. (2002)
DMV2(2060 m water
Summit 458 0.07 (±0.1) 0.05 (±0) n.d. 0 Lichtschlag et al. (2010) depth; anoxic Black Sea)
Geographical n.d. 9 (±6) 20 (±5.7) n.d. 0 Lichtschlag et al. (2010) centre of DMV
Western edge n.d. 11 (±9.6) 108 (±38) n.d. 0 Lichtschlag et al. (2010) Hikurangi Margin Ampharetids max. 265 17 (±9.2) n.d. n.d. max. 118 Sommer et al. (2010) (1050 m water depth) Tube worms max. 5 n.d. n.d. n.d. max. 65 Sommer et al. (2010)
1H˚akon Mosby Mud Volcano 2Dvurechenskii Mud Volcano
One may assume that sulphide could biologically influ-ence a higher proportion of bacteria and animals compared to methane. Many types of bacteria can use sulphide as an energy source (Campbell et al., 2006; Sievert et al., 2007), and it is toxic to most animals (Bagarinao, 1992). How-ever, the bacterial β-diversity was not significantly corre-lated to difference in sulphide fluxes among habitats. Rather, methane flux was the most important factor structuring the bacterial communities at REGAB. Sulphide is a secondary energy source, provided via microbial methane consump-tion with sulphate, and it is possible that this indirect link to methane blurs potential relationships with diversity in-dicators. However, habitat types with similar biogeochem-istry/methane fluxes were generally more similar in terms of bacterial diversity as opposed to habitats with distinct geo-chemistry. The substantial methane flux, as well as the rela-tively high rates of AOM coupled to SR (Table 2) detected at the mussel patch selected for distinct bacterial communities. In contrast, sites characterized by low to intermediate rates of AOM coupled to SR and hardly detectable methane fluxes, such as those measured at the clam patches and the bacte-rial mat, had highly similar bactebacte-rial community structure. Similarly, previous studies have shown that the composition, distribution and densities of mega-, macro- and meiofauna at REGAB (Olu-Le Roy et al., 2007a; Olu et al., 2009; Van Gaever et al., 2009; Menot et al., 2010), as well as at other seeps (Sahling et al., 2008; Levin et al., 2010; Decker et al., 2011; Ritt et al., 2011; Fischer et al., 2012), are (in)directly linked to variations in the methane content, along with the oxygen inventory and the type of seafloor substrate.
A further analysis of the links between community struc-ture and concentrations of pore water constituents across all individual depth samples also confirmed a link betweenβ -diversity and sediment geochemistry (Fig. 5). Even when us-ing ex situ methane concentrations in the analysis (i.e. after degassing and depressurization of the cores upon retrieval), pore water methane concentrations explained the highest proportion of the variation in the bacterial community struc-ture. Again, sulphide concentrations could not explain any variation in the bacterial community structure, however, the confounding effect of this variable with the rest of the geo-chemical parameters accounted for a substantial portion of the variation in the community structure at REGAB, as did sediment depth and geographic distance between samples (Fig. 5). Geographic (spatial) distance among sampling sites and to lesser extent sediment depth of individual samples are two other variables that appeared to play a role in shaping the bacterial communities at REGAB. Of course, both are also coupled strongly to geological and geochemical processes, e.g. distance to gas seepage, or upward transport of highly re-duced pore water fluids to the sulphate or oxygen penetrated sediment surface layer, and their role in structuring bacterial diversity cannot be further disentangled in this study.
sedimentation to oligotrophic continental margins (Bienhold et al., 2012), and benthic primary productivity in coastal sands (B¨oer et al., 2009).
4.3 Link between megafauna, geochemistry and
bacterial community structure
A further aim of this study was to test whether the occurrence of the chemosynthetic megafauna, influences bacterial com-munity structure and the local geochemistry of the underly-ing sediments. It has previously been shown that chemosyn-thetic megafauna alters its local environment by bioturbation, bio-irrigation, burrowing and by exudates (Barry et al., 1997; Levin et al., 2003; Fischer et al., 2012). Clam respiration ac-counted for a substantial local increase (25–30 times) in the total benthic oxygen uptake rates, as compared to the adja-cent bare sediments (Table 2). At both Clam S and Clam SW sites roughly 96–97 % (calculated as the percentage of dif-ference in total oxygen uptake (TOU) between the clam pop-ulated and bare sediment sites) of the total oxygen uptake was due to clam respiration. Difference in the TOU measured among the clam sites (590 mmol m−2d−1at the Clam S and
294 mmol m−2d−1at the Clam SW) can most probably be
explained by the difference in clam density within the as-semblages, rather than by variations in the individual respi-ration rates (Decker et al., 2012). In contrast, mussels con-tributed only 18 % to the total oxygen uptake. In contrast to the clams, the Bathymodiolusmussels contain a high pro-portion of methanotrophic symbionts (Duperron et al., 2009, 2011; Petersen and Dubilier, 2009), causing a reduction of methane efflux within the mussel patch. If we assume that the difference in the methane effluxes between Mussel S (81 mmol m−2d−1) and Mussel S Env (334 mmol m−2d−1)
is due to the uptake by the mussels, they would consume approximately 12 times more methane (253 mmol m−2d−1)
than what is consumed via the process of anaerobic oxidation (AOM; 20 mmol m−2d−1) (see Table 2).
Similar to clam habitats at other cold seeps, sulphide was absent from the surface sediments at REGAB (Barry et al., 1997; Sahling et al., 2002; Levin et al., 2003; Fischer et al., 2012). Bottom water sulphate penetrated till 6 cm depth at all clam patches at REGAB. Such geochemical signature is usually ascribed to the dwelling activity of thiotrophic clams to access sulphide (Childress and Fisher, 1992), leading to a deeper sulphate penetration (Sahling et al., 2002; Cordes et al., 2005, 2010; Fischer et al., 2012). Furthermore, unusual and elevated ammonium concentrations were measured be-low the clam patches, where the maximum concentrations – indicating local production of ammonium, were observed within the depth range of the clam foot. Previous studies from the Gulf of Mexico cold seeps also showed that clam-associated sediments had very high ammonium concentra-tions (Joye et al., 2010). These results indicate a potential link between the clam presence and the NH+4 concentrations in pore water, most probably via local excretions of
metabo-lites by the clams, but further investigations are needed to de-cipher this relation. However, when comparing the structure of bacterial communities of adjacent sites at REGAB with and without chemosynthetic megafauna or bacterial mats, both methane fluxes and bacterial community structure were similar (Fig. 4, Table 2). Accordingly, no direct association of unique bacterial types with the different megafauna was detected. Even the dense clam patches had little effect on the bacterial community structure. This indicates that the abundant bacterial types in this cold seep ecosystem as de-tected by ARISA fingerprinting were directly affected by methane seepage and other geochemical processes, but only indirectly by the presence and absence of megafauna types. This finding may differ with high-resolution sampling target-ing, e.g. the surface of bivalves and their burrows, and with other types of molecular methods, which detect rare bacte-rial types. Furthermore, space played an important role in structuring the distribution and diversity of chemosynthetic megafauna and bacterial communities at spatial scales of me-ters to hundreds of meme-ters, which needs further investigation, especially when considering the need for conservation, pro-tection and management of cold seeps as unique deep-water ecosystems.
Supplementary material related to this article is available online at: http://www.biogeosciences.net/9/ 5031/2012/bg-9-5031-2012-supplement.pdf.
Acknowledgements. We thank the captain and crew of R/V
Meteorexpedition M76/2 GUINECO and the pilots of ROV Quest (MARUM) for their invaluable help with work at sea. Christina Bienhold, Rafael Stiens, Tomas Wilkop and Oluwatobi Oni are gratefully acknowledged for the sediment sampling onboard and Andr´e Gaßner, Jens Gr¨oger, J¨orn Tonnius and Christan Le Gall for help with pore water and methane analyses. We thank Volker Asendorf for his support with the in situ instruments. We are grateful to Gabi Sch¨ussler and Anne-Kathrin Saul for the help with biogeochemical rate and AODC measurements, respectively. We thank Karine Olu for discussions of the sampling strategy, Helene Ondr´eas for providing the REGAB map, and Stefanie Gr¨unke for help with processing. We further thank two anonymous reviewers for helping to improve this manuscript. This study was funded by the DFG (METEOR expedition), the Research Center/Cluster of Excellence “The Ocean in the Earth System” (MARUM) Project GB5 at the University Bremen) and the Max Planck Institute for Marine Microbiology, Bremen, Germany.
References
Anderson, M. J., Ellingsen, K. E., and McArdle, B. H.: Multivariate dispersion as a measure of beta diversity., Ecol. Lett., 9, 683–693, doi:10.1111/j.1461-0248.2006.00926.x, 2006.
Bagarinao, T.: Sulfide as an environmental factor and toxicant: tol-erance and adaptations in aquatic organisms, Aquat. Toxicol., 24, 21–62, 1992.
Barry, J. P., Kochevar, R. E., and Baxter, C. H.: The influence of pore-water chemistry and physiology on the distribution of vesi-comyid clams at cold seeps in Monterey for patterns of Bay: Implications chemosynthetic community organization, Limnol. Oceanogr., 42, 318–328, 1997.
Bienhold, C., Boetius, A., and Ramette, A.: The energy-diversity relationship of complex bacterial communities in Arctic deep-sea sediments, ISME J., 6, 724–732 doi:10.1038/ismej.2011.140, 2012.
Boetius, A. and Lochte, K.: Effect of organic enrichments on hy-drolytic potentials and growth of bacteria in deep-sea sediments, Mar. Ecol.-Prog. Ser., 140, 239–250, 1996.
Boetius, A., Ravenschlag, K., Schubert, C. J., Rickert, D., Wid-del, F., Gieseke, A., Amann, R., Jørgensen, B. B., Witte, U., and Pfannkuche, O.: A marine microbial consortium apparently me-diating anaerobic oxidation of methane, Nature, 407, 623–626, doi:10.1038/35036572, 2000.
Bohrmann, G., Greinert, J., Erwin, S., and Torres, M.: Authigenic carbonates from Cascadia Subduction Zone and their relation to gas hydrate stability, Geology, 26, 647–650, 1998.
Borcard, D., Legendre, P., and Drapeau, P.: Partialling out the spatial component of ecological variation, Ecol. Soc. Am., 73, 1045– 1055, 1992.
Bray, R. J. and Curtis, J. T.: An ordination of upland forest commu-nities of southern Wisconsin, Ecol. Monogr., 27, 325–349, 1957. Brown, M. V. and Fuhrman, J. A.: Marine bacterial microdiversity as revealed by internal transcribed spacer analysis, Aquat. Mi-crob. Ecol., 41, 15–23, doi:10.3354/ame041015, 2005.
B¨oer, S. I., Hedtkamp, S. I. C., Beusekom, J. E. E. V., Fuhrman, J. A., Boetius, A., and Ramette, A.: Time- and sed-iment depth-related variations in bacterial diversity and com-munity structure in subtidal sands, ISME J., 3, 780–791, doi:10.1038/ismej.2009.29, 2009.
Cambon-Bonavita, M. A., Nadalig, T., Roussel, E., Delage, E., Duperron, S., Caprais, J. C., Boetius, A., and Sibuet, M.: Diver-sity and distribution of methane-oxidizing microbial communi-ties associated with different faunal assemblages in a giant pock-mark of the Gabon continental margin, Deep-Sea Res. Pt. II, 56, 2248–2258, doi:10.1016/j.dsr2.2009.04.007, 2009.
Campbell, B. J., Engel, A. S., Porter, M. L., and Takai, K.: The ver-satile epsilon-proteobacteria: key players in sulphidic habitats., Nature Rev. Microbiol., 4, 458–468, doi:10.1038/nrmicro1414, 2006.
Cardinale, M., Brusetti, L., Quatrini, P., Borin, S., Puglia, A. M., Rizzi, A., Zanardini, E., Sorlini, C., Corselli, C., and Daffon-chio, D.: Comparison of Different Primer Sets for Use in Auto-mated Ribosomal Intergenic Spacer Analysis of Complex Bac-terial Communities, Appl. Environ. Microb., 70, 6147–6156, doi:10.1128/AEM.70.10.6147-6156.2004, 2004.
Charlou, J. L., Donval, J. P., Fouquet, Y., Ondreas, H., Knoery, J., Cochonat, P., Levach´e, D., Poirier, Y., Jean-Baptiste, P., Fourr´e, E., Chazallon, B., and The Zairov Leg 2 Scientific Party:
Physi-cal and chemiPhysi-cal characterization of gas hydrates and associated methane plumes in the Congo–Angola Basin, Chem. Geol., 205, 405–425, doi:10.1016/j.chemgeo.2003.12.033, 2004.
Childress, J. J. and Fisher, C. R.: The biology of hydrothermal vent animals: physiology, biochemistry, and autotrophic symbioses, Oceanogr. Mar. Biol., 30, 337–441, 1992.
Clarke, K. R.: Non-parametric multivariate analysis of changes in community structure, Aust. J. Ecol., 18, 117–143, doi:10.1111/j.1442-9993.1993.tb00438.x, 1993.
Cline, J. D.: Spectrophotometric determination of hydrogen sulfide in natural waters, Limnol. Oceanogr., 14, 454–458, 1969. Cordes, E. E., Arthur, M. A., Shea, K., Arvidson, R. S., and
Fisher, C. R.: Modeling the mutualistic interactions between tubeworms and microbial consortia., PLoS Biology, 3, e77, doi:10.1371/journal.pbio.0030077, 2005.
Cordes, E. E., Cunha, M. R., Gal´eron, J., Mora, C., Olu-Le Roy, K., Sibuet, M., Van Gaever, S., Vanreusel, A., and Levin, L. A.: The influence of geological, geochemical, and biogenic habi-tat heterogeneity on seep biodiversity, Mar. Ecol., 31, 51–65, doi:10.1111/j.1439-0485.2009.00334.x, 2010.
Dando, P. R. and Hovland, M.: Environmental effects of sub-marine seeping natural gas, Cont. Shelf Res., 12, 1197–1207, doi:10.1016/0278-4343(92)90079-Y, 1992.
de Beer, D., Sauter, E., Niemann, H., Kaul, N., Foucher, J.-P., Witte, U., Schl¨uter, M., and Boetius, A.: In situ fluxes and zonation of microbial activity in surface sediments of the H˚akon Mosby Mud Volcano, Limnol. Oceanogr., 51, 1315–1331, 2006.
Decker, C., Morineaux, M., Van Gaever, S., Caprais, J.-C., Lichtschlag, A., Gauthier, O., Andersen, A. C., and Olu, K.: Habitat heterogeneity influences cold-seep macrofaunal commu-nities within and among seeps along the Norwegian margin. Part 1: macrofaunal community structure, Mar. Ecol., 33, 205–230, doi:10.1111/j.1439-0485.2011.00503.x, 2011.
Decker, C., Caprais, J.-C., Khripounoff, A., and Olu, K.: First res-piration estimates of cold-seep vesicomyid bivalves from in situ total oxygen uptake measurements, C. R. Biol., 335, 261–270, doi:10.1016/j.crvi.2012.03.002, 2012.
Duperron, S., Nadalig, T., Caprais, J.-C., Sibuet, M., Fiala-Medioni, A., Amann, R., and Dubilier, N.: Dual Symbiosis in a Bathy-modiolus sp. mussel from a Methane Seep on the Gabon Con-tinental Margin (Southeast Atlantic): 16S rRNA Phylogeny and Distribution of the Symbionts in Gills, Appl. Environ. Microb., 71, 1694–1700, doi:10.1128/AEM.71.4.1694-1700.2005, 2005. Duperron, S., Lorion, J., Samadi, S., Gros, O., and Gaill, F.:
Sym-bioses between deep-sea mussels (Mytilidae: Bathymodiolinae) and chemosynthetic bacteria: diversity, function and evolution., C. R. Biol., 332, 298–310, doi:10.1016/j.crvi.2008.08.003, 2009. Duperron, S., Guezi, H., Gaudron, S. M., Pop Ristova, P., Wenzh¨ofer, F., and Boetius, A.: Relative abundances of methane-and sulphur-oxidising symbionts in the gills of a cold seep mus-sel and link to their potential energy sources, Geobiology, 9, 481– 491, doi:10.1111/j.1472-4669.2011.00300.x, 2011.
Felden, J., Wenzh¨ofer, F., Feseker, T., and Boetius, A.: Transport and consumption of oxygen and methane in different habitats of the H˚akon Mosby Mud Volcano (HMMV), 2010.