Revista Brasileira de Geof´ısica (2006) 24(3): 307-318 © 2006 Sociedade Brasileira de Geof´ısica ISSN 0102-261X
www.scielo.br/rbg
SPATIAL DISTRIBUTION OF GROUNDWATER SALINITY AT PERGAMINO – ARRECIFES ZONE
(BUENOS AIRES PROVINCE, ARGENTINA)
Claudia M. Sainato
1and Beatriz N. Losinno
2Recebido em 27 abril, 2006 / Aceito em 31 agosto, 2006 Received on April 27, 2006 / Accepted on August 31, 2006
ABSTRACT.The application of irrigation at the NE of Buenos Aires Province, Argentina, demands the knowledge of groundwater features, in particular salinity, in order to avoid unsuccessful drillings and to prevent from deterioration of soils. Some previous large scale studies have shown the presence of salty groundwater at different depths at close sites, and well information is scarce. The scope of this work is to determine the depth and thickness of the aquifers of the zone and to obtain the spatial distribution of groundwater salinity. Vertical Electrical Soundings were performed and the continuity of the aquifers was analyzed along four transects integrating previous results. Geostatistical methodology was used to obtain the spatial variability of electrical resistivity of the Pampeano aquifer, which increases to the east. This analysis was also performed to determine the depth of the fresh-salty water interface which deepens at the left margin of Pergamino river and to the SE direction. A transition zone was found, at SE of the study area, west of Arrecifes city, where the fresh salty water interface and the water table level deepens abruptly.
Keywords: groundwater salinity; Buenos Aires Province (Argentina), spatial variability, geoelectrical soundings.
RESUMO.A aplicac¸˜ao da irrigac¸˜ao no Nordeste da Prov´ıncia de Buenos Aires, Argentina, requer o conhecimento das caracter´ısticas da ´agua subterrˆanea, em particular a salinidade, para evitar perfurac¸˜oes infrut´ıferas e deteriorac¸˜ao do solo. Alguns estudos pr´evios em grande escala tem mostrado a presenc¸a da ´agua subterrˆanea salina em diferentes profundidades em locais pr´oximos, e a informac¸˜ao sobre perfurac¸˜oes ´e escassa. O objetivo do trabalho ´e a determinac¸˜ao da profundidade e espessura dos aq¨u´ıferos da zona e obter a distribuic¸˜ao espacial da salinidade da ´agua subterrˆanea. Foram realizadas Sondagens El´etricas Verticais e a continuidade dos aq¨u´ıferos foi analisada ao longo de quatro “transectas” integrando resultados pr´evios. A metodologia geo-estat´ıstica foi usada para obter a variabilidade espacial da resistˆencia el´etrica do aq¨u´ıfero Pampeano que aumenta para Leste. Esta an´alise tamb´em foi realizada para determinar a profundidade da interface da ´agua doce-´agua salina, a qual, se aprofunda pela margem esquerda do Pergamino e segue na direc¸˜ao sudeste. Encontrou-se uma zona de transic¸˜ao no sudeste da ´area do estudo, a oeste da localidade de Arrecifes, onde a interface ´agua doce-´agua salina e o n´ıvel fre´atico se aprofundam abruptamente.
Palavras-chave: salinidade da ´agua subterrˆanea, Prov´ıncia de Buenos Aires, distribuic¸˜ao espacial, Sondagens El´etricas Verticais.
C´atedra de F´ısica, Facultad de Agronom´ıa, Universidad de Buenos Aires, Av. San Mart´ın 4453 (1417DSQ), Buenos Aires, Argentina. 1E-mail: [email protected]
INTRODUCTION
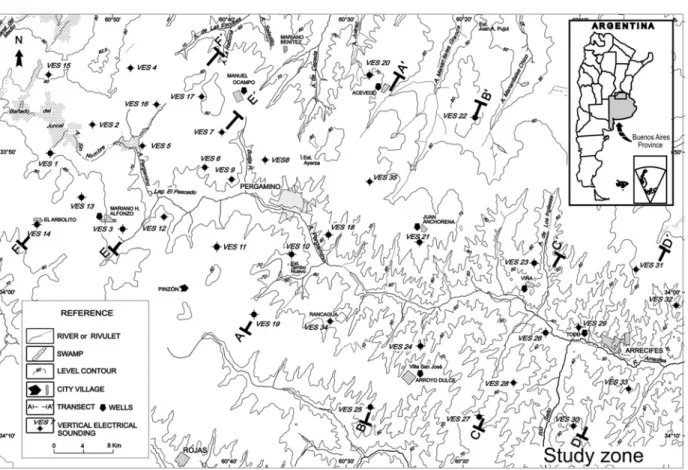
The study area is placed at the NE of Buenos Aires Province, Ar-gentina, the so-called Humid Pampa (Figure 1). This is a very rich agriculture zone where groundwater resources are used for irrigation and for animal and human consumption. The incre-asing application of irrigation may cause the sustainable deve-lopment of the resource to run a risk if the characteristics of groundwater are not well known. The recharge of Pergamino river, which flows to the Arrecifes river, takes place at the area of Juncal swamp. The most recent and shallow hydrogeological Formations are the sandy Puelche Formation (Upper Tertiary-Quaternary) and the silty-clayey and clayey-silty sediments of the Pampeano For-mation (Quaternary) and the Post-Pampeano (Santa Cruz, 1994). The Pampeano unit contains the phreatic aquifer and some de-eper semiconfined aquifers with low salinity water. The Puelche sands have variable water salinity depending on the zone (Santa Cruz, 1987) with saline residual values greater than 2 g L−1near
Pergamino and lower than 0.5 g L−1at the Arrecifes zone. The
transition between fresh and salty water is an interface, within the Pampeano or the Puelche aquifer, which was found between 50 and 100 m depth near Pergamino zone. These are regional re-sults which do not represent the local variations within the Per-gamino river basin. Sainato et al. (2003) carried out seventeen Vertical Electrical Soundings (VES) at the NW zone of Figure 1 (VES 1 to 17). At the west of Pergamino city, the top of a highly conductive layer identified with the fresh-salty water interface was found below 28 m depth at the right margin of Pergamino river and at 60 m depth at the left one, deepening towards NE. Simi-lar results were found through Audio Magnetotelluric soundings (Sainato et al., 2000) indicating the deepening of the fresh-salty water interface in the same direction. The recharge of free aqui-fer coincides with high topographic levels while the discharge is mainly towards the Pergamino river. Groundwater electrical con-ductivity is greater than1800µS cm−1at discharge zones with
fine texture soils or, at some places, where the hydraulic gradient is very small, increasing water time of residence. Water of lower salinity may be found at the recharge areas or at transition zones with moderate hydraulic gradient. Variations in the sedimentary sequence were found at near sites, so it is of interest to know if these lateral discontinuities are present over a larger zone. Since the Pampeano and Puelche aquifers are the main source of water in this rural area, one of the points to avoid unsuccessful drillings and upraise of saline water is to know the depth to the fresh-salty water interface.
At the study area, there are no references of geological
sec-tions and there are a few wells whose lithological descripsec-tions were used for geophysical interpretation. The scope of this work is to determine the depth and thickness of the aquifers at the Pergamino-Arrecifes zone, integrating previous results, and ob-tain the spatial distribution of groundwater conductivity.
In order to understand the regional features of these aquifers it was necessary to perform new VES at the SE zone (near Arre-cifes city), covering the whole area of the hydrogeological basin of Pergamino river. It is interesting to know whether there is a correlation in the behavior of the aquifer properties over a larger area.
An increasing amount of literature is devoted to geostatistical analysis (Trangmar et al., 1985) applied to variables spatially de-pendant, such as soil properties and geological features. Marinho & Vasconcelos (2001) used geostatistical techniques to describe 1D geoelectrical sections. Sun et al. (1995) determined 3-D dis-tribution of hydraulic conductivity and storage coefficient using geostatistics. The geostatistical analysis is based on the spatial correlation that a variable may have over an area, making use of it to interpolate values of the variables where no data are available. Under the hypothesis that the aquifer depth and conductivity may have such a correlation, this approach was applied in this paper to analyze the spatial distribution of them.
GEOLOGICAL AND HYDROGEOLOGICAL SETTING
The study area is located at the Humid Pampa, at the NE of Buenos Aires Province, at the sub region called Rolling Pampa (Figure 1). It was delimited by the superficial water division of the Pergamino river microbasin, which belongs to the basin of Arrecifes river. The Pergamino river has its recharge at 80 m. a.s.l. at the Jun-cal swamp, and its superficial drainage direction is SE, with some streams that flow into it.
CLAUDIA M. SAINATO and BEATRIZ N. LOSINNO
309
Figure 1– Study area. Sites of VES and wells are shown. Transects for geoelectrical sections are pointed out.
very variable, between 20 and 120 m. Below, the Puelche aqui-fer is formed by sands, having bad quality water beyond 25 km to the west of Pergamino city decreasing its salinity towards the Arrecifes zone (to the east). The transition from fresh water to the underlying salty water is known as an interface within the Pampe-ano or Puelche aquifer depending on the zone (Santa Cruz & Silva Busso, 1995). This transition or interface is associated with a de-crease of resistivity in the geoelectrical soundings (Santa Cruz, 1987, Sainato et al., 2003). The depth of the top of the Puel-che aquifer was found near Pergamino at 50-100 m. The aquifer recharge is local and produced by precipitation, being the main discharge towards rivers, streams or swamps.
Below, the Tertiary marine sediments of the “Mioceno Verde” Formation (Upper Miocene) contain very saline water, in general. Underlying, the “Mioceno Rojo” Formation of continental origin is placed with aquifer levels with variable salinity. This sedimentary sequence lies over the Mesozoic low permeability hydrogeologi-cal basement.
Yrigoyen (1975) showed through geological sections in tran-sects situated at several zones of Buenos Aires Province,
diffe-rent depths of the hydrogeological formations at close sites, which were attributed to the presence of faults that affected the more re-cent and shallow formations. Amato (1998) offered another inter-pretation related with the presence of paleochannels, produced by the Parana river, that generate great variations of thickness in the Puelche Formation within a few kilometers of distance. The isoli-nes of the depth of its top have a regular and mild shape while the base has a more irregular form.
GEOELECTRICAL PROSPECTING
VES methodology
At the study zone of Pergamino-Arrecifes, a set of VES were car-ried out with an adequate distribution of sites in order to have a good description of the basin.
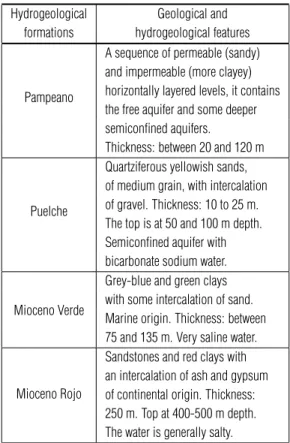
Table 1– Geological and Hydrogeological setting.
Hydrogeological Geological and formations hydrogeological features
Pampeano
A sequence of permeable (sandy) and impermeable (more clayey) horizontally layered levels, it contains the free aquifer and some deeper semiconfined aquifers.
Thickness: between 20 and 120 m
Puelche
Quartziferous yellowish sands, of medium grain, with intercalation of gravel. Thickness: 10 to 25 m. The top is at 50 and 100 m depth. Semiconfined aquifer with bicarbonate sodium water.
Mioceno Verde
Grey-blue and green clays with some intercalation of sand. Marine origin. Thickness: between 75 and 135 m. Very saline water.
Mioceno Rojo
Sandstones and red clays with an intercalation of ash and gypsum of continental origin. Thickness: 250 m. Top at 400-500 m depth. The water is generally salty.
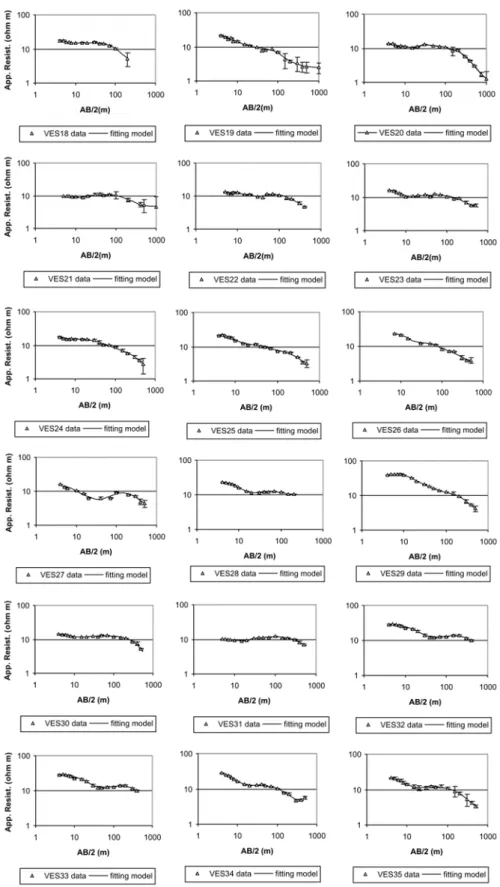
For these soundings, distances AB up to 1000 m at some si-tes and to 2000 m at other ones were reached. Models of elec-trical resistivity of the earth varying with depth (horizontally laye-red medium 1D), were proposed for each site of sounding, whose response of apparent resistivity fitted the experimental data in a least square sense. All sites were modeled with the 1D inversion code of Bobachev et al. (2001). Curves of observed apparent resistivity as a function of the half distance between current elec-trodes (AB/2), together with the curves of the fitting model are shown in Figure 2, for the new sites (fitting error around 5% in average). The continuity of the different layers found in 1D mo-dels was analyzed along four transects AA’, BB’, CC’, DD’, cros-sing the Pergamino river at the central and eastern part of the zone (see Figure 1). Electrical sections from transects EE’ and FF’ were previously obtained by Sainato et al. (2003). Error interval for the model parameters was evaluated through equivalence princi-ple analysis. The sounding interpretation was based on well data (SPAR, 1999) from towns near some VES sites: Acevedo (VES20), Anchorena (VES21), A. Dulce (VES24), Todd (VES29).
VES Results and discussion
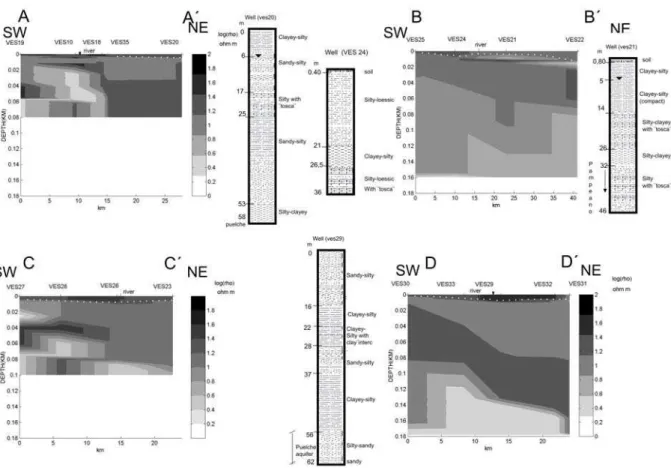
Figure 3 shows the resistivity distribution below each site along transects AA’, BB’, CC’, DD’. For all of them, the first layer re-presents the unsaturated zone while a decrease in resistivity for the second layer indicates the top of the Pampeano aquifer (wa-ter table). Below, the changes in resistivity are strongly influen-ced by water quality since there are no great changes in litho-logy. However, the presence of calcium carbonate intercalations (“tosca”) (Sala & Rojo, 1994) as nodules or continuous plates may increase the layer resistivities. A high conductivity layer is placed at depth at almost all the sites. Uncertainties in model pa-rameters showed that the Pampeano resistivity has the lowest re-lative error (in average 1.7%), being of about 6.3% for the depth to the highly conductive layer. The water table depth was the pa-rameter determined with less accuracy.
Transect AA’
In this transect, unsaturated soil has resistivities varying between 14 and 23 ohm m, with clayey-silty sediments according to well at site of VES20. The water table is between 2.5 and 5 m depth, and free groundwater has an average resistivity of 7.5 ohm m (with sandy-silty sediments) followed by a more resistive layer with lar-ger content of silt and sand and lower water salinity. A highly conductive layer (near 3 ohm. m) with larger content of clays (re-vealed by well data), is at approximately 25 m depth on the right margin and beyond 80 m depth at the left one. It may indicate the presence of the fresh-salty water interface.
Transect BB’
At this transect, the unsaturated zone (a set of thin layers with clayey-silty sediments according to wells at sites of VES21 and VES24) has an average resistivity of 14 ohm m. Free groundwater has a resistivity of around 9 ohm. m at a depth between 2 and 12 m. Underlying, there is a more resistive layer (13.5 ohm m in average) predominantly of silty-loessic type with “tosca” accor-ding to wells. The highly conductive layer was found beyond 140 m depth at the right margin of Pergamino river and with variable depth (greater than 80 m approximately) at the left margin.
Transect CC’
CLAUDIA M. SAINATO and BEATRIZ N. LOSINNO
311
Figure 3– Electrical resistivity sections obtained from VES models through transects AA’, BB’, CC’ and DD’. Shading scale indicates log(rho: resistivity) in ohm m and the white dotted line is the limit between the unsaturated and saturated zone.
than 6 ohm m) has variable depth at the SW (right margin) and it is placed beyond 80 m depth at the left margin.
Transect DD’
In this transect, unsaturated zone has resistivity values around 22 ohm m (with sandy-silty sediments according to well at site of VES29). Water table is between 3 and 8 m depth. Below, free groundwater correlates with a 10 ohm m layer (clayey-silty sedi-ments). The lower levels of the Pampeano aquifer, correlated with sandy-silty or clayey-silty sediments with intercalations of sands or “tosca”, has a quite homogeneous resistivity around 12 ohm m. From well data, the top of the Puelches sands is placed at 56 m depth, and up to 70 m depth with low salinity. In the geoelectrical model of VES29, a layer of approximately 12 ohm m of resistivity is present up to 154 m depth. Below, the top of the highly conduc-tive layer must be associated with the fresh-salty water interface which in this case may be within the Puelches sands or even at the Miocene Formation.
Summarizing the results of these four transects, below the
un-saturated zone, the Pampeano has the phreatic aquifer in its upper part being more conductive (may be with more contents of salts) than the lower levels which are exploited for agricultural and hu-man use.
At greater depths, there is a highly conductive layer, asso-ciated with high salinity, whose top is placed at different depths at both margins. Low values of resistivity (less than 5 ohm m) may be attributed to the increase of water salinization since the underlying Puelche aquifer is composed by sands.
It is well known, that at the west of the study zone, the Puel-che aquifer may have salinity (Santa Cruz, 1987). The top of the conductive layer, then, may be the top of this aquifer and would represent the fresh-salty water interface (Sainato et al., 2003). Due to the lack of well information at such depth at the east of Perga-mino, it is not possible to confirm wether the top of this conductive layer is placed within the Puelche aquifer or if it is the top of the Mioceno Verde Formation.
CLAUDIA M. SAINATO and BEATRIZ N. LOSINNO
313
CC’ and DD’ the difference in the interface depth between the right and left margin is around 20 m. There is also a tendency for the interface in transects EE’ and FF’, to be slightly deeper at the left margin (Sainato et al., 2003).
This difference in the depth of the conductive layer may be an evidence of structural control. Geological cross-sections at dif-ferent places at the Buenos Aires Province have shown fractures which have caused stratigraphic throw in the Mioceno Verde and the Mioceno Rojo Formations (Yrigoyen, 1975). This author sug-gests that there has been reactivation of some faults which affected the more recent and shallower formations.
Another interpretation (Amato, 1998) would be related to the existence of deep ancient channels (paleo channels) that produ-ced variations in the thickness of the Puelches Formation between sites separated by a few kilometers. In addition, wells located at the city of Pergamino (Pergamino Municipality, personal commu-nication) on both margins of the river have shown different depths to the fresh-salty water interface.
The top of this interface deepens, in general, to the NE and SE, as it is observed from the depths obtained from the transects.
GEOSTATISTICAL ANALYSIS
Methodology. Theoretical background
In order to analyse the spatial correlation of some aquifer proper-ties and to obtain the areal distribution of them within the study area a geostatistical approach was applied.
The spatial dependence is described by the semivariograms (Trangmar et al., 1985). Let ’s bez(x)andz(x+h)the values of a property sampled at positionsxandx+h, beingha distance, known as lag, which separates both positions. The semivariance is defined as
γ (h)= 1 2n(h)
n(h)
i=1
[z(xi)−z(xi+h)]2
wheren(h)is the number of pairs of observations separated by a distance ofh. The maximum lagh used for the semivariance calculation is usually taken as half the maximum dimension of the study area.
The semivariogram, which is the plot of the semivariance ver-sush, in some cases increases withh reaching an asymptotic value (sill) at a distancehequal to the so called rangea. Values of the properties at sites separated by a distance shorter than the range will be spatially correlated. The range depends on the scale of the study and on the property evaluated. The value of the semi-variogram whenh =0is the nugget variance and is a measure
of the experimental error or the microvariability of the property not detected at the sample distance. When the sill is equal to the nug-get variance, the variable is considered to be spatially independent and aleatory (pure nugget effect). The nugget variance expres-sed as a percentage of the sill (N/S%) allows a relative evaluation of the nugget effect in the analysed property. Cambardella et al. (1994) used this relationship to define different types of spatial dependence of soil variables: if the rate is less than 25% the vari-able is considered strongly spatially dependent, if it lies between 25 and 75% the variable is moderately dependent while if it is greater than 75% it is considered weakly spatially dependent.
Aquifer properties, such as the bulk resistivity of the Pampe-ano aquifer, the water table level and the depth of the fresh-salty water interface were supposed to have a spatial correlation. Semi-variograms were estimated for these properties modelling them, using Geo-EAS (1988) software, in order to obtain the parameters: range, sill and nugget variance for evaluating the spatial correla-tion of these variables.
The areal distribution of these properties may be considered by an interpolation calledkriging. The range of the semivariogram is associated with the maximum distance for this interpolation. The kriging provides an unbiased estimate of minimum variance where the value of the property at each point in a grid is estimated as a lineal combination of neighbouring sites.
Ifz(x1),z(x2), . . .z(xn)are the values of the property
me-asured atxi, withi = 1. . .n, the estimation of the value at a
pointxis:
z(x)=λ1z(x1)+λ2z(x2)+. . . λnz(xn)
The coefficientsλi are calculated searching an unbiased
es-timator ofzwith minimum variance (Webster, 1985).
Maps of isolines of the properties previously mentioned were carried out taking into account their semivariogram parameters. A cross validation analysis of the krigged results was performed to evaluate the accuracy of the estimations. Figure 4 shows the semivariograms for:
– the bulk resistivity of the Pampeano aquifer obtained from VES models at depths where water extraction takes place, according to well information (a).
– the depth of the fresh-salty water interface from surface (b).
Figure 4–a.Semivariogram of bulk resistivity of the Pampeano aquifer (at nearly 25–30m depth ) obtained from VES and fitting model.b.Semivariogram of depth to fresh-salty water interface obtained from VES and fitting model.c. Semivariogram of water table level (a.s.l.) obtained from VES and fitting model.
Geostatistical results and discussion applied to some aquifer characteristics
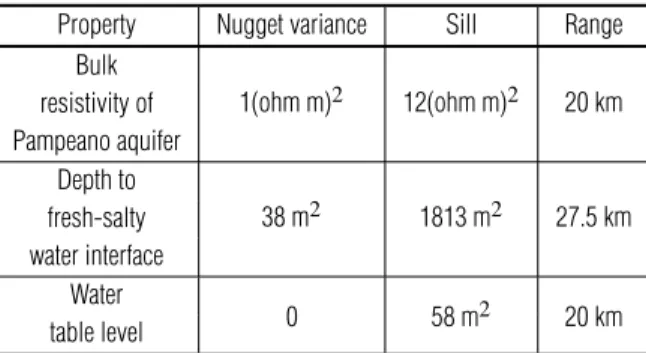
Table 2 summarizes the parameters obtained from the modelling of semivariograms.
Table 2– Parameters obtained from modeling of semivariograms.
Property Nugget variance Sill Range Bulk
1(ohm m)2 12(ohm m)2 20 km
resistivity of Pampeano aquifer
Depth to
38 m2 1813 m2 27.5 km fresh-salty
water interface Water
0 58 m2 20 km
table level
The parameters for the bulk resistivity of the Pampeano aqui-fer were obtained with a spherical model (fitting error of 1.9%), with a range of 20 Km, and a rate between nugget variance and sill (N/S%) of about 8%, which means a strong spatial depen-dence, according to Cambardella et al. (1994).
For the depth of the fresh-saline water interface, the spheri-cal fitting (fitting error 2.7%) gave a range of 27.5 km and a rate N/S% of about 2%, meaning a very strong spatial dependence of this depth.
For the water table level an exponential fitting (fitting error 1.4%) showed a range of 20 Km, with very little N/S% rate indi-cating a strong spatial dependence of this variable.
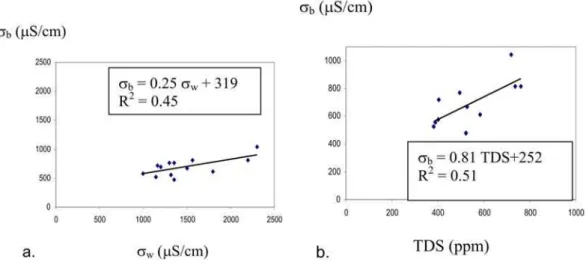
The relationship between the bulk conductivity of a layer and the water conductivity filling the pores is stated through several equations being the most commonly known as the Archie’s law (Archie, 1942):
σb=σwm+σclay
for a completely saturated soil in the presence of clay.
σbis the bulk conductivity of the layer. σwis the water conductivity.
is the porosity.
σclayis the clay conductivity.
mis a factor depending on the shape of the sediments. A value around 1.8–2 is appropriate for porosities between 10 and 30% (McNeill, 1990).
Taking into account the bulk conductivity for the Pampeano aquifer obtained from the VES models and the water conducti-vity measured on well samples near them, the correlation between these variables was estimated. The linear regression corresponds to Archie’s law, where a value of porosity may be inferred from its slope. There was no significative linear correlation between
respecti-CLAUDIA M. SAINATO and BEATRIZ N. LOSINNO
315
Figure 5–a.Linear regression between bulk conductivityσbof the Pampeano aquifer and water conductivityσw. Fitting equation is shown.
b.Linear regression between bulk conductivityσbof the Pampeano aquifer and TDS (Total dissolved solids) in water. Fitting equation is shown.
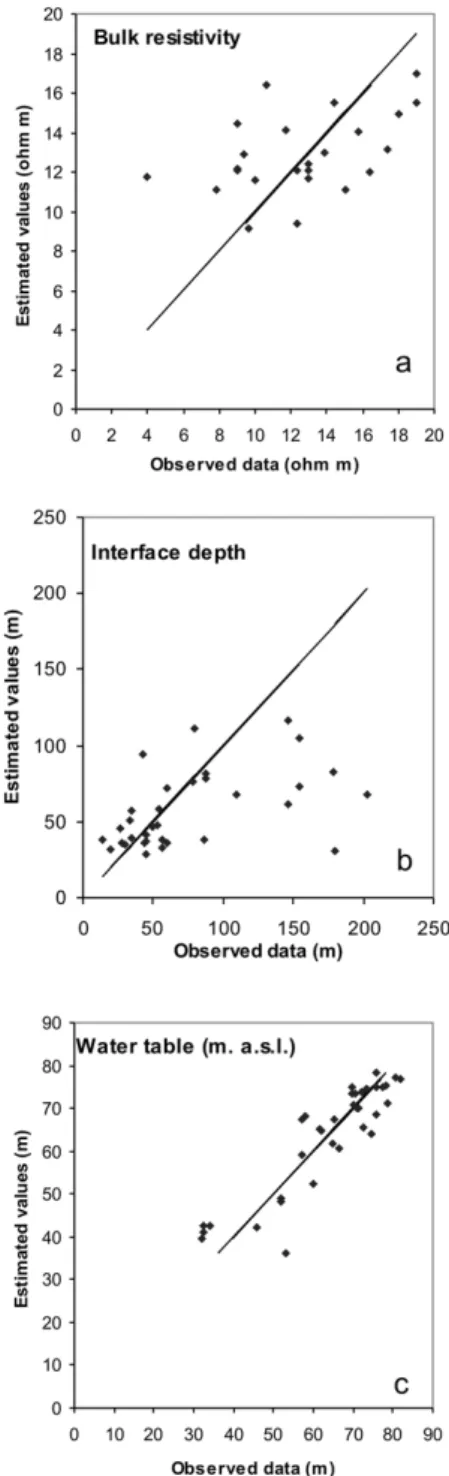
vely, obtained from kriging interpolation (Geo-EAS, 1988). Figure 7a, b, c are the plots of the estimated values obtained by kriging and the observed data, resulting from cross validation analysis of aquifer properties. As it has been shown before no correlation between bulk resistivity and groundwater conductivity could be achieved including sites near Arrecifes city. These si-tes were excluded from the kriging processing (Figure 6a). The distribution of bulk resistivity of the Pampeano aquifer shows a clear trend with values around 8 ohm m at the west area increa-sing towards the east up to 18 ohm m. The accuracy of the kriging interpolation for bulk resistivity is not good for some sites where values are over or sub estimated (Figure 7a).
At most of the sites at the SE zone, the interface depth was sub estimated (Figure 7b), and even if the observed data indicate greater depths for the interface, deepening to the east, the kriging interpolation is shown with dotted line (Figure 6b) since it has low accuracy. It seems that interpolation does not fit data when changes are very strong. The depth of fresh-saline water interface deepens to the SE, with a remarkable difference between the va-lues around 40 m near Pergamino city and the ones obtained near Arrecifes (140 m). It shows a steep deepening of this interface, along a short distance (high gradient) at approximately 12 km to the west of Arrecifes city (Meridian60◦10′W).
Estimated values of water table level are in agreement with observed data (Figure 7c). The distribution of water table level shows a clear decrease to the SE, accompanying the topography. This implies a free groundwater flow from NO to SE with some lo-cal components to the Pergamino river. Costa et al. (2002) found at the southern part of Bs. As. Province that groundwater flow
direction in a multilayer aquifer coincides with free groundwater flow and with the direction of river flows.
The area at the west of Arrecifes city may be called a transi-tion zone for the correlatransi-tion of electrical conductivity and it is the same place where the fresh-salty water interface deepens abruptly. The transition zone also shows a higher hydraulic gradient of free aquifer (Figure 6c). Yechieli et al. (2001), in a multilayer aquifer, associated a higher slope of the interface, near fault zones, with a higher piezometric gradient. Then, if the transition zone of this study was related with a fault zone, the interface behaviour might be a sign of a higher hydraulic gradient of deeper aquifers. In ad-dition, if a higher hydraulic gradient of free aquifer is present at this zone it may be thought that the distribution of groundwater flow may be similar for both of them, the phreatic and the dee-per multilayer aquifers. Sala (1975) had previously suggested the idea that the morphology of the water table must reflect the gene-ral piezometry of the deeper aquifers and these results may be an evidence of this fact.
CONCLUSIONS
The variability in the stratigraphic sequence and in groundwater salinity was investigated through transects of Vertical Electrical Soundings. The depth to fresh-salty groundwater interface, a li-mit to the exploitation wells, does not have a regular or smooth shape. The top of the conductive layer, related to the interface, deepens towards the left margin of the Pergamino river and to the SE, abruptly at around 12 km to the west (60◦10′W) of Arrecifes
CLAUDIA M. SAINATO and BEATRIZ N. LOSINNO
317
is larger at the Arrecifes zone than at Pergamino.
Figure 7– Crossvalidation analysis. Plots of the estimated values obtained by kriging and the observed data, together with the line of slope one.a.for bulk resistivity (ohm.m).b.for interface depth (m).c.for water table level (m).
The spatial distribution of some aquifer properties was evalu-ated by means of geostatistical analysis. The electrical resistivity of the Pampeano aquifer was rather homogeneous at the centre of the study area, with a slight increase from west to east, decreasing groundwater salinization. Free groundwater has higher values of
conductivity than the deeper levels of the Pampeano aquifer. The water table level has an homogeneous behaviour at the west of Pergamino city. It may be observed an increase of its hydrau-lic gradient coinciding with the transition zone where the depth of the fresh-salty water interface also increased. The direction of free groundwater flow is NW-SE and deeper multilayer aquifers might have a similar flow pattern.
ACKNOWLEDGEMENTS
This work was financially supported by the University of Buenos Aires. The authors thank Ing. Jos´e Luis Mons´o for helping with the Portuguese translation.
REFERENCES
AMATO S. 1998. Caracterizaci´on morfol´ogica de la formaci´on Puelches en el ´ambito de la Provincia de Buenos Aires, Argentina. Actas de X Con-greso Latinoamericano de Geolog´ıa y VI ConCon-greso Nacional de Geolog´ıa Econ´omica, Argentina, 1: 214–219.
ARCHIE GE. 1942. The electrical resistivity log as an aid in determining some reservoir characteristics. Transactions of the American Institute of Mining, Metallurgical and Petroleum Engineering, 146–154.
BOBACHEV A, MODIN I & SHEVNIN V. 2001. IPI2Win software. Geoscan-M Ltd. Moscow State University. Russia.
CAMBARDELLA C, MOORMAN T, NOVAK J, PARKIN T, TURCO R & KONOPKA A. 1994. Field-scale variability of soil properties in Central Iowa soils. Soil Science of American Journal, 58(5): 1501–1511.
COSTA JL, MASSONE H, MARTINEZ D, SUERO E, VIDAL C & BEDMAR F. 2002. Nitrate contamination of a rural aquifer and accumulation in the unsaturated zone. Agricultural water management, 57: 33–47.
GEO-EAS. Geoestatistical Environmental Assessment Software. 1988. EPA, Systems laboratory, Las Vegas – USA.
McNEILL JD. 1990. Use of electromagnetic methods for groundwater studies. In Geotechnical and Environmental geophysics. Review and Tu-torial, Society of Exploration Geophysicists 1: 191–218.
MARINHO JML & VASCONCELOS SMS. 2001. Imageamento geoel´etrico de colunas e secc¸˜oes de modelos 1-D utilizando t´ecnicas geoestat´ısticas. Proceedings of the 7thInternational Congress of the Brazilian
Geophysi-cal Society. CD-ROM. Salvador. Brasil, 100–103.
SAINATO C, POMPOSIELLO MC, LANDINI A, GALINDO G & MALLE-VILLE H. 2000. The hydrogeological sections of the Pergamino basin (Bs. As. Province, Argentina): Audiomagnetotelluric and geochemical results. Brazilian Journal of Geophysics, 18(2): 187–200.
of groundwater at the Pergamino zone (Buenos Aires Province, Argen-tina) through Vertical Electrical Soundings and Geostatistical analysis. J. of South American Earth Sciences, 16(2): 177–186.
SALA JM. 1969. El agua subterr´anea en el NE de la Prov. De Bs. As., Argentina. In: Actas de la Reuni´on Geol´ogica del Agua subterr´anea. CIC (Eds.). La Plata. Prov. de Bs. As. Argentina, 25–49.
SALA JM. 1975. Recursos h´ıdricos. Relatorio Geolog´ıa de la Pcia. de Bs. As. VI Congreso Geol´ogico Argentino. Bah´ıa Blanca. Argentina.
SALA JM, GONZALEZ N & KRUSE E. 1983. Generalizaci´on hidrol´ogica de la Prov. De Bs. As. In: UNESCO (Eds.). Coloquio internacional sobre hidrolog´ıa de grandes llanuras, 973–1009.
SALA JM & ROJO M. 1994. Pasado, presente y futuro de la hidrolog´ıa subterr´anea en la Provincia de Buenos Aires, Argentina. In: Temas actu-ales de la hidrolog´ıa subterr´anea. Consejo Federal de Inversiones. Uni-versidad Nacional de Mar del Plata. Argentina.
SANTA CRUZ J. 1987. Caracterizaci´on del recurso h´ıdrico subterr´aneo con miras al riego suplementario en la regi´on NNE-maicera t´ıpica- de la Pcia. de Bs. As. Informe del Instituto Interamericano de Cooperaci´on para la Agricultura en convenio con Secretar´ıa de Agricultura, Ganader´ıa y Pesca (Argentina). Documento de trabajo, 15: 161.
SANTA CRUZ J. 1994. Aspectos hidrogeol´ogicos e interpretaci´on de una nueva caracter´ıstica formacional de subyacencia del acu´ıfero Puelches, Pcia. de Bs. As., Argentina. In: BOCANEGRA E & RAPACCINI A. (Eds.). Temas actuales de la hidrolog´ıa subterr´anea. Consejo Federal de Inver-siones. Universidad Nacional de Mar del Plata. Argentina, 261–272.
SANTA CRUZ J & SILVA BUSSO A. 1995. Disponibilidad del agua sub-terr´anea para riego complementario en las Pcias. de Bs. As., E. R´ıos, C´ordoba y Santa Fe. Programa de Servicios Agr´ıcolas provinciales. Se-cretar´ıa de Agricultura, Ganader´ıa y Pesca (Argentina), 55 pp.
SPAR. 1999. Servicio Provincial de Agua Rural. Direcci´on de Hidr´aulica, Pcia. de Bs. As.
SUN NZ, JENG MC & YEH WW. 1995. A proposed geological para-meterization method for parameter identification in three-dimensional groundwater modeling. Water Resources Research, 31(1): 89–102.
TERUGGI M. 1957. Nature and origin of Argentine Loess. Journal of Sedimentary Petrology, 27(3): 322–332.
TRANGMAR B, YOST RS & UEHARA G. 1985. Applications of geosta-tistics to spatial studies of soil properties. Advances in Agronomy, 38: 45–94.
WEBSTER R. 1985. Quantitative spatial analysis of soil in the field. In: STEWART BA (Ed.). Advance in soil science. New York: Springer-Verlag, 3(1): 1–70.
YECHIELI Y, KAFRI U, GOLDMAN M & VOSS C. 2001. Factors control-ling the configuration of the fresh-saline water interface in the Dead Sea coastal aquifers: synthesis of TDEM surveys and numerical groundwater modeling. Hydrogeology Journal, 9(4): 367–377.
YRIGOYEN M. 1975. Geolog´ıa del subsuelo y plataforma continental. Relatorio de la Pcia. de Bs. As., Actas del VI Congreso Geol´ogico Argen-tino, B. Blanca, Argentina, 139–168.
NOTES ABOUT THE AUTHORS
Claudia M. Sainato.Dr. in Physics graduated at the University of Buenos Aires. Argentina. Associate Professor at the School of Agronomy of the University of Buenos Aires. Teaching activities for twenty two years. Now, in charge of graduate and post graduate courses. Working at research projects on geophysics for twenty years. From 1996 doing research in geophysics applied to groundwater exploration and environmental studies. Twenty six papers published in international and regional journals and more than fifteen papers published in proceedings of scientific congresses. More than thirty presentations in international and regional congresses. Member of the Working Group Committee of Electromagnetic Induction in the Earth (IAGA).