Impact of Influenza on Outpatient Visits,
Hospitalizations, and Deaths by Using a Time
Series Poisson Generalized Additive Model
Ru-ning Guo1, Hui-zhen Zheng2*, Chun-quan Ou3, Li-qun Huang4, Yong Zhou4, Xin Zhang5, Can-kun Liang4, Jin-yan Lin6, Hao-jie Zhong7, Tie Song6, Hui-ming Luo8
1Public Health Emergency management office, Center for Disease Control and Prevention of Guangdong Province, Guangzhou, China,2Institute of Immunization Programs, Center for Disease Control and Prevention of Guangdong Province, Guangzhou, China,3Department of Biostatistics, School of Public Health, Southern Medical University, Guangzhou, China,4Zhuhai Municipal Center for Disease Control and Prevention, Zhuhai, China,5Institute of Pathogenic Microorganisms, Center for Disease Control and Prevention of Guangdong Province, Guangzhou, China,6Center for Disease Control and Prevention of Guangdong Province, Guangzhou, China,7Institute of Infectious Disease Prevention and Control, Center for Disease Control and Prevention of Guangdong Province, Guangzhou, China,8Center for Disease Control and prevention, Beijing, China
Abstract
Background
The disease burden associated with influenza in developing tropical and subtropical coun-tries is poorly understood owing to the lack of a comprehensive disease surveillance system and information-exchange mechanisms. The impact of influenza on outpatient visits, hospi-tal admissions, and deaths has not been fully demonstrated to date in south China.
Methods
A time series Poisson generalized additive model was used to quantitatively assess influ-enza-like illness (ILI) and influenza disease burden by using influenza surveillance data in Zhuhai City from 2007 to 2009, combined with the outpatient, inpatient, and respiratory dis-ease mortality data of the same period.
Results
The influenza activity in Zhuhai City demonstrated a typical subtropical seasonal pattern; however, each influenza virus subtype showed a specific transmission variation. The weekly ILI case number and virus isolation rate had a very close positive correlation (r = 0.774, P<0.0001). The impact of ILI and influenza on weekly outpatient visits was statisti-cally significant (P<0.05). We determined that 10.7% of outpatient visits were associated with ILI and 1.88% were associated with influenza. ILI also had a significant influence on the hospitalization rates (P<0.05), but mainly in populations<25 years of age. No statistically significant effect of influenza on hospital admissions was found (P>0.05). The impact of ILI on chronic obstructive pulmonary disease (COPD) was most significant (P<0.05), with
OPEN ACCESS
Citation:Guo R-n, Zheng H-z, Ou C-q, Huang L-q, Zhou Y, Zhang X, et al. (2016) Impact of Influenza on Outpatient Visits, Hospitalizations, and Deaths by Using a Time Series Poisson Generalized Additive Model. PLoS ONE 11(2): e0149468. doi:10.1371/ journal.pone.0149468
Editor:David L. Swerdlow, National Center for Immunization and Respiratory Diseases, UNITED STATES
Received:August 14, 2015
Accepted:January 31, 2016
Published:February 19, 2016
Copyright:© 2016 Guo et al. This is an open access article distributed under the terms of theCreative Commons Attribution License, which permits unrestricted use, distribution, and reproduction in any medium, provided the original author and source are credited.
Data Availability Statement:All relevant data are within the paper and its Supporting Information files.
33.1% of COPD-related deaths being attributable to ILI. The impact of influenza on the mor-tality rate requires further evaluation.
Conclusions
ILI is a feasible indicator of influenza activity. Both ILI and influenza have a large impact on outpatient visits. Although ILI affects the number of hospital admissions and deaths, we found no consistent influence of influenza, which requires further assessment.
Introduction
A large number of evidence shows that influenza can lead to increased mortality rates due to heart and lung disease, which can cause great epidemiological and economic burdens to the community [1–11]. The average annual incidence of influenza-associated hospitalizations is particularly high in children<5 years of age [12,13], greatly promoting the development of vaccination strategies. The findings of a population-based study indicated that the influenza-associated disease burden on young children were mainly derived from outpatients, involved a high attendance rate, common complications, and immeasurable missed work/absenteeism, followed by influenza-associated hospitalizations, and death-related disease burden caused by influenza was comparatively low [14]. Studies to date have been primarily performed in devel-oped temperate countries, as well as in a few high-income districts in tropical and subtropical countries [2,4,10]. However, basic data on influenza burden are lacking for most tropical and subtropical countries owing to lagging health-care facilities, monitoring, and information col-lection systems [15].
The epidemiological features of influenza vary greatly across regions and climates. In the temperate regions of Europe and America, the influenza activity has a distinct seasonal pattern, with a winter epidemic peak and almost no activity during the other seasons. In subtropical areas such as Guangdong Province in south China, however, influenza activity occurs through-out the year, presenting a vague seasonality that makes it more difficult to use mathematical models that are frequently adopted in temperate areas [13,16]. Studies on the influenza burden and the findings in temperate regions cannot be directly applied to (sub) tropical areas because of local features and population-specific attributes. In recent years, research on influenza-related hospitalizations conducted in central China has shown that a seasonal influenza epi-demic causes a substantial number of hospitalizations [17], with an estimated 115–142 patients with severe acute respiratory infections per 100 000 hospitalizations attributed to influenza. However, the degree of impact of influenza in subtropical southern China has yet to be reported.
Our study group helped evaluate the large influence of influenza and influenza-like illness (ILI) on outpatient visits in view of morbidity and direct economic burden [18,19]; however, the impact of influenza on hospitalizations and deaths has never been examined in southern China, an area once considered by experts as the“epicenter of influenza pandemic”[20] and the origin or high-risk location of multiple emerging infectious diseases such as severe acute respiratory syndrome [21] and human infection with avian influenza H7N9 [22].
Located in a subtropical area of south China, Zhuhai City in Guangdong Province has a well-established community health and influenza surveillance system that provides a good platform for the study of influenza disease burden. In this study, the time series Poisson gener-alized additive model (GAM) was used to quantitatively assess the disease burden of influenza Competing Interests:The authors have declared
and ILI, by using the influenza surveillance data in Zhuhai City from 2007 to 2009 combined with outpatient, inpatient, and respiratory disease mortality data from the same period.
Materials and Methods
Study community and data sources
With an area of 1701 km2and a population of 156.02 million (2010 census), Zhuhai City, the smallest city in Guangdong Province, was selected as the research community. The city has a moderate level of economic development and population density within the province, as well as a well-established community health and influenza surveillance system. It has a typical sub-tropical monsoon climate (annual average temperature, 22.3°C; annual rainfall, 1770–2300 mm).
Zhuhai City has a far-reaching influenza surveillance network. The outpatient and ILI sur-veillance data of this study were taken from the monitoring networks of 28 medical institutions (covering most medical services). ILI is defined as an illness with a protrusion fever (body tem-perature38°C), cough, sore throat, or other respiratory symptoms. The ILI visit percentage (ILI %) refers to the proportion of hospital visits for ILI within a certain period to the total number of outpatient visits for the same period, and is used as an indicator of the degree of influenza epidemic.
The influenza surveillance data were derived from 14 of 28 medical institutions. Influenza cases were those involving patients whose throat swabs were isolated and who were positive for the influenza virus in the cell culture assay (Madin-Darby canine kidney cells). The rate of influenza virus isolation refers to the proportion of influenza virus–positive specimens to the total number of detected specimens. Weekly ILI surveillance and pathogen monitoring data were analyzed. Inpatient data were collected monthly from 18 hospitals in the city where inpa-tient care was provided during 2004–2009. However, only three hospitals provided inpatient data from 2007 to 2009 on a weekly basis, and thus we counted the weekly hospital admissions and established our model analysis on the basis of these data.
The citywide death cases were collected during 2006–2008. Death certificates were issued by hospitals, community health centers, or rural clinics and entered into the Death Registration Information System. The causes of death were based on the death classification criteria in the World Health Organization’s (WHO) International Classification of Diseases (10th edition). The major causes of deaths related to respiratory disease (J00–J99) in Zhuhai City include pneumonia (J9–J18), cardiopulmonary diseases (J26–J28), chronic obstructive pulmonary dis-ease (COPD) (J40–J47), and others.
Statistical analysis
SPSS 13.0 statistical software and R language version 2.3 were used for the data analysis. The Pearson correlation method was adopted for the analysis of the correlation among the number of weekly ILI, outpatient visits, and influenza cases (virus isolation rate). The GAM was used to fit the regression relation among weekly outpatient visits, hospital admissions, and respiratory deaths, as well as to assess the impact of ILI and influenza on these indicators. The model anal-ysis method was as follows (with respiratory deaths as an example).
models were as follows [3,5]:
YtPoissonðmtÞ
EðYtÞ ¼mt VarðYtÞ ¼ϕmt
logEðYtÞ ¼aþfðtÞ þqðztÞ
ð1Þ
whereYtis the dependent variable, the number of deaths per week;μtis the expected mean,Yt;
ϕis the over-dispersion parameter (givenϕis equal to 1, the outcome perfectly follows Poisson distribution.ϕmore than 1 means over-dispersion and the variance is modified by multiplying
ϕ);αis the intercept;fis a smooth function with respect to the time variablet;ztis a time-vary-ing variable that can be monitored, for example, meteorological factors such as temperature and relative humidity; andqis a smooth function ofzt, for which the cubic spline smoothing function is adopted. Each smooth function has a parameter (e.g., degrees of freedom) that needed to be adjusted to choose the best model. The white noise of residual distribution and non-statistically significant autocorrelation of the partial autocorrelation function was required for the model. Only conditions that met the above criteria could be considered sufficient for controlling the confounding factors. If multiple models met the above criteria, then we chose the smallest function value as the optimal model by using Akaike information criteria. If the residual partial autocorrelation plot always showed significant autocorrelations regardless of model parameter adjustment, the autoregressive term was introduced to establish the autocor-relation regression model for correction.
The study factorX(i.e., influenza variable) was introduced into the established core model one at a time as follows:
logEðYtÞ ¼aþfðtÞ þqðztÞ þbX ð2Þ
whereXis an influenza-related variable andβis the regression coefficient. The weekly ILI% and weekly influenza virus isolation rate were selected as indicators reflecting influenza activity, to assess the impact of ILI and influenza on mortality.
The percentage of influenza-associated excess deaths over the total number of deaths was used to reflect the impact of influenza on mortality.Eq 2was used to calculate the expected weekly actual number of deaths (EXi¼xi) and the theoretical number of deaths each week (EXi¼0) when there is no influenza activity (X= 0). After dividing the sum of the weekly difference of
EXi¼ximinusEXi¼0by the sum ofEXi¼xi, the excess ratio (Dflu) caused by influenza is obtained:
Dflu¼
Xn
i¼1
ðEXi¼x1 EXi¼0Þ=
Xn
i¼1
EXi¼x1100%
The same model analysis method (GAM) was used to fit the correlation between influenza activity and weekly hospitalizations and outpatient visits. Excess hospital admissions and the total outpatient number were also obtained to assess the impact of ILI and influenza on local hospitalizations and outpatient visits.
Ethics statement
psychological examinations. The study complied with the Helsinki Declaration requirements for the use of human subjects, and received approval from the ethics committee of the Centers for Disease Control and Prevention of Guangdong Province. Oral informed consent was obtained from each participant before the examination of their throat swab after a thorough explanation of the study’s purposes and risks. All data were analyzed anonymously, and any patient identifier was removed in order to maintain patient confidentiality.
Results
Influenza activity
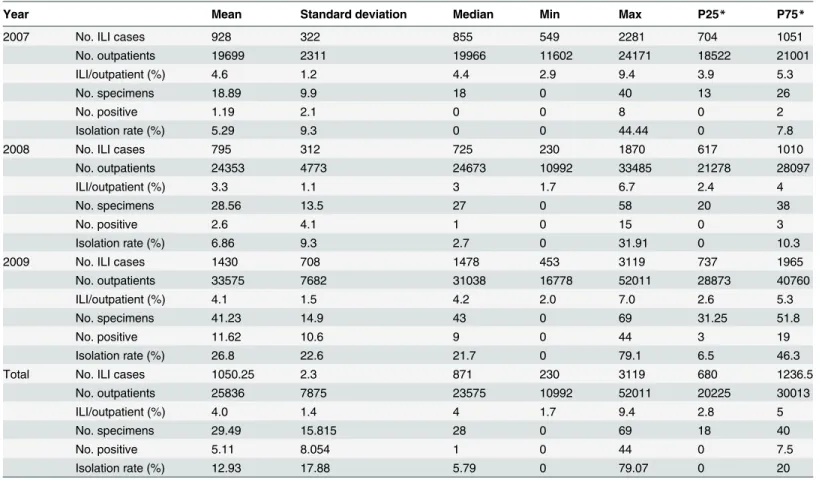
The total annual number of outpatients in Zhuhai City in 2007–2009 showed an obvious increasing trend, with an annual average growth rate of 22%. The number of ILI cases fluctu-ated between years, with a weekly average ILI% of 4.6%, 3.3%, and 4.1%, respectively, whereas the weekly average influenza virus isolation rates were 5.29%, 6.86%, and 26.80%, respectively (Table 1).
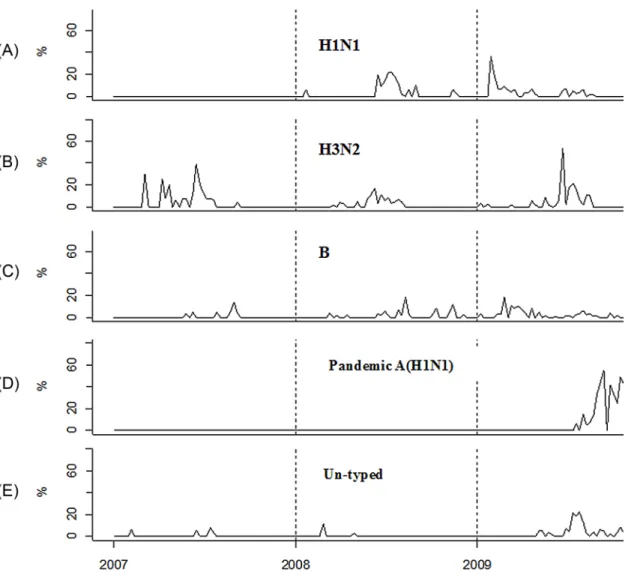
A total of 802 influenza viruses were isolated during 2007–2009; of them, 257 were seasonal influenza A (H1N1 118, H3N2 149), 95 were seasonal influenza B, 358 were pandemic influ-enza A (H1N1), and 82 were untyped viruses. Each subtype presented a certain trend of sea-sonal variation (Fig 1). (i) The prevalence of seasonal influenza A (H1N1) varied by year, with
Table 1. Influenza-like illness (ILI) cases, outpatient visits, and influenza virus positive isolation rate by week (2007–2009, Zhuhai City, China).
Year Mean Standard deviation Median Min Max P25* P75*
2007 No. ILI cases 928 322 855 549 2281 704 1051
No. outpatients 19699 2311 19966 11602 24171 18522 21001
ILI/outpatient (%) 4.6 1.2 4.4 2.9 9.4 3.9 5.3
No. specimens 18.89 9.9 18 0 40 13 26
No. positive 1.19 2.1 0 0 8 0 2
Isolation rate (%) 5.29 9.3 0 0 44.44 0 7.8
2008 No. ILI cases 795 312 725 230 1870 617 1010
No. outpatients 24353 4773 24673 10992 33485 21278 28097
ILI/outpatient (%) 3.3 1.1 3 1.7 6.7 2.4 4
No. specimens 28.56 13.5 27 0 58 20 38
No. positive 2.6 4.1 1 0 15 0 3
Isolation rate (%) 6.86 9.3 2.7 0 31.91 0 10.3
2009 No. ILI cases 1430 708 1478 453 3119 737 1965
No. outpatients 33575 7682 31038 16778 52011 28873 40760
ILI/outpatient (%) 4.1 1.5 4.2 2.0 7.0 2.6 5.3
No. specimens 41.23 14.9 43 0 69 31.25 51.8
No. positive 11.62 10.6 9 0 44 3 19
Isolation rate (%) 26.8 22.6 21.7 0 79.1 6.5 46.3
Total No. ILI cases 1050.25 2.3 871 230 3119 680 1236.5
No. outpatients 25836 7875 23575 10992 52011 20225 30013
ILI/outpatient (%) 4.0 1.4 4 1.7 9.4 2.8 5
No. specimens 29.49 15.815 28 0 69 18 40
No. positive 5.11 8.054 1 0 44 0 7.5
Isolation rate (%) 12.93 17.88 5.79 0 79.07 0 20
Note:
no isolation in 2007, the emergence of a peak in the summer of 2008, and the highest winter peak (January–February) in 2009 (accounting for>33% of the total isolates). (ii) The preva-lence of seasonal influenza A (H3N2) was characterized by a significant summertime seasonal peak and a relatively low activity in the spring and winter. (iii) Seasonal influenza B virus pre-sented a summertime peak in 2007 and was active throughout 2008–2009. (4) Pandemic influ-enza A (H1N1) first appeared in mid-2009, showed a rapidly increasing trend, and in
September began to dominate a variety of influenza viruses (80% of the total isolates in Novem-ber), and then began to decline. (v) Finally, untyped influenza viruses showed low activity dur-ing 2007–2008, had increased epidemic activity in 2009 with a significant summertime peak, and reemerged in wintertime.
Correlation between ILI and influenza
The Pearson correlation analysis of weekly ILI case numbers and a positive isolation rate dur-ing 2007–2009 indicated that these two variables had a very close positive correlation
Fig 1. Seasonal transmission pattern of influenza viruses, 2007–2009.Three years of influenza pathogen surveillance data were collected in Zhuhai
City, Guangdong Province, China. Specific patterns of seasonal transmission were observed in seasonal influenza A (H1N1, H3N2), influenza B, pandemic influenza A (H1N1), and untyped influenza viruses. The Y-axis refers to the isolation rate of influenza viruses, which is the proportion of the number of influenza virus–positive specimens to the total number of specimens detected.
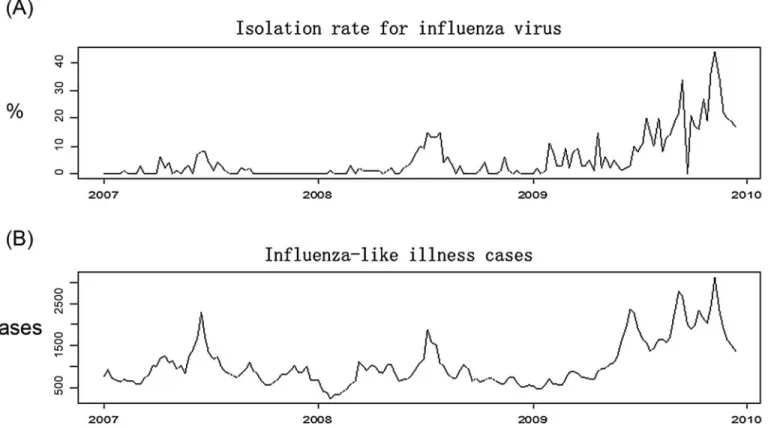
(r = 0.774, P<0.0001). The time series diagram inFig 2shows the consistent increasing trend of the weekly ILI case number and the positive isolation rate.
Model analysis results
Table 2shows the statistical results of each indicator by week in the model.
Impact of ILI and influenza on outpatient visits
The impact of ILI on the numbers of weekly outpatient visits during 2007–2009 was statistically significant (P<0.05). Approximately 10.7% of outpatient visits were ILI related; that is, an average of 2764 patient visits per week were due to ILI. The weekly influenza virus positive iso-lation rate also had a statistically significant influence on the outpatient visits per week (P<0.05). Approximately 1.88% of all outpatient visits were due to influenza, with an average of 487 influenza-associated outpatient cases per week; that is, if there was no influenza activity, the outpatient visits declined by 1.88% (Table 3).
Impact of ILI and influenza on hospitalizations
ILI had a significant effect on the hospital admission rate (P<0.05). A total of 3573 cases of hospital admissions were ILI-related during 2007–2009, accounting for 6.76% of all hospital admissions; that is, if there was no occurrence of ILI, the number of hospital admissions would be decreased by about 7%. The analysis of the impact of ILI on hospitalizations by age groups
Fig 2. Seasonal pattern of influenza-like illness (ILI) and influenza by week, 2007–2009, Zhuhai City.Three years of ILI and influenza virus surveillance
data were collected in Zhuhai City, Guangdong Province, China. A, the Y-axis shows the isolation rate (%) of influenza virus strains per week, which is the proportion of the number of influenza virus–positive specimens to the total number of specimens detected. B, the Y-axis shows the number of patients with ILI per week.
revealed that ILI mainly affected persons<25 years of age but had no significant impact on those aged>25 years. There were 470 influenza-associated hospitalizations, accounting for about 1% of all hospital admissions; however, the effect was not statistically significant (P>0.05) (Table 4).
Impact of ILI and influenza on deaths
A total of 1019 patients died of respiratory disease in 2007–2008, of whom 177 died of ILI-asso-ciated respiratory diseases; that is, among the deaths due to respiratory diseases, 17.4% were ILI related. The impact of ILI on COPD was most significant (P<0.05), with 33.1% of COPD-related deaths being due to ILI (Table 5).
ILI had no significant effect on the number of deaths from respiratory diseases among pop-ulations by sex and age (P>0.05); however, it was found that ILI seems to have a greater impact on women. Of the deaths due to respiratory diseases, 14% were ILI related for males and 31% for females.
Table 2. Weekly statistical results of the main indicators in the time series Poisson generalized additive model#.
Variables Mean Standard deviation Median Min Max P25 P75
No. ILI cases 1050.25 2.30 871 230 3119 680 1236.5
No. outpatients* 25836 7875 23575 10992 52011 20225 30013
ILI/outpatient (%)** 4.01 1.40 4.00 1.70 9.44 2.82 5.00
Isolation rate (%)** 12.93 17.88 5.77 0 79.07 0 20
No. hospitalizations* 337 50 342 132 436 312 369
Mean temperature(°C) 22.78 5.38 24.00 6.20 32.00 19.00 27.40
Relative humidity (%) 76 13 78 32 95 69 86
Note: ILI% is the percentage of influenza-like illness (ILI) cases out of the total outpatient visits. The positive rate is the proportion of the number of influenza virus–positive specimens to the total specimens detected. Mean temperature and relative humidity were used in the model for controlling for the potential confounding influence of meteorological factors.
*Dependent variables in the model;
**independent variable, which stands as influenza proxy.
#, estimates that are aggregated results from multiple separate models, which means in
fluenza proxy (**) are included in the model one at a time. doi:10.1371/journal.pone.0149468.t002
Table 3. Impact of influenza-like illness and influenza on outpatient visits.
No. outpatient Excess outpatient visits Excess percentage (%) P value
2007~2009 ILI% 4056320 433947 10.7 0.049
Positive rate 4056320 76417 1.88 0.042
2009 ILI% 1745899 296312 16.97 0.012
Positive rate 1745899 36496 2.09 0.106
2008 ILI% 1266356 106526 8.41 0.179
Positive rate 1266356 23145 1.83 0.223
2007 ILI% 1044065 104027 9.96 0.03
Positive rate 1044065 11103 1.06 0.074
Note: ILI% is the percentage of the number of cases of influenza-like illness out of the total outpatient visits. The positive rate is the proportion of the number of influenza virus–positive specimens to the total number of detected specimens.
By using the same methods to analyze the impact of influenza on the number of deaths, the constructed core model was used for the analysis of the influenza virus isolation rate. The obtained excess deaths were mostly negative, and the P values of the introduced influenza vari-able in the model were much higher than the 0.05 cutoff (average 0.8). The impact of influenza on the number of deaths requires further evaluation.
Discussion
Zhuhai City has a typical subtropical climate, with hot and rainy summers and mild winters. Like in other subtropical cities (e.g., Hong Kong), influenza activity is seen throughout the year in Zhuhai City. Several epidemics with fluctuating intensity and seasonal peaks are seen throughout the year, making the regional prevention and control of influenza more complex [23,24]. Influenza monitoring in Zhuhai City during 2007–2009 showed year-round local pathogen activity; however, different subtypes of influenza virus showed inconsistent epidemic peaks, suggesting that the active period of transmission of a specific influenza virus should be considered in the timing of influenza vaccination to ensure the best preventive effect.
Table 4. Impact of influenza-like illness and influenza on hospitalizations.
No. total hospitalizations No. excess hospitalizations Percentage of excess hospitalizations (%) P value
Total population ILI%* 52908 3573 6.76 0.037
Positive rate* 52908 470 0.89 0.105
0–4 years ILI% 2036 382 18.75 0.02
Positive rate 2036 - - 0.288
5–14 years ILI% 1558 98 6.34 0.487
Positive rate 1558 9 0.56 0.062
15–24 years ILI% 8252 1197 14.5 0.003
Positive rate 8252 213 2.59 0.049
25–59 years ILI% 29672 1452 4.89 0.335
Positive rate 29672 220 0.28 0.284
60 years ILI% 11390 193 1.7 0.798
Positive rate 11390 108 0.95 0.588
Note: ILI% means the proportion of cases of influenza-like illness to the total number of outpatient visits. The positive rate means the rate of influenza virus isolation. Excess hospitalizations refer to the excess number of hospitalizations associated with ILI or influenza. The percentage of excess hospitalizations refers to the proportion of excess hospitalizations for ILI or influenza to the total number of hospital admissions.
*ILI% and positive rate represent the ILI activity and laboratory-confirmed influenza activity in the model, respectively. doi:10.1371/journal.pone.0149468.t004
Table 5. Impact of influenza-like illness on deaths by disease, sex, and age.
No. deaths No. excess deaths Percentage of excess deaths (%) P value
Cause of death All respiratory disease 1019 177 17.4 0.23
COPD* 472 156 33.1 0.03
Others 547 28 5.1 0.82
Sex Male 610 88 14.4 0.3
Female 409 127 31.1 0.1
Age elders(65 years) 884 181 20.5 0.17
youngers(<65years) 142 40 28.2 0.4
Note:
Our study found an abrupt increase of influenza activity in 2009 compared with that in 2007 and 2008, and we believe that, in addition to the most obvious cause—the emergence of the new pandemic H1N1 strain—changes in surveillance practice (i.e., increased health-care-seeking behavior for mild illnesses during the pandemic period and expansion of the surveil-lance range) are another reason for the substantial increase in influenza detection in 2009.
Influenza surveillance includes epidemiological (i.e., ILI surveillance) and virological sur-veillance. Virological surveillance is theoretically the most powerful reflection of influenza activity. Owing to cost and other aspects, it is impossible to perform virological detection for all ILIs. During 2007–2009, only 2.8% of patients with ILI in Zhuhai City sentinel hospitals underwent influenza virological detection. Influenza is a self-limiting disease with nonspecific clinical symptoms, and a lack of laboratory testing would make it clinically difficult to distin-guish influenza from other diseases with flu-like symptoms [25]. Fortunately, our data analysis found a positive correlation between the number of ILI cases and the influenza virus isolation rate by week during 2007–2009, and the strong correlation between ILI and virus activity was even more significant in the 2009–2010 pandemic year, indicating that ILI monitoring may reflect the influenza epidemic.
In this study, we found that ILI has a very significant impact on COPD. We determined that 32% of deaths due to COPD were attributable to ILI, indicating that patients with COPD need effective ILI prevention and control to reduce the risk of death, and that emphasis should be given to providing influenza vaccination for this part of the population. According to Wong et al., the impact of influenza on pneumonia and influenza (P&I) was more significant in Hong Kong, Guangzhou, and Singapore, and that influenza virus activity was highly correlated with P&I [26]. However, owing to missing data in this aspect, a related study in Zhuhai City has not been performed.
Influenza can be a direct cause of death, lead to secondary infections, or induce or cause deterioration of other diseases (e.g., congestive heart failure, COPD) that can result in death. During 2006–2008, 171 deaths were attributed to pneumonia in Zhuhai City, of which only 1 death was attributed to influenza. The mortality rate recorded in the death database is likely lower than the real situation for the following reasons: first, only a small number of patients with suspected influenza infections (especially adult patients) underwent virological testing; additionally, even in patients who were evaluated etiologically and ultimately died, the death certificates rarely listed influenza as the underlying cause of death owing to the doctors’ self-protection and other reasons [27]. The United States Centers for Disease Control and other researchers have stated that influenza mortality reflects a certain influence on patients who died of influenza but seriously underestimates the disease burden and that an appropriate sta-tistical model is needed to estimate the full impact of influenza. The influenza-associated mor-tality estimated with the statistical model was 5–60 times that of the recorded influenza mortality rate in the United States [28–30]. A cohort study in Sydney, Australia, reported that patients with a discharge diagnosis of influenza only constituted one-sixth of all influenza-related hospitalizations [31].
influenza. Thus, the burden of ILI should include influenza and other related diseases involving respiratory pathogens and those with a much greater impact than the disease burden of influenza.
Here, we tried to use the positive rate of influenza virus detection as an indicator of influ-enza activity, to assess the strength of the influinflu-enza disease burden; however, we found that only the impact of influenza on outpatient attendance was statistically significant (nearly 2% of outpatients’conditions were attributable to influenza virus infection). There is a need to further strengthen the virological surveillance of influenza in the future by increasing ILI virological detection and emphasizing the randomness of the sampling to avoid artificially increasing the virus isolation rate by deliberately collecting typical cases for influenza virus separation. Such selective bias will result in influenza virological surveillance not accurately reflecting the strength of the influenza epidemic.
In this study, only 157 weeks of data were available for 2007–2009 (the study of death involved only 105 weeks of data) and analyzed. This period is too short for a study on the influ-enza disease burden, which resulted in an inadequate test performance. Thus, further studies with more accumulated data are necessary. In this study, we only analyzed existing respiratory mortality data, and several similar studies found that influenza not only affects respiratory dis-eases but also induces or aggravates the risk for cardiovascular and other disdis-eases. Therefore, it is necessary to analyze the data of all causes of deaths to enable a comprehensive assessment of the disease burden of influenza. Similarly, if detailed data of hospitalization cases (including patient age and sex, disease etiology, and other information) can be obtained, the disease bur-den of influenza can be analyzed and high-risk populations can be further ibur-dentified.
Supporting Information
S1 Fig. Time series of deaths due to respiratory diseases in three hospitals of Zhuhai City in China, by week, 2006–2008.
(TIF)
S1 Table. Influenza virus isolations during 2007–2009, Zhuhai City, Guangdong Province,
China.
(DOCX)
Acknowledgments
The authors wish to thank all of the study participants in the local Zhuhai Municipal Center for Disease Control and Prevention for their support during the data collection process. We also thank our colleagues of the Department of Biostatistics of Southern Medical University for their technical support and suggestions for preparing the data analysis. Thanks also go to the anonymous reviewers for their thoughtful suggestions and insights, which have enriched the manuscript and produced a more balanced and better account of the research.
Author Contributions
Conceived and designed the experiments: RNG HZZ JYL. Performed the experiments: LQH YZ XZ CKL HML. Analyzed the data: RNG CQO CKL. Contributed reagents/materials/analy-sis tools: LQH XZ HJZ. Wrote the paper: RNG HZZ TS CQO.
References
2. Wong CM, Chan KP, Hedley AJ, Peiris JS. Influenza-associated mortality in Hong Kong. Clinical infec-tious diseases: an official publication of the Infecinfec-tious Diseases Society of America. 2004; 39
(11):1611–7.
3. Yang L, Chen PY, He JF, Chan KP, Ou CQ, Deng AP, et al. Effect modification of environmental factors on influenza-associated mortality: a time-series study in two Chinese cities. BMC infectious diseases. 2011; 11:342. doi:10.1186/1471-2334-11-342PMID:22168284
4. Chow A, Ma S, Ling AE, Chew SK. Influenza-associated deaths in tropical Singapore. Emerging infec-tious diseases. 2006; 12(1):114–21. PMID:16494727
5. Yang L, Ma S, Chen PY, He JF, Chan KP, Chow A, et al. Influenza associated mortality in the subtrop-ics and tropsubtrop-ics: results from three Asian cities. Vaccine. 2011; 29(48):8909–14. doi:10.1016/j.vaccine. 2011.09.071PMID:21959328
6. Tsai Y, Zhou F, Kim IK. The burden of influenza-like illness in the US workforce. Occup Med (Lond). 2014; 64(5):341–7.
7. Silva ML, Perrier L, Spath HM, Grog I, Mosnier A, Havet N, et al. Economic burden of seasonal influ-enza B in France during winter 2010–2011. BMC public health. 2014; 14:56. doi: 10.1186/1471-2458-14-56PMID:24443900
8. Ortiz JR, Neuzil KM, Shay DK, Rue TC, Neradilek MB, Zhou H, et al. The burden of influenza-associ-ated critical illness hospitalizations. Critical care medicine. 2014; 42(11):2325–32. doi:10.1097/CCM. 0000000000000545PMID:25148596
9. Chaves SS, Perez A, Farley MM, Miller L, Schaffner W, Lindegren ML, et al. The burden of influenza hospitalizations in infants from 2003 to 2012, United States. The Pediatric infectious disease journal. 2014; 33(9):912–9. doi:10.1097/INF.0000000000000321PMID:24577042
10. Chiu SS, Lo JY, Chan KH, Chan EL, So LY, Wu P, et al. Population-based hospitalization burden of influenza a virus subtypes and antigenic drift variants in children in Hong Kong (2004–2011). PloS one. 2014; 9(4):e92914. doi:10.1371/journal.pone.0092914PMID:24786780
11. Bhuiyan MU, Luby SP, Alamgir NI, Homaira N, Mamun AA, Khan JA, et al. Economic burden of influ-enza-associated hospitalizations and outpatient visits in Bangladesh during 2010. Influenza Other Respir Viruses. 2014; 8(4):406–13. doi:10.1111/irv.12254PMID:24750586
12. Emukule GO, Khagayi S, McMorrow ML, Ochola R, Otieno N, Widdowson MA, et al. The burden of influenza and RSV among inpatients and outpatients in rural western Kenya, 2009–2012. PloS one. 2014; 9(8):e105543. doi:10.1371/journal.pone.0105543PMID:25133576
13. Cromer D, van Hoek AJ, Jit M, Edmunds WJ, Fleming D, Miller E. The burden of influenza in England by age and clinical risk group: a statistical analysis to inform vaccine policy. The Journal of infection. 2014; 68(4):363–71. doi:10.1016/j.jinf.2013.11.013PMID:24291062
14. Burton C, Vaudry W, Moore D, Bettinger JA, Tran D, Halperin SA, et al. Burden of seasonal influenza in children with neurodevelopmental conditions. The Pediatric infectious disease journal. 2014; 33 (7):710–4. doi:10.1097/INF.0000000000000272PMID:24918745
15. WHO. A Practical Guide for Designing and Conducting Influenza Studies. Available:http://www.wpro. who.int/health_topics/influenza/. Accessed 2012 Feb 29.
16. Ortiz JR, Neuzil KM, Cooke CR, Neradilek MB, Goss CH, Shay DK. Influenza Pneumonia Surveillance among Hospitalized Adults May Underestimate the Burden of Severe Influenza Disease. PloS one. 2014; 9(11):e113903. doi:10.1371/journal.pone.0113903PMID:25423025
17. Yu H, Huang J, Huai Y, Guan X, Klena J, Liu S, et al. The substantial hospitalization burden of influenza in central China: surveillance for severe, acute respiratory infection, and influenza viruses, 2010–2012. Influenza Other Respir Viruses. 2014; 8(1):53–65. doi:10.1111/irv.12205PMID:24209711
18. Guo RN, Zheng HZ, Huang LQ, Zhou Y, Zhang X, Liang CK, et al. Epidemiologic and economic burden of influenza in the outpatient setting: a prospective study in a subtropical area of china. PloS one. 2012; 7(7):e41403. doi:10.1371/journal.pone.0041403PMID:22911789
19. Guo RN, Zheng HZ, Li JS, Sun LM, Li LH, Lin JY, et al. A population-based study on incidence and eco-nomic burden of influenza-like illness in south China, 2007. Public health. 2011; 125(6):389–95. doi: 10.1016/j.puhe.2011.03.004PMID:21616513
20. Shortridge KF. Pandemic influenza: a zoonosis? Seminars in respiratory infections. 1992; 7(1):11–25. PMID:1609163
21. Wang DM. Index clinically diagnosed SARS cases analysis of 24 provinces, municipalities and autono-mous regions in China. Chinese Journal of Epidemiology. 2004; 01(25).
23. Ping H. Stuty on epidemic, outbreak and molecular varlalion of influenza in Guangdong Chinese Jour-nal of Disease Control & Prevention. 2004; 8(2):144–7.
24. Ai-ping D, Jian-feng H, Min K, Xin Z, Han-zhong N, Lin-hui L, et al. Epidemiologic characteristics of influenza in Guangdong Province, 2005–2007. South China Journal of Preventive Medicine. 2008; 34 (5):14–7.
25. Wu A, Peng Y, Du X, Shu Y, Jiang T. Correlation of influenza virus excess mortality with antigenic varia-tion: application to rapid estimation of influenza mortality burden. PLoS computational biology. 2010; 6 (8).
26. Wong CM, Peiris JS, Yang L, Chan KP, Thach TQ, Lai HK, et al. Effect of influenza on cardiorespiratory and all-cause mortality in Hong Kong, Singapore and Guangzhou. Hong Kong medical journal = Xiang-gang yi xue za zhi / Hong Kong Academy of Medicine. 2012; 18 Suppl 2:8–11. PMID:22311353
27. Wiselka M. Influenza: diagnosis, management, and prophylaxis. BMJ. 1994; 308(6940):1341–5. PMID: 8019225
28. Dushoff J, Plotkin JB, Viboud C, Earn DJ, Simonsen L. Mortality due to influenza in the United States— an annualized regression approach using multiple-cause mortality data. American journal of epidemiol-ogy. 2006; 163(2):181–7. PMID:16319291
29. Thompson WW, Shay DK, Weintraub E, Brammer L, Cox N, Anderson LJ, et al. Mortality associated with influenza and respiratory syncytial virus in the United States. JAMA: the journal of the American Medical Association. 2003; 289(2):179–86. PMID:12517228
30. Thompson WW, Moore MR, Weintraub E, Cheng PY, Jin X, Bridges CB, et al. Estimating influenza-associated deaths in the United States. American journal of public health. 2009; 99 Suppl 2:S225–30. doi:10.2105/AJPH.2008.151944PMID:19797736