Diffusion of Information throughout the
Host Interactome Reveals Gene Expression
Variations in Network Proximity to Target
Proteins of Hepatitis C Virus
Ettore Mosca*., Roberta Alfieri., Luciano Milanesi
Institute of Biomedical Technologies, National Research Council, Segrate, Milan, Italy
.These authors contributed equally to this work.
Abstract
Hepatitis C virus infection is one of the most common and chronic in the world, and hepatitis associated with HCV infection is a major risk factor for the development of cirrhosis and hepatocellular carcinoma (HCC). The rapidly growing number of viral-host and viral-host protein-protein interactions is enabling more and more reliable network-based analyses of viral infection supported by omics data. The study of molecular interaction networks helps to elucidate the mechanistic pathways linking HCV molecular activities and the host response that modulates the stepwise hepatocarcinogenic process from preneoplastic lesions (cirrhosis and dysplasia) to HCC. Simulating the impact of HCV-host molecular interactions throughout the host protein-protein interaction (PPI) network, we ranked the host proteins in relation to their network proximity to viral targets. We observed that the set of proteins in the neighborhood of HCV targets in the host interactome is enriched in key players of the host response to HCV infection. In opposition to HCV targets, subnetworks of proteins in network proximity to HCV targets are significantly enriched in proteins reported as differentially expressed in preneoplastic and neoplastic liver samples by two independent studies. Using multi-objective optimization, we extracted subnetworks that are simultaneously ‘‘guilt-by-association’’ with HCV proteins and enriched in proteins differentially expressed. These subnetworks contain
established, recently proposed and novel candidate proteins for the regulation of the mechanisms of liver cells response to chronic HCV infection.
OPEN ACCESS
Citation:Mosca E, Alfieri R, Milanesi
L (2014) Diffusion of Information throughout the Host Interactome Reveals Gene Expression Variations in Network Proximity to Target Proteins of Hepatitis C Virus. PLoS ONE 9(12): e113660. doi:10.1371/ journal.pone.0113660
Editor:Ranjit Ray, Saint Louis University, United States of America
Received:August 1, 2014
Accepted:October 27, 2014
Published:December 2, 2014
Copyright:ß2014 Mosca et al. This is an open-access article distributed under the terms of the
Creative Commons Attribution License, which permits unrestricted use, distribution, and reproduction in any medium, provided the original author and source are credited.
Data Availability:The authors confirm that all data underlying the findings are fully available without restriction. All relevant data are within the paper and its Supporting Information files. Gene expres-sion data are available from the GEO database (GSE6764, GSE14323).
Funding:The work has been supported by the Italian Ministry of Education and Research through the Flagship InterOmics (PB05) and HIRMA (RBAP11YS7K) projects, and the European MIMOmics (305280) project to LM. The funders had no role in study design, data collection and analysis, decision to publish, or preparation of the manuscript.
Introduction
Hepatitis C virus (HCV) infection is one of the most common chronic viral infections in the world and hepatocellular carcinoma (HCC) is the third-leading cause of cancer death worldwide. Chronic infection with HCV is the primary risk factor for developing HCC [1] but the sustained viral response in the treatment of HCV is associated with HCC reduction among treated population [2].
HCV is an enveloped, positive-stranded RNA virus belonging to the
Flaviviridae family. Six major HCV genotypes and more than 100 subtypes have been identified. HCV is able to establish a chronic infection in 50–80% of exposed individuals and its infection largely follows a clinical course that after decades may result in liver fibrosis and cirrhosis in a subset of infected patients. HCV has a RNA genome of 9.6 kb translated into a unique polyprotein, which is
subsequently processed by host and viral proteases into 10 proteins: three structural proteins, core, envelope (E) 1 and E2, and seven non-structural (NS) proteins p7, NS2, NS3, NS4A, NS4B, NS5A and NS5B. HCV proteins have been shown to interact with well-established cellular pathways, known to be involved in HCC initiation or progression: cell proliferation and differentiation involving epidermal growth factor (EGF) signaling pathway, Ras and Jak/STAT signaling pathway, PI3K-Akt pathway, wnt/-catenin signaling pathway, inflammation with NF-kB pathway, angiogenesis with the VEGF pathways, DNA damage response pathways with mitochondrial oxidative stress and ATM pathway [3–4]. Although the role of HCV in the onset of HCC is established, there is still the need for a systematic characterization of viral and host factors that can modulate the stepwise hepatocarcinogenic process from preneoplastic lesions (cirrhosis and dysplasia) to the neoplastic stages of HCC.
The increase of publicly available molecular interaction data, e.g. protein-protein interactions (PPIs), has enabled genome wide analyses of the activity of single units (e.g. gene expression studies) in the framework of the molecular interaction networks that regulate cell dynamics. Network-based approaches offer the possibility to address the analysis of biological systems taking into account that most of the biological functions arise from interactions among many components. Several studies have shown that network-based approaches lead to the identification of more robust markers and better stratifications of samples [5–6]. These approaches have also been used for studying the pathogenesis of HCV infection and its relation with HCC. For example, Drozdovet al. [7] defined a consensus gene relevance network for HCC progression; Zheng et al. [8] reconstructed stage-specific networks of PPIs enriched in differentially expressed genes during the progression from normal to HCV-induced HCC; He et al. [9] reconstructed stage-specific, deregulated networks of protein-protein and transcriptional regulatory interactions; Mukhopadhyay et al. [10] proposed infection gateway host proteins and possible pathways of HCV pathogenesis leading to various diseases.
proximity to host proteins targeted by viral proteins (HCV targets). Recently, using Epstein-Barr virus (EBV) and human papillomavirus (HPV), Gulbahceet al. (2012) have shown that host targets of viral proteins reside in network proximity to products of disease susceptibility genes and that the large proportion of the effect related to viral activity can be explained locally in intracellular networks [11]. In our study, we developed a computational approach to examine the relation between HCV targets, host protein-protein interaction (PPI) topology, pathways that regulate HCV response and the expression variations observed in samples collected from preneoplastic (cirrhotic, shortly ‘‘CIR’’) and neoplastic (hepatocellular carcinoma, shortly ‘‘HCC’’) liver lesions of HCV-infected patients of two independent studies.
In order to define the region of the host interactome where HCV proteins could determine the most relevant impact, we use network propagation [12], a
technique that permits to establish a ranking among all the proteins of a PPI network in relation to their location relative to a subset of proteins. Network propagation can be seen as the diffusion of information from a subset of vertexes to all the others according to graph topology. Recently, network propagation has revealed its benefits in different problems, such as the association of genes and protein complexes with diseases [12], the stratification of tumor mutations [13], the identification of biomarkers in genome-wide studies [14,15] and the relation between viral (EBV and HPV) perturbations and disease etiology [11]. We describe the use of network propagation for predicting the host proteins that are in a relevant position of the PPI network on the basis of HCV-host interactions and show that network propagation successfully prioritizes proteins that are involved in the host response to HCV. Subsequently, we show that networks of proteins ‘‘guilt-by-association’’ with HCV are significantly enriched in genes differentially expressed in cirrhotic (CIR) liver samples compared to normal (NORM) liver samples and in hepatocellular carcinoma (HCC) compared to CIR liver samples. These subnetworks contain established, recently proposed and novel candidate proteins for the regulation of the mechanisms of host response to acute and chronic HCV infection.
Results and Discussion
Viral-host and host protein-protein interaction data
We collected HCV-host PPIs from several systematic high-throughput screenings [16–18], the HCVPro database [19], the Host-Pathogen Interaction Database (HPIDB) [20], Intact [21] and VirHostNet [22]. These interactions were assessed through text mining and several experimental techniques, such as
obtained a list of 591 unique human proteins, shortly HCV targets, which interact with viral proteins.
We defined the human PPI network using only ‘‘high confidence’’ protein-protein pairs available in the STRING database [23]. A total of 517 HCV targets establish at least one PPI in the host interactome (Tab. S1).
Identification of human proteins in network proximity to HCV
targets
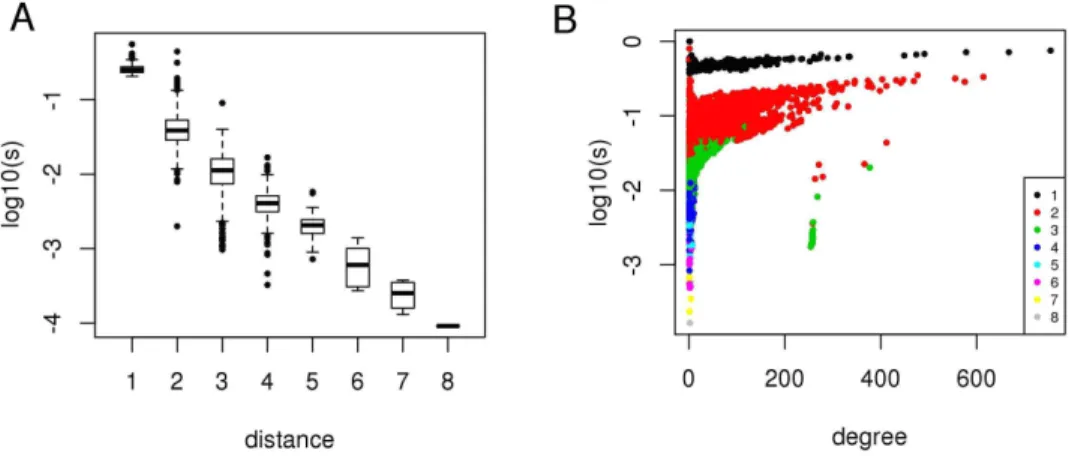
We simulated the effects of HCV-host interactions throughout the molecular interaction network of the host cell to define the region of the host interactome that regulates the chain of events following the interaction between viral and host proteins. We considered the 517 HCV targets as causal proteins for studying the diffusion of the effects of HCV-host interactions, and used network propagation [12] to rank all the other proteins in relation to their network proximity to HCV targets in the PPI network. For each protein we obtained a score si of network proximity to HCV targets: a short distance (number of links of the shortest path connecting two proteins) between a protein and any HCV target in the network (
Fig. 1A) and a high number of interactions (degree) (Fig. 1B) are the two main factors that determine a high si. Hence, network propagation gives a high rank to HCV targets and hubs (proteins with a high degree) of the PPI network (Tab. S1).
To summarize the results of network propagation in a meaningful and interpretable network representation, we used the so-called minimum spanning tree (MST), i.e. the tree that connects all the vertexes using the edges that determine the minimum sum of edge weights. Thus, by means of the definition of edge weights, it is possible to obtain MSTs that highlight different biological aspects. For example, defining edge weights as function ofsi, the MST summarizes the relationships between proteins in network proximity to HCV targets. Note that, this type of MST clearly shows that hubs of the PPI network known to be relevant in HCV response (e.g. TP53, TNF, AKT1, SRC, FN1, NFKB1, MYC and EGFR) receive a high si (Fig. 2, panels A and B).
In order to assess whether the scores of network proximity to HCV are specifically related to HCV targets, we repeated 1,000 times the network
propagation procedure, each time using as source of information a different set of 517 proteins randomly sampled among all the host proteins. Therefore, we obtained 1,000 random network proximity scores for each protein. At this point, we calculated, for each protein, the probability pi of obtaining, by chance, a network proximity score higher than the one obtained using the 517 HCV targets as sources of information. If pi is low, then thesiof the corresponding protein is specifically related to HCV targets.
Figure 1. The network proximity score of a protein depends on network distance from viral targets and protein degree. A) Boxplots of network proximity scores (log10, vertical axis) grouped by viral-host protein
network distance (horizontal axis).B) Network proximity scores (log10, vertical axis) distributed by protein
degree (horizontal axis); colors indicate viral-host protein network distance.
doi:10.1371/journal.pone.0113660.g001
Figure 2. Most relevant relationships between proteins in network proximity to HCV proteins.MSTs among the (A) 100 proteins with the highest network proximity score (si) and (B) 100 proteins with the highestsiexcluding HCV targets, using edge weights (wij) inversely proportional to the product of
proteins network proximity scores:wij51 -sisj.A–B) The darker the color, the higher the network proximity score; squares: HCV targets; circles: non-HCV
targets; vertex size is proportional to the number of interactions in the host interactome.
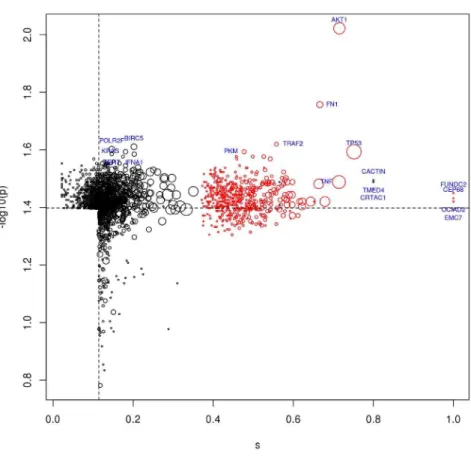
CRTAC have not yet been clearly associated with HCV, but considering the significance of their network proximity to HCV targets these proteins may represent other players in the complex network that is involved in the response to HCV infection.
The two possible rankings, obtained by network proximity scores orp-values, have a strong overlap, which is maximal when considering the top 1,500 proteins of the two lists (Fig. S1). Note that proteins highly ranked according to network proximity scores are of biological interest despite their possible lower ranks when ordered by p-values, because high network proximity scores may indicate important gateways in the PPI network.
The biological significance of the proteins in network proximity to HCV has been further evaluated considering published lists of proteins that mediate host
Figure 3. Top ranked proteins in network proximity to HCV targets.The top ranked 1,500 proteins by network proximity scoresi(on the right of the dotted vertical line) orp-values (above the dotted horizontal line);
red: HCV targets; black: non-HCV targets; point size is proportional to the number of interactions; labels indicate the top 10 of each ranking.
response to early and chronic HCV infection and HCC. The lists of proteins identified in this study show significant overlaps (p,,0.05) with HCC specific co-expression network [7], stage-specific differentially expressed networks in the progression of HCV induced HCC [8], proteins found in at least 20 papers related to HCV induced cirrhosis and HCC, and Hepatitis C associated genes according to the database DisGeNet [28] (Tab. 1, Tab. S2). Note that the significance of the overlaps is not affected by the exclusion of HCV targets, which occur in all the lists (Tab. 1). These overlaps suggest that key players of early and chronic processes that are induced by HCV infection lie in network proximity to HCV targets and can be predicted using currently available PPI data.
Transcriptional variation in preneoplastic and neoplastic liver
samples
The transcriptional response in different phases of the HCV-dependent hepatic disease (cirrhosis and hepatocellular carcinoma) is an important aspect for joint investigation with the viral-host PPI network. To clearly understand biological mechanisms involved and altered during the different stages of hepatic disease, we focused on two gene expression datasets collected from the Gene Expression Omnibus (GEO) database [29] that are comparable in terms of histological characteristics (normal, cirrhotic and neoplastic tissues), viral infections (HCV) and microarray platform used. The dataset GSE6764 [30] includes 75 samples from cirrhotic and neoplastic livers of 38 HCV-infected patients and healthy livers of 10 patients. The dataset GSE14323 [31] includes 108 samples from cirrhotic, neoplastic and normal tissues from 88 HCV-infected patients and 19 HCV seronegative patients.
To increase the reliability of gene expression variation in cirrhosis and HCC, we considered the differentially expressed (DE) genes in common between the two datasets as representatives for each state. In summary, the genes differentially expressed in the same direction (up- or down-regulation) in both the datasets considering CIR-NORM and HCC-CIR comparisons are respectively 484 and 776 (Fig. 4).
We evaluated the functional enrichment of the genes DE in both datasets to identify over-represented pathways (Tab. 2). The most abundant pathways found for the CIR-NORM contrast are related to the virus entrance into the host cell and the consequent signaling involved in both innate and adaptive inflammatory host defenses, as expected when an infection occurs [26,32]. Moreover, we found the ECM-receptor interaction pathway, which is related to tissue and organ
inflammatory host defenses is still on-going and that processes like cell growth, differentiation, angiogenesis are required for the neoplastic transformation.
Expression variation in network proximity to HCV targets
In order to elucidate possible mechanistic relations linking HCV activity and the host response in terms of the gene expression variations observed in the
subsequent liver lesions, we jointly analyzed human proteins for (i) the proximity to HCV targets and (ii) expression variation.
Table 1.Proteins in network proximity to HCV targets are highly enriched with lists of proteins proposed as regulators of host response to HCV and involved in HCC.
Source Description Ranking by
p s p s
with HCV targets without HCV targets
Drozdovet al. [7] Consensus network for HCC 26.96 210.1 25.13 213.46 Zhenget al. [8] Network of genes diff. expr. in CIR-NORM 26.40 27.86 25.66 27.10 Zhenget al. [8] Network of genes diff. expr. in DYS-CIR 27.93 211.8 211.4 210.3 Zhenget al. [8] Network of genes diff. expr. in eHCC-DYS 29.29 27.77 28.92 29.73 Zhenget al. [8] Network of genes diff. expr. in aHCC-eHCC 29.41 28.67 211.6 214.2 ProteinQuest [65] Genes associated with HCV and CIR 27.97 218.3 28.28 210.6 ProteinQuest [65] Genes associated with HCV and HCC 212.78 218.2 26.66 27.67 DisgeNet [28] Genes associated with Hepatitis C 248.4 275.2 236.2 252.3 DisgeNet [28] Genes associated with chronic Hepatitis C 248.4 275.2 236.2 252.3
The table lists the log10of thep-values that estimate the probability of obtaining, by chance (hypergeometric test), the observed overlap between the list of
proteins from the literature (source and description, Tab. S2) and the top ranked 1,500 proteins in network proximity to HCV on the basis ofsiorpi, including
or excluding HCV targets; NORM5normal, CIR5cirrhosis, DYS5dysplasia, eHCC5early HCC, aHCC5advanced HCC.
doi:10.1371/journal.pone.0113660.t001
Figure 4. Venn diagram of the common DE genes for CIR-NORM and HCC-CIR contrasts.The number of DE genes is shown for each dataset (D1 and D2) for the two contrasts. The CIR-NORM and HCC-CIR contrasts show respectively 484 and 776 common DE genes between D1 and D2. The number of DE genes depends on the platform used for the microarray experiments.
Initially, we assessed the significance of the overlap between the set of HCV targets and the sets of genes differentially expressed between normal, cirrhotic and HCC liver samples in the two studies of Wurmbach etal. [30] and Mas etal. [31]. We observed a small overlap, indicating that viral targets, as a whole, display a marginally significant differential expression in the considered pathological states (Tab. 3).
Hence, to study the gene expression variation in the local neighborhood of HCV targets, we extracted subnetworks of PPIs in network proximity to HCV targets and enriched in differentially expressed genes. Specifically, for each of the two comparisons (CIR-NORM and HCC-CIR), we used a search heuristic based on multi-objective optimization [33] in order to identify subnetworks of PPIs composed of proteins (i) with a high network propagation score and (ii) differentially expressed in both the studies of Wurmbach et al. (2007) [30] and Mas et al. (2009) [31]. Since we formulated the problem of finding PPI
subnetworks as a multi-objective optimization problem with two criteria, we found a set of optimal solutions (i.e. PPI subnetworks) that collectively form (an approximation of) the so-called Pareto frontier of the problem [34], i.e. solutions that can not be improved simultaneously for all the objectives.
In both the comparisons (CIR-NORM and HCC-CIR), we found optimal subnetworks with high network propagation score and enriched in differential
Table 2.Functional enrichment of the genes differentially expressed in preneoplastic and neoplastic liver samples.
Contrast Category Term Count P-value Benjamini
CIR-NORM REACTOME Signaling in Immune system 22 2.12E-04 0.00412
REACTOME Signaling by PDGF 10 1.62E-04 0.00632
REACTOME Integrin cell surface interactions 10 9.76E-04 0.0126
KEGG Focal adhesion 19 2.83E-04 0.0148
KEGG Cell adhesion molecules (CAMs) 15 2.45E-04 0.0192
KEGG ECM-receptor interaction 11 7.78E-04 0.0203
KEGG Antigen processing and presentation 11 7.07E-04 0.0221
KEGG Chemokine signalling pathway 17 0.00102 0.0228
KEGG Type I diabetes mellitus 8 6.46E-04 0.0252
KEGG Small cell lung cancer 12 1.82E-04 0.0284
KEGG Allograft rejection 7 0.00158 0.0308
REACTOME Axon guidance 7 0.00432 0.0413
KEGG Graft-versus-host disease 7 0.00243 0.0417
HCC-CIR KEGG p53 signalling pathway 16 8.76E-06 0.00152 KEGG Cytokine-cytokine receptor interaction 34 3.39E-05 0.00295
KEGG Cell cycle 20 1.50E-04 0.00868
KEGG Prostate cancer 14 0.00239 0.0801
KEGG Pathways in cancer 34 0.00219 0.0911
The functional enrichment has been performed for 484 and 776 DE genes respectively from CIR-NORM and HCC-CIR comparisons considering Reactome and KEGG pathways. The column ‘‘Count’’ reports the number of genes differentially expressed in the corresponding pathway; column ‘‘Benjamini’’ indicates the adjustedp-value.
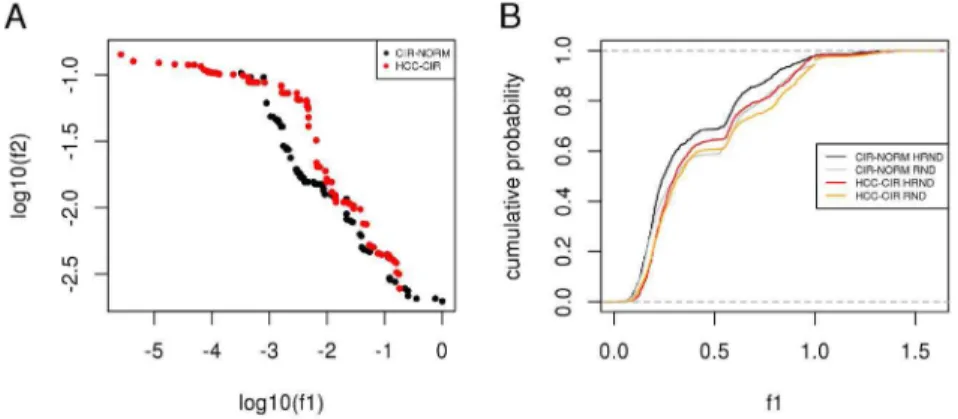
expression (Fig. 5A). The Pareto front of CIR-NORM is composed of several points that dominate some of those of the HCC-CIR Pareto front. In other words, the multi-objective optimization procedure found subnetworks in network proximity to HCV targets and stronger differential expression in the CIR-NORM comparison.
To assess the significance of the relation between the neighborhood of HCV targets in the PPI network and differential expression, we generated 1,000 random subnetworks (shortly, RND subnetworks) and 1,000 random subnetworks in network proximity to HCV targets (shortly, HRND networks) (Fig. S2). We found that HRND subnetworks are significantly more enriched in expression variation than RND networks and, coherently with the results of multi-objective
optimization, we found that HRND subnetworks have more significant differential expression in CIR-NORM compared to HCC-CIR (Fig. 5B and
Tab. 4).
In order to visualize in a unique ‘‘summary’’ subnetwork all the optimal subnetworks extracted from the whole PPI network, for each comparison (CIR-NORM and HCC-CIR), we defined a summary subnetwork composed of all the proteins occurring in the relative optimal subnetworks. Then, we calculated the MSTs, in which each link (representing a PPI) was associated with a weight inversely proportional to the product of the absolute expression variation of the protein pair. Thus, these MSTs capture the PPIs between the most differentially expressed pairs of proteins in the neighborhood of HCV targets.
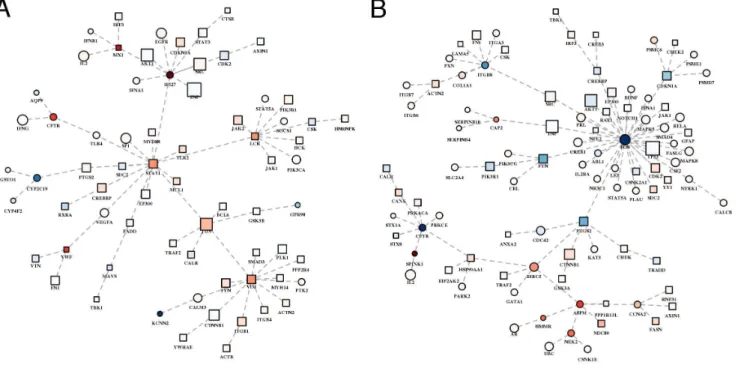
The summary PPI network for the CIR-NORM comparison (Fig. 6A) has a higher network proximity to HCV targets than the CIR-NORM summary PPI network. The majority of the genes in the summary network of CIR-NORM regulate the immune system (45 out of 72, FDR 52.32E-13), the hemostasis (23/ 72, FDR 51.04E-8) and the cell-cell communication (10/72, FDR 51.57E-5), as expected from the available experimental evidences which suggest that HCV has direct and indirect roles in the pathogenesis of liver disease (Tab. S3). In fact, HCV is able to induce immunopathological effects and to promote liver disease, such as steatosis, fibrosis and cirrhosis [35]. Some hubs of the CIR-NORM subnetwork do not show significant variation in their expression (e.g. TNF, SRC, CDK2, AKT1) while others show significant up-regulation (STAT1, JUN, VIM). In particular, considering the nodes with a significant up- or down-regulation, we found that most of them are known to be involved in HCV-dependent pathways.
Table 3.Enrichment in HCV targets of differentially expressed genes in preneoplastic and neoplastic liver lesions.
Source Comparison p(GSEA) p(hyper)
Wurmbachet al. [30] CIR-NORM 0.129 0.0194
Wurmbachet al. [30] HCC-CIR 0.117 0.0446
Maset al. [31] CIR-NORM 0.0310 0.000467 Maset al. [31] HCC-CIR 0.173 0.00233
P-values (p) were computed with Gene Set Enrichment Analysis (GSEA) and hypergeometric (hyper) test.
For example, among the highly up-regulated genes, we found: MX1, which has an antiviral activity against a wide range of RNA viruses [36]; VWF, which is a new marker of liver fibrosis [37], IFI27, whose overexpression inhibits HCV
replication and virus production [38]. Interestingly, we found one of the up-regulated genes, CFTR, which has not yet been associated with HCV infection but mainly associated to liver disease in cystic fibrosis [39]. The CIR-NORM network also involves highly down-regulated genes, such as CYP2C19, which is associated with a risk of HCC development [40] and KCNN2 involved in the trans-epithelial secretion in biliary epithelial cells and mainly expressed in normal liver [41].
The HCC-CIR subnetwork (Fig. 6B) is composed of proteins that are mainly involved in signalling by EGFR (17 out of 104, FDR54.23E-6) and WNT (12/104, FDR 52.45E-3) in cancer, signalling by interleukins (13/104, FDR51.22E-5), hemostasis (27/104, FDR 54.23E-6), apoptosis (12/104, FDR54.97E-4) and cell cycle (19/104, FDR 56.66E-3). The results of the pathway analysis are compliant
Figure 5. Differential expression in network proximity to HCV proteins. A) Gene expression variation (log10(f1)) and network proximity (log10(f2)) of optimal networks (Pareto fronts) identified for CIR-NORM and
HCC-CIR comparisons.B) Estimated cumulative probability functions of gene expression variation (f1) of
1,000 random networks (RND) and 1,000 HCV associated random networks (HRND) in CIR-NORM and HCC-CIR comparisons.A–B) the lower the value offithe higher the enrichment in the corresponding quantity.
doi:10.1371/journal.pone.0113660.g005
Table 4.Random subnetworks in network proximity to HCV targets are more enriched in differentially expressed genes than random subnetworks.
Comparison p(KS) HRND vs RND p(WMW) HRND vs RND
CIR-NORM 2.01E-05 4.11E-05
HCC-CIR 0.0388 0.0457
p-values were calculated using two-sample Kolmogorov-Smirnov (KS) and two sample Wilcoxon-Mann-Whitney (WMW) tests between the enrichment values (f2) for differential expression of 1,000 HRND and 1,000 RND subnetworks.
with several experimental evidences that identify the oncogenic role of the HCV proteins in the pathogenesis of HCC [42] (Tab. S4). In this network, we found some hubs included in the CIR-NORM network, such as TNF, TP53 and AKT1 with no significant expression variation. Concerning the up-regulated genes, we found: NEK2, also confirmed by Drozdov et al. (2012) [7]; ASPM, which is known as a molecular marker of hepatocellular carcinoma [43]; SPINK1, recently proposed as potential hepatocellular carcinoma marker [44]; HMMR, recently proposed as promoter of tumor metastasis [45]. Among the down-regulated genes we found FOS, an important regulator of tumor development [46], which is involved in a regulatory network together with JUN and SIRT6 [47]. We have also found CFTR, which is down-regulated in HCC-CIR.
Progression of gene expression variation in HCV-mediated HCC
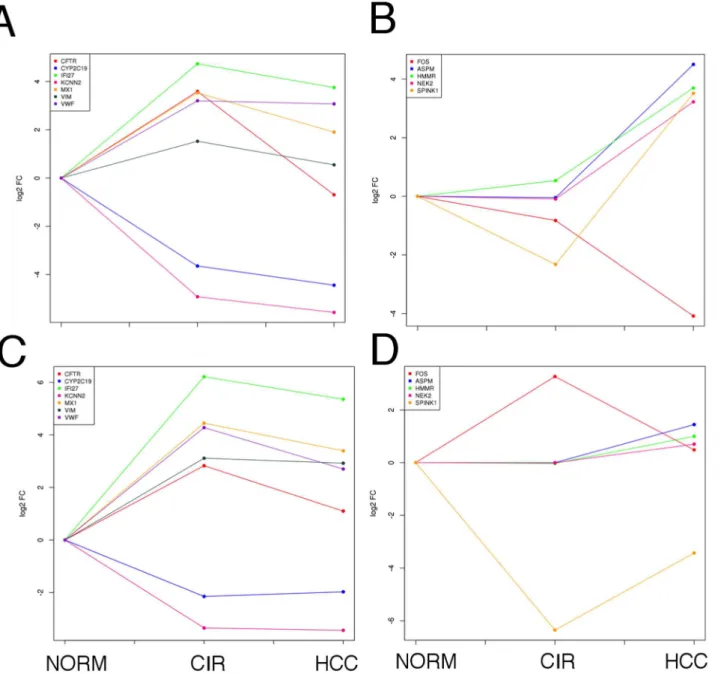
We monitored the expression variation of the extremely up- or down-regulated genes found in the CIR-NORM and HCC-CIR summary PPI networks (absolute mean log2fold change value greater than 2 in both datasets). In the early phase of
the hepatic disease, five genes showed a significant up-regulation and two showed a significant down-regulation in both datasets (Fig. 7, panels A and C). IFI27 is the most up-regulated gene following the same trend in both datasets: very high increase between normal and cirrhosis followed by a small decrease between cirrhosis and HCC. The trend indicates that the expression of this gene was
Figure 6. Most relevant relationships between proteins in network proximity to HCV and differentially expressed in preneoplastic and neoplastic liver samples. A) CIR-NORM.B) HCC-CIR.A–B) Colors, from blue (lower values) to red (higher values): average fold change; squares: HCV targets; circles: non-HCV targets.
primarily affected at the disease onset, confirming its protective action against the early stages of HCV infection [48]. A similar trend is observed for VWF and MX1. Conversely, CFTR showed a significant up-regulation followed by a strong down-regulation in both studies. VIM, an hepatic stem cell marker [49], was found up-regulated in both datasets since the early phase of the hepatic disease. Concerning the down-regulated genes, we found that CYP2C19 expression is lower in cirrhosis samples than normal ones in both datasets, and remains low in HCC. This trend
Figure 7. Expression variation in normal, cirrhotic and hepatocellular carcinoma samples of the most differentially expressed proteins that lie in network proximity to HCV targets.Mean log2fold change (vertical axis) in NORM, CIR and HCC samples (horizontal axis).A, C: genes derived from the
CIR-NORM summary PPI network (Fig. 5A).B, D: genes derived from the HCC-CIR summary PPI network (Fig. 5B).
confirms that this gene plays an important role in the early stages of the disease and it is also associated with HCC development [50]. The other down-regulated gene is KCNN2, which follows the same trend as CYP2C19 and it remains down-regulated in cancer [51].
In the cirrhosis-hepatocellular carcinoma transition (HCC-CIR), we found three genes (HMMR, ASPM, NEK2) that do not show significant expression variations in the early phase of the disease progression (CIR-NORM), but are up-regulated in association with tumor progression, suggesting their specific
relationship with tumor onset and development (Figure 7, panels B and D). The case of SPINK1 is peculiar: this gene was markedly down-regulated in cirrhotic compared to normal samples and then it is strongly up-regulated in HCC, confirming its potential role as a new marker for HCC, as recently proposed by Marshall et al. (2013) [44]. FOS displays a strong decrease in its expression level compared to the CIR-NORM condition.
Conclusions
The list of PPI occurring inside human cells is a precious source of information to drive the interpretation of ‘‘omics’’ screenings [5], despite its limits [52,53].
Simulating the impact of HCV-host interactions throughout the host PPI network, we have shown how proteins and pathways that are involved in HCV response and in the subsequent pathological states can be predicted considering HCV-host PPI interactions and the topology of the host PPI network. Our analysis provides evidences that, similarly to EBV and HPV [11], the effects of HCV-host interactions lie in network proximity to viral targets.
Beyond viral-host PPIs, our analysis has considered the transcriptional activity of liver cells collected from HCV-infected patients, in order to characterize the different phases of the hepatic disease. We observed that the differential expression detected in preneoplastic and neoplastic liver samples by two
independent studies occur in network proximity to HCV targets, which conversely display, as a whole, weaker gene expression variations.
The computational approach presented in this work can also be applied for studying other biological processes that can be brought back to a finite set of causal biological entities.
Considering the growing interest in developing modulators of PPIs [54,55], it will be important to design network-based approaches for the identification of ‘‘druggable’’ PPIs, selectively relevant for cells in pathological conditions. This will require a better understanding of the PPIs that are in fact occurring in the specific conditions of the living systems under analysis.
Methods
Protein-protein interaction data
We used the PPIs available in the STRING database v9.0 with score greater than 0.7, designated as ‘‘high confidence’’. Multiple pairs of protein identifiers referring to the same pair of Entrez Gene identifiers were summarized according to the highest score. We obtained a PPI network composed of a total of 14,116 unique human proteins involved in 223,088 PPIs. We used the viral-host interactions collected from De Chasseyet al. (2008) [16], Kwofieet al. (2011) [18], Dolanet al. (2013) [19], HPIDB [20], Intact [21], VirHostNet [22] and defined 591 unique human proteins that interact directly with HCV proteins, 517 of which appear in the PPI network.
Network Propagation
We used network propagation [12] to smooth the HCV interaction information over the PPI network. This method is closely related to a random walk with restarts on a graph. Specifically, we used the iterative algorithm of Zhouet al. [56]:
Ftz1~aW Ftzð1-aÞF0
where Fj is a vector of length n equal to the number of proteins of the PPI network, W is the n-by-n degree-normalized version of the adjacency matrix representing the PPI network, and a is a tuning parameter that establishes the relative importance of the two terms of the equation. This algorithm pumps the information available in the vertexes specified in F0 to their neighbors and, in
turn, every vertex diffuses the information received during the previous iteration to its neighbors. The algorithm is run interactively for t5[0, 1, 2, …] until convergence: (Ft+1- Ft) ,1e-6. The elements of W are obtained dividing the adjacency matrix A by the square root of the product of its row sums: wij5 aij (di dj)
-K
.
In our study, the 517 elements of F0 corresponding to HCV targets were
Gene expression data analysis
The raw data of the two datasets were separately processed and analyzed using the statistical software R. The data normalization was carried out using the gcrma method available in the simpleaffy package [57]. Differential expression was assessed with the limma package [58]. We considered as differentially expressed the genes with p-value ,0.05. We excluded two samples from the dataset GSE6764 because of quality issues, as reported by the authors [30]. We assessed the quality metrics of the microarray datasets using the arrayQualityMetrics package [59]. This quality control analysis did not identify any outlier.
Significance of protein lists overlaps and gene set enrichment
analysis
The statistical significance of the overlap between each pair of protein lists was calculated using the hypergeometric distribution implemented in R functions ‘‘phyper’’ and ‘‘dhyper’’. The GSEA [60] of HCV targets and differentially expressed genes was carried out using the R package HTSanalyzeR [61] ranking the genes by theirp-values in descending order. Thep-value is a recently proposed statistic that takes into account both the fold change andp-value [62]: the higher the p-value, the more significant the difference between the two samples.
Random subnetworks generation
Random subnetworks were created by random extension from randomly chosen ‘‘seed’’ proteins. For each subnetwork, while the number of protein was less than 10, a seed was selected and a maximum of 3 of its neighbors were added. After the first iteration, the seed protein was randomly selected among current nodes. In order to create 1,000 random (RND) subnetworks and 1,000 random subnetworks in network proximity to HCV targets (HRND) we used two different pools of seeds: 1,000 proteins tossed among all the human proteins (RND subnetworks) and the 1,000 proteins with the highest network propagation score (HRND subnetworks). This procedure ensured the definition of two sets of subnetworks with significantly different network proximity to HCV targets (Fig. S2).
Functional Annotation
The functional enrichment analysis to identify over-represented KEGG [63] and Reactome [64] pathways in DE gene lists was carried out using the Database for Annotation, Visualization and Integrated Discovery (DAVID) [65]. We
Text Mining
Literature-based text mining was performed using ProteinQuest (PQ) [67]. PQ is a web based platform for biomedical literature retrieval and analysis. PQ searches within PubMed abstracts and extracts the text of the image captions from free full text articles. PQ text-mining tool parses target documents searching for terms related to curated ontologies (e.g. diseases, bioprocesses, pathways, body parts). Multiple searches for more than one alias were used to resolve ambiguities in the terminology. We considered the following queries: ‘‘HCV AND CIR’’, ‘‘HCV AND HCC’’. Then, we calculated the number of co-occurrences of two terms (query and protein) in a minimum of 20 papers among those retrieved by each query. We obtained 71 and 75 proteins respectively for HCV-CIR and HCV-HCC queries.
Multi-Objective optimization
The search of PPIs subnetworks in (i) network proximity to HCV targets and (ii) differentially expressed was formulated as the multi-objective optimization problem of minimizing two objective functions. We solved this problem using an evolutionary algorithm that creates a population of subnetworks extracted from the whole PPI network and, then, iteration by iteration, modifies the subnetworks (adding and removing vertexes) in order to minimize simultaneously the objective functions [33]. Given x, a subset of the proteins included in the PPI network that form a connected subnetwork,s, the list of network propagation scores ranked in descending order,eD1andeD2, the lists of expression variations (log2fold changes)
in two datasets D1 and D2, ranked in descending order,xupandxdown, the subsets
of proteins of xthat are, respectively, up-regulated and down-regulated in both datasets D1 and D2, we defined:
f1ð Þx ~1{ESðx,sÞ
f2ð Þx ~ TES xup,xdown,eD1
zTES xup,xdown,eD2
=2
The quantity ES(x,y) is the enrichment score [60], it assumes values in the real interval [21,1] and indicates to which extent the elements of the setxare located at the top (ES -.1) or at the bottom (ES -.21) of the ranked listy. The quantity TES(x,z,y)51 - (ES(x,y) - ES(z,y))/2 is the inverse total enrichment score [68]; it assumes values in the real interval [0, 2] and it tends to 2 when the elements ofx
occur at the top of the ranked listy, while the elements ofzoccur at the bottom of
y. Thereforef1will be low if the subnetworkxis enriched in proteins in network
proximity to HCV targets, while f2will be low if the subnetwork xis enriched in
We used the gene expression datasets from Wurmbachet al. [30] and Maset al. [31]. We ranked gene expression differences on the basis of p-values [62] multiplied by the sign of the corresponding log fold change, in order to obtain up-regulated genes at the top and down-up-regulated genes at the bottom of the ranked list.
For each comparison, CIR-NORM and HCC-CIR, we run 10 times the multi-objective optimization using a population of 500 subnetworks (ranging from a minimum of 10 to a maximum of 50 vertexes) for 1,000 iterations. Subsequently, we defined the optimal subnetworks as those belonging to the non-dominated set (Pareto front), considering all the subnetworks generated for each comparison.
Supporting Information
Figure S1. Similarity between the rankings of host proteins obtained using network proximity scores or p-values. The similarity between the two ordered listsxandywas calculated as the mean of the enrichment score (ES) of the top of the list xin the list y and the ES of the top of the list y in the list x: sim51/2 * (ES(xtop, y) + ES(ytop,x)). We varied the definition of the tops ranging from 100
to 5,000 elements and observed the highest similarity when considering the top 1,500 elements of the lists. The similarity observed using several random lists of the same lengths is definitely lower.
doi:10.1371/journal.pone.0113660.s001 (TIF)
Figure S2. HCV-associated random networks. Estimated cumulative probability functions of HCV association (f2, the lower the value the higher the association) of
1,000 random networks (RND) and 1,000 HCV-associated random networks (HRND).
doi:10.1371/journal.pone.0113660.s002 (TIF)
Table S1. Top ranked proteins according to the network proximity to HCV targets. Columns - ‘‘is HCV target’’: 1 (yes), 0 (no); ‘‘score’’: network proximity score scaled in the [0, 1] interval; ‘‘score p-value’’: estimated probability of obtaining si by chance; ‘‘degree’’: number of PPI.
doi:10.1371/journal.pone.0113660.s003 (XLS)
Table S2. Published lists of proteins that mediate host response to early and chronic HCV infection and HCC.
doi:10.1371/journal.pone.0113660.s004 (XLS)
Table S3. Reactome pathway analysis of the CIR-NORM summary subnetwork. List of the statistically enriched pathways in the CIR-NORM subnetwork resulting from Reactome over-representation analysis.
doi:10.1371/journal.pone.0113660.s005 (XLS)
Table S4. Reactome pathway analysis of the HCC-CIR summary subnetwork. List of the statistically enriched pathways in the HCC-CIR subnetwork resulting from Reactome over-representation analysis.
Acknowledgments
We thank John Hatton of Institute of Biomedical Technologies (CNR-ITB) for proofreading the manuscript.
Author Contributions
Analyzed the data: EM RA. Contributed reagents/materials/analysis tools: LM. Wrote the paper: EM RA LM. Integrated PPI and gene expression data, designed and carried out network-based analyses (network propagation and multi-objective optimization) and enrichment analyses: EM. Selected the virus-host interaction data and the expression datasets, performed gene expression data analysis, functional annotation, text mining and biological explanation of PPI networks: RA. Coordinated the project: LM.
References
1. Arzumanyan A, Reis HM, Feitelson MA(2013) Pathogenic mechanisms in HBV-and HCV-associated hepatocellular carcinoma. Nature Reviews Cancer 13: 123–35.
2. Morgan RL, Baack B, Smith BD, Yartel A, Pitasi M, et al.(2013) Eradication of hepatitis C virus infection and the development of hepatocellular carcinoma: a meta-analysis of observational studies. Annals of Internal Medicine 158: 329–37.
3. Zender L, Villanueva A, Tovar V, Sia D, Chiang DY, et al. (2010) Cancer gene discovery in hepatocellular carcinoma. Journal of Hepatology 52: 921–929.
4. Shlomai A, de Jong YP, Rice CM(2014) Virus associated malignancies: The role of viral hepatitis in hepatocellular carcinoma. Semin Cancer Biol 26C: 78–88.
5. Wang PI, Marcotte EM(2010) It’s the machine that matters: Predicting gene function and phenotype from protein networks. J Proteomics 73: 2277–2289.
6. Raphael BJ (2013) Making connections: using networks to stratify human tumors. Nat Methods 10: 1077–1078.
7. Drozdov I, Bornschein J, Wex T, Valeyev NV, Tsoka S, et al. (2012) Functional and topological properties in hepatocellular carcinoma transcriptome. PLoS One 7: e35510.
8. Zheng S, Tansey WP, Hiebert SW, Zhao Z(2011) Integrative network analysis identifies key genes and pathways in the progression of hepatitis C virus induced hepatocellular carcinoma. BMC Med Genomics 4: 62.
9. He B, Zhang H, Shi T (2011) A comprehensive analysis of the dynamic biological networks in HCV induced hepatocarcinogenesis. PLoS One 6: e18516.
10. Mukhopadhyay A, Maulik U (2014) Network-based study reveals potential infection pathways of hepatitis-C leading to various diseases. PLoS One 9: e94029.
11. Gulbahce N, Yan H, Dricot A, Padi M, Byrdsong D, et al.(2012) Viral perturbations of host networks reflect disease etiology. PLoS Comput Biol 8: e1002531.
12. Vanunu O, Magger O, Ruppin E, Shlomi T, Sharan R(2010) Associating genes and protein complexes with disease via network propagation. PLoS Comput Biol 6: e1000641.
13. Hofree M, Shen JP, Carter H, Gross A, Ideker T (2013) Network-based stratification of tumor mutations. Nat Methods 10: 1108–1115.
14. Stokes ME, Barmada MM, Kamboh MI, Visweswaran S (2014). The application of network label propagation to rank biomarkers in genome-wide Alzheimer’s data. BMC Genomics 15: 282.
16. de Chassey B, Navratil V, Tafforeau L, Hiet MS, Aublin-Gex A, et al.(2008) Hepatitis C virus infection protein network. Mol Syst Biol 4: 230.
17. Tripathi LP, Kataoka C, Taguwa S, Moriishi K, Mori Y, et al.(2010) Network based analysis of hepatitis C virus core and NS4B protein interactions. Mol Biosyst 6: 2539–2553.
18. Dolan PT, Zhang C, Khadka S, Arumugaswami V, Vangeloff AD, et al. (2013) Identification and comparative analysis of hepatitis C virus-host cell protein interactions.t. Mol Biosys 9: 3199–3209.
19. Kwofie SK, Schaefer U, Sundararajan VS, Bajic VB, Christoffels A(2011) HCVpro: hepatitis C virus protein interaction database. Infect Genet Evol 11: 1971–1977.
20. Kumar R, Nanduri B (2010) HPIDB–a unified resource for host-pathogen interactions. BMC Bioinformatics. Suppl 6: S16.
21. Hermjakob H, Montecchi-Palazzi L, Lewington C, Mudali S, Kerrien S, et al.(2004) IntAct: an open source molecular interaction database. Nucleic Acids Res 32: D452–D455.
22. Navratil V, de Chassey B, Meyniel L, Delmotte S, Gautier C, et al.(2009) VirHostNet: a knowledge base for the management and the analysis of proteome-wide virus-host interaction networks. Nucleic Acids Res 37: D661–D668.
23. Franceschini A, Szklarczyk D, Frankild S, Kuhn M, Simonovic M (2013) STRING v9.1: protein-protein interaction networks, with increased coverage and integration. Nucleic Acids Res 41: D808– D815.
24. Matteucci C, Sorrentino R, Bellis L, Ettorre GM, Svicher V, et al.(2014) Detection of high levels of Survivin-immunoglobulin M immune complex in sera from hepatitis C virus infected patients with cirrhosis. Hepatol Res 44: 1008–1018.
25. Jackson MA, Lea I, Rashid A, Peddada SD, Dunnick JK (2006) Genetic alterations in cancer knowledge system: analysis of gene mutations in mouse and human liver and lung tumors. Toxicol Sci 90: 400–418.
26. Gale M Jr, Foy EM(2005) Evasion of intracellular host defence by hepatitis C virus. Nature 436: 939– 945.
27. Zhu Z, Wilson AT, Gopalakrishna K, Brown KE, Luxon BA, et al.(2010) Hepatitis C virus core protein enhances Telomerase activity in Huh7 cells. J Med Virol 82: 239–248.
28. Bauer-Mehren A, Bundschus M, Rautschka M, Mayer MA, Sanz F, et al. (2011) Gene-disease network analysis reveals functional modules in mendelian, complex and environmental diseases. PLoS One. 6: e20284.
29. Barrett T, Troup DB, Wilhite SE, Ledoux P, Rudnev D, et al.(2009) NCBI GEO: archive for high-throughput functional genomic data. Nucleic Acids Res 37: D885–D890.
30. Wurmbach E, Chen YB, Khitrov G, Zhang W, Roayaie S, et al. (2007) Genome-wide molecular profiles of HCV-induced dysplasia and hepatocellular carcinoma. Hepatology 45: 938–947.
31. Mas VR, Maluf DG, Archer KJ, Yanek K, Kong X, et al.(2009) Genes involved in viral carcinogenesis and tumor initiation in hepatitis C virus-induced hepatocellular carcinoma. Mol Med 15: 85–94.
32. Rehermann B (2009) Hepatitis C virus versus innate and adaptive immune responses: a tale of coevolution and coexistence. J Clin Invest 119: 1745–1754.
33. Mosca E, Milanesi L(2013) Network-based analysis of omics with multi-objective optimization. Mol Biosyst 9: 2971–2980.
34. Steuer RE(1986) Multiple Criteria Optimization: Theory, Computation and Application.y. New York: John Wile. 546 pp.
35. Tran G(2008) The role of hepatitis C virus in the pathogenesis of hepatocellular carcinoma. Bioscience Horizons 1: 167–175.
36. Zhao H, De BP, Das T, Banerjee AK(1996) Inhibition of human parainfluenza virus-3 replication by interferon and human MxA. Virology 220: 330–338.
38. Itsui Y, Sakamoto N, Kakinuma S, Nakagawa M, Sekine-Osajima Y, et al.(2009) Antiviral effects of the interferon-induced protein guanylate binding protein 1 and its interaction with the hepatitis C virus NS5B protein. Hepatology 50: 1727–1737.
39. Parisi GF, Di Dio G, Franzonello C, Gennaro A, Rotolo N, et al.(2013) Liver disease in cystic fibrosis: an update. Hepat Mon 13: e11215.
40. Chau TK, Marakami S, Kawai B, Nasu K, Kubota T, et al.(2000) Genotype analysis of the CYP2C19 gene in HCV-seropositive patients with cirrhosis and hepatocellular carcinoma. Life Sci 67: 1719–1724.
41. Feranchak AP, Doctor RB, Troetsch M, Brookman K, Johnson SM, et al.(2004) Calcium-dependent regulation of secretion in biliary epithelial cells: the role of apamin-sensitive SK channels.
Gastroenterology 127: 903–913.
42. Banerjee A, Ray RB, Ray R(2010) Oncogenic potential of hepatitis C virus proteins. Viruses 2: 2108– 2133.
43. Lin SY, Pan HW, Liu SH, Jeng YM, Hu FC, et al.(2008) ASPM is a novel marker for vascular invasion, early recurrence, and poor prognosis of hepatocellular carcinoma. Clin Cancer Res 14: 4814–4820.
44. Marshall A, Lukk M, Kutter C, Davies S, Alexander G, et al.(2013) Global gene expression profiling reveals SPINK1 as a potential hepatocellular carcinoma marker. PLoS One 8: e59459.
45. Maass T, Sfakianakis I, Staib F, Krupp M, Galle PR, et al.(2010) Microarray-based gene expression analysis of hepatocellular carcinoma. Curr Genomics 11: 261–268.
46. Eferl R, Wagner EF(2003) AP-1: a double-edged sword in tumorigenesis. Nat Rev Cancer 3: 859–868.
47. Min L, Ji Y, Bakiri L, Qiu Z, Cen J, et al.(2012) Liver cancer initiation is controlled by AP-1 through SIRT6-dependent inhibition of survivin. Nat Cell Biol 14: 1203–1211.
48. Bie`che I, Asselah T, Laurendeau I, Vidaud D, Degot C, et al.(2005) Molecular profiling of early stage liver fibrosis in patients with chronic hepatitis C virus infection. Virology 332: 130–144.
49. Behnke MK, Reimers M, Fisher RA (2013) Stem cell and hepatocyte proliferation in hepatitis C cirrhosis and hepatocellular carcinoma: transplant implications. Ann Hepatol 13: 45–53.
50. Chen H, Shen ZY, Xu W, Fan TY, Li J, et al.(2014) Expression of P450 and nuclear receptors in normal and end-stage Chinese livers. World J Gastroenterol 20: 8681–8690.
51. Wei L, Lian B, Zhang Y, Li W, Gu J, et al.(2014) Application of microRNA and mRNA expression profiling on prognostic biomarker discovery for hepatocellular carcinoma. BMC Genomics 15: S13
52. Venkatesan K, Rual JF, Vazquez A, Stelzl U, Lemmens I, et al.(2009) An empirical framework for binary interactome mapping. Nat Methods 6: 83–90.
53. De Las Rivas J, Fontanillo C(2010) Protein–Protein Interactions Essentials: Key Concepts to Building and Analyzing Interactome Networks. PLoS Comput Biol 6: e1000807.
54. Ivanov AA, Khuri FR, Fu H (2013) Targeting protein-protein interactions as an anticancer strategy. Trends Pharmacol Sci 34: 393–400.
55. Milroy LG, Grossmann TN, Hennig S, Brunsveld L, Ottmann C(2014) Modulators of Protein–Protein Interactions. Chem Rev 114: 4695–4748.
56. Zhou D, Bousquet O, Lal TN, Weston J, Scholkopf B (2003) Learning with local and global consistency. In: Thrun S, Saul LK, Scho¨lkopf B, editors. Advances in Neural Information Processing Systems 16. London: The MIT Press.
57. Wilson CL, Miller CJ(2005) Simpleaffy: a BioConductor package for Affymetrix Quality Control and data analysis. Bioinformatics 21: 3683–3685
58. Smyth GK(2005) Limma: linear models for microarray data. In, Gentleman R, Carey V, Dudoit S, Irizarry R, Huber W, Bioinformatics and Computational Biology Solutions Using {R} and Bioconductor. New York: Springer.
59. Kauffmann A, Gentleman R, Huber W(2009) arrayQualityMetrics–a bioconductor package for quality assessment of microarray data. Bioinformatics 25: 415–416.
61. Wang X, Terfve C, Rose JC, Markowetz F (2011) HTSanalyzeR: an R/Bioconductor package for integrated network analysis of high-throughput screens. Bioinformatics 15: 879–880.
62. Xiao Y, Hsiao TH, Suresh U, Chen HI, Wu X, et al.(2014) A novel significance score for gene selection and ranking. Bioinformatics 30: 801–807.
63. Kanehisa M, Goto S(2000) KEGG: Kyoto Encyclopedia of Genes and Genomes. Nucleic Acids Res 28: 27–30.
64. Croft D, Mundo AF, Haw R, Milacic M, Weiser J, et al.(2014) The Reactome pathway knowledgebase. Nucleic Acids Res 42: D472–D477.
65. Huang da W, Sherman BT, Lempicki RA(2009) Systematic and integrative analysis of large gene lists using DAVID bioinformatics resources. Nat Protoc 4: 44–57.
66. Haw R, Hermjakob H, D’Eustachio P, Stein L(2011) Reactome pathway analysis to enrich biological discovery in proteomics data sets. Proteomics 11: 3598–3613.
67. BiodigitalValley: ProteinQuest, a web based platform for the mining of Medline papers. Available:http:// www.proteinquest.com. [Online] 2013.