J Educ Eval Health Prof 2012, 9: 7 • http://dx.doi.org/10.3352/jeehp.2012.9.7
RESEARCH ARTICLE
Open Access
Breadth of knowledge vs. grades: What best predicts
achievement in the irst year of health sciences programmes?
Boaz Shulruf
1,*, Meisong Li
1, Judy McKimm
2, Melinda Smith
11Centre for Medical and Health Sciences Education, Faculty of Medical and Health Sciences, University of Auckland, Auckland, New Zealand; 2College of Medicine, Swansea University, Swansea, UK
Abstract
This study aimed to identify those features within secondary school curricula and assessment, particularly science sub-jects that best predict academic achievement in the irst year of three diferent three-year undergraduate health profes-sional programmes (nursing, pharmacy, and health sciences) at a large New Zealand university. In particular, this study compared the contribution of breadth of knowledge (number of credits acquired) versus grade level (grade point aver-age) and explored the impact of demographic variables on achievement. The indings indicated that grades are the most important factor predicting student success in the irst year of university. Although taking biology and physics at second-ary school has some impact on university irst year achievement, the efect is relatively minor.
Key Words: Nursing students; Pharmacy students; Students, premedical; College admission test; Educational measurement
INTRODUCTION
In 2002, the New Zealand Qualiication Authority (NZQA) introduced a new secondary school assessment system: the National Certificate of Educational Achievement (NCEA). Prior to this, the secondary school assessment system includ-ed the School Certiicate and New Zealand Bursary, both of which were norm-based examination systems where a ‘learn-er’s achievement was ranked against outcomes of others in a group’ [1]. he change in the secondary school qualiication system from a norm- to standards-based system was a major move, which had wide-ranging implications across New Zea-land’s secondary and tertiary education sectors [2-4]. One con-sequence was the need for university admission processes to be reformed in order to meet the requirements of the new sys-tem; however, no empirical evidence was available to inform changes in selection processes [5].
he irst NCEA cohort completed their schooling in 2004, and to date, only a small number of studies have been pub-lished on the impact of NCEA results on university achieve-ment [6-10]. hese studies, particularly those by Shulruf et al. [6, 9, 10], suggest that the quality of learning (i.e., the grades achieved in NCEA exams) has a higher predictive power for student achievement at university than the number of credits acquired [for details see: 6], i.e., the breadth of learning. his is consistent with other studies on the relationship between grades and subsequent achievement in tertiary education [11-15]. In particular, it is noted that achievement in some sub-jects (e.g., mathematics, physics, and the natural sciences) has a greater predictive power for university first year achieve-ment in general than does that of subjects in the humanities and social sciences [14]. here is little published research on the impact of breadth of knowledge on student achievement. Indeed, the only systematic review on the impact of second-ary school course-taking on university achievement found a low efect size (r = 0.24) [9].
Universities in New Zealand invest major resources, in terms of time and efort, in selecting and training the most
appropri-*Corresponding email: [email protected]
ate students in nursing, pharmacy, and health sciences pro-grammes. However, no study has yet been published that ex-plores the impact of breadth of knowledge (number of credits gained) as well as grade level achieved (e.g., subject grades, grade point average [GPA]) in secondary school on student achievement in these programmes, let alone within the con-text of the NCEA, New Zealand’s unique secondary school as-sessment system.
he overarching aim of this study is to identify features with-in the secondary school qualiication system that best predict achievement in three selected undergraduate professional heal-th science programmes at heal-the University of Auckland (UoA) in New Zealand. These programmes are: bachelor in health sciences (BHSC), bachelor in pharmacy (BPHAR), and bach-elor in nursing (BNURS).
A number of studies have explored factors predicting aca-demic achievement and progression in nursing and pharmacy programmes and concluded that pre-admission GPA or high pre-university academic achievement is a good predictor for early academic achievement in professional programmes [16, 17]. his has also been supported by other studies focussing on medicine [18-20].
Subjects taken and achievement in these subjects are also important indicators of academic achievement in the early years of professional programmes. Many studies indicate that pre-admission high grade achievement in biology, mathemat-ics, and another science subject predicts academic achieve-ment in the early parts of the programmes (where curricula tend to be structured around biomedical or natural sciences). However, this effect levels out as students progress through their studies, and in particular as students move into clinical areas in the later stages of a degree, or professional practice following graduation [21-23]. he pre-admission GPA is there-fore much less relevant as a predictor of professional perfor-mance and overall capability than of academic (knowledge-based) achievement. Internationally, many health professional programmes have moved away from reliance on academic performance (as typified by pre-admission GPA or equiva-lent) as the only, or key, measure of aptitude prior to admis-sion. Most professional programmes include interview or per-formance tests and increasingly ofer speciic testing program-mes designed for individual professions, such as the Test of Essential Academic Skills (TEAS), a nursing aptitude test used in the United States [17] or the multiple mini-interview (MMI). Newton et al. [17] suggested that both scholastic aptitude (as measured by previous GPA) and nursing aptitude (as mea-sured by TEAS) are important to predict later performance and completion of nursing programmes.
he study by McCall et al. [21] on the inluence of admission tests on Pharmacy Licensing Examination scores concluded
that the pre-pharmacy GPA had a positive but low correlation with subsequent performance on the licensing examination. However, GPA was only one of a number of admission vari-ables that correlated with the licensing examination score, and the capability of these admission variables to predict perfor-mance was relatively low. McCall et al. [21] suggest that “com-pletion of a four year professional degree pharmacy program ultimately ‘levels the ield’ ”. A systematic review conducted by Ferguson et al. [24] examining data on the predictive validity of factors believed to be significant predictors of success in medicine also found that on average previous academic per-formance accounted for 23% of the variance in undergraduate achievement and 6% of the variance in postgraduate compe-tence.
he New Zealand’s NCEA is unique in providing highly de-tailed information on student achievement [25, 26]. In partic-ular, it provides information on the breadth of knowledge that is measured by the number of credits students have acquired since credits are given to unit or achievement standards (de-scribed below) that each student successfully obtains. he stan-dards normally cover discrete topics and students are not per-mitted to sit for the examinations of two or more overlapping topics [26]. A student passing an assessment relating to any NCEA standard indicates that they have reached a threshold of knowledge and competence in a particular topic. However, the level of competency cannot be identiied by measuring the number of credits; the level of competency can only be mea-sured by the grade achieved [6].
Robust models for the analysis of NCEA results have recen-tly been developed by Shulruf et al. [6, 10, 26]. he study re-ported in this paper uses their [26] deinition of NCEA GPA to measure quality of learning and takes the analysis a signii-cant step forward by looking at the impact of achievement in individual subjects on three discrete academic programmes. his study illuminates some important features of the NCEA in relation to predicting future students’ success in nursing, pharmacy and health science programmes.
It is acknowledged that students’ academic achievement in their irst two years at university is a complex mix of factors. hese relate not only to individual ability, learning styles and preferences, motivation and engagement with the courses on ofer, but also to the relationship between the content, concep-tualisation of knowledge, understanding and level of achieve-ment in ‘subjects’ taken via NCEA, and the way in which these ‘subjects’ are presented, taught and assessed at university. his study, however, focuses only on the relationships between achi-evement in NCEA (grades, and number of credits gained) and subsequent academic achievement (as measured by GPA) in the irst year of university.
(US) and ‘achievement standards’ (AS). Programmes taught in schools can be assessed using either US or AS, or a combi-nation of both. For each AS, a student can achieve any of four levels of achievement: ‘not achieved’, ‘achieved’, ‘merit’ or ‘ex-cellence’. US, on the other hand, ofer only two levels of achieve-ment: ‘not achieved’ or ‘achieved’. Both standards are usually ofered at levels 1, 2, and 3, depending upon the degree of dif-iculty. However, US achievements, particularly in vocational subjects, may go beyond level 3. Typically, but not necessarily, level 1 standards are taught in Year 11, level 2 in Year 12, and level 3 in Year 13 (last year of secondary school). Each stan-dard achieved is worth a prescribed number of credits, usually relecting the number of hours a student would be expected to study to complete the standard [26].
With the introduction of the NCEA, NZQA also introduced a system of grade averages based on the grade achieved for each AS or US [26]. Assigning an overall grade average for NCEA outcomes assists with university admission decisions for ‘limited entry’ tertiary qualiications (where there is strong competition among applicants for a limited number of plac-es). In calculating the grade average, “not achieved” scores zero; “achieved” scores two; three is assigned to ‘merit’; and four is allocated to ‘excellence’ [26]. At the UoA, for example, applicants are ranked according to the grade average of their best 80 credits at level 3 or higher, over a maximum of ive ap-proved subjects. In addition, students applying for certain pro-grammes (particularly those with limited entry numbers such as medicine and health professional programmes) may be re-quired to have credits in speciic subjects and/or to have a thre-shold GPA which is higher than the baseline for university en-trance (Table 1).
MATERIALS AND METHODS
he analysis in this study used NCEA results for subjects on the University’s ‘approved subjects’ list only (Table 1). he struc-ture of the NCEA distinguishes between the breadth of know-ledge acquired (represented by the number of credits gained) and the level of knowledge (represented by the NCEA subject GPA - the weighted mean of the grades of all standards stu-dents take within each subject). heoretically, these two vari-ables are independent although the correlation between these variables (for the overall NCEA GPA and overall number of credits) is relatively high (r = 0.67). Other variables included in the analysis are gender, ethnicity (ethnicities are deined as Pākehā [NZ European], Māori [the NZ indigenous people], Pacific Islanders, Asians, and others) and school decile - an index for the socioeconomic status (1 is low and 10 is high) of the school’s student population. In this study, private schools were included as decile 11 since most of them are very selec-tive and typically include students from more aluent families. Administrative data relating to 245 students who sat for the NCEA level 3 (L3) examination in 2004 and subsequently studied irst year programmes in the BPHAR (n = 72; females 76% ), BNURS (n = 49; females 88%), and BHSC (n = 124; fe-males 64%) were used in this study. Student distribution by programme and ethnicity is presented in Table 2. Based on the literature reviewed (cited in the introduction) we assumed that secondary school experiences, particularly learning out-comes, afect learning outcomes at the university, and hence used a linear regression model. The independent variables were demographic variables (gender, ethnicity, and school so-cioeconomic decile) and NCEA achievements (credits gained
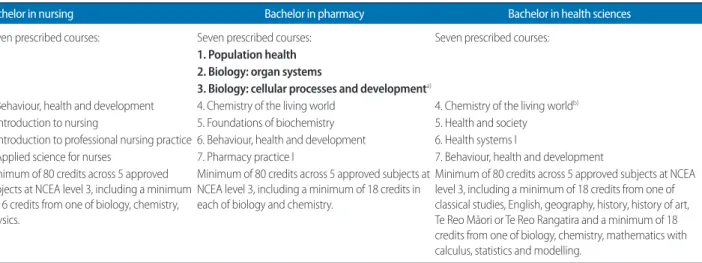
Table 1. University of Auckland medical and health sciences programmes: courses and entry requirements 2005
Bachelor in nursing Bachelor in pharmacy Bachelor in health sciences
Seven prescribed courses: Seven prescribed courses: Seven prescribed courses:
1. Population health 2. Biology: organ systems
3. Biology: cellular processes and developmenta)
4. Behaviour, health and development 4. Chemistry of the living world 4. Chemistry of the living worldb)
5. Introduction to nursing 5. Foundations of biochemistry 5. Health and society
6. Introduction to professional nursing practice 6. Behaviour, health and development 6. Health systems I
7. Applied science for nurses 7. Pharmacy practice I 7. Behaviour, health and development
Minimum of 80 credits across 5 approved subjects at NCEA level 3, including a minimum of 16 credits from one of biology, chemistry, physics.
Minimum of 80 credits across 5 approved subjects at NCEA level 3, including a minimum of 18 credits in each of biology and chemistry.
Minimum of 80 credits across 5 approved subjects at NCEA level 3, including a minimum of 18 credits from one of classical studies, English, geography, history, history of art, Te Reo Māori or Te Reo Rangatira and a minimum of 18 credits from one of biology, chemistry, mathematics with calculus, statistics and modelling.
NCEA, National Certiicate of Educational Achievement.
Table 2. Student distribution by ethnicity and programme
Ethnicity Bachelor in health sciences
Bachelor in nursing
Bachelor in pharmacy Total
Pakeha 30 (24) 19 (39) 15 (21) 64 (26)
Maori 6 (5) 0 (0) 0 (0) 6 (2)
Paciic 14 (11) 3 (6) 2 (3) 19 (8)
Asian 59 (48) 26 (53) 50 (69) 135 (55)
Other 15 (12) 1 (2) 5 (7) 21 (9)
Total 124 (100) 49 (100) 72 (100) 245 (100)
Values are presented as number (%).
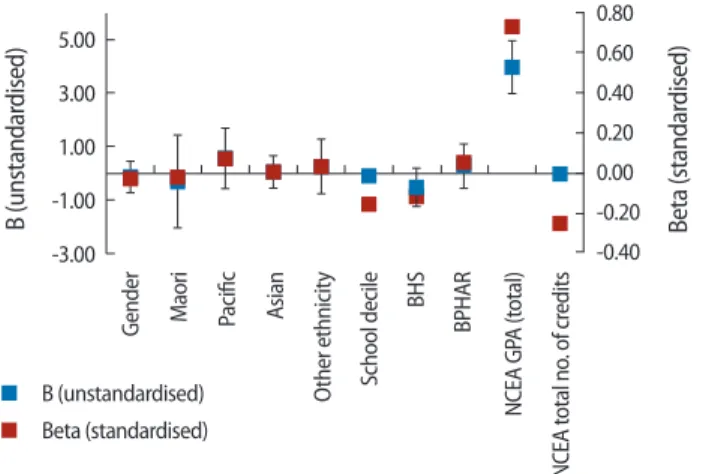
Fig. 1. Linear regression, all students (summary NCEA; stepwise method). B (unstandardised), Beta (standardised) coeicients. BHSC, bachelor in health sciences; BPHAR, bachelor in pharmacy; NECA, National Certii-cate of Educational Achievement; GPA, grade point average.
5.00
3.00
1.00
-1.00
-3.00
0.80
0.60
0.40
0.20
0.00
-0.20
-0.40
B
(u
n
st
an
d
ar
d
is
ed
)
B
et
a
(s
ta
n
d
ar
d
is
ed
)
G
en
d
er
M
ao
ri
Pa
ci
i
c
A
si
an
O
th
er
e
th
n
ic
it
y
Sc
h
o
o
l d
ec
ile
B
H
S
B
P
H
A
R
N
C
EA
G
PA
(t
o
ta
l)
N
C
EA
to
ta
l n
o.
o
f c
re
d
it
s
Beta (standardised) B (unstandardised)
Table 3. Linear regression all students (summary NCEA)
Unstandardised coeicients Standardized coeicients
t Sig. 95% conidence interval for B
B SE Beta
(Constant) -1.31 0.97 -1.35 0.179 -3.24 to 0.61
Gendera) -0.15 0.31 -0.03 -0.48 0.633 -0.75 to 0.46
Maorib) -0.31 0.88 -0.02 -0.35 0.725 -2.05 to 1.43
Paciicb) 0.54 0.57 0.07 0.95 0.345 -0.58 to 1.66
Asianb) 0.03 0.31 0.01 0.09 0.927 -0.58 to 0.64
Other ethnicityb) 0.24 0.52 0.03 0.47 0.641 -0.78 to 1.27
School decile -0.11 0.05 -0.15 -2.44 0.016 -0.20 to -0.02
BHSCc) -0.53 0.36 -0.12 -1.48 0.139 -1.23 to 0.17
BPHARc) 0.26 0.42 0.05 0.63 0.528 -0.56 to 1.09
NCEA GPA (total) 3.96 0.51 0.73 7.82 0.000 2.96 to 4.96
NCEA total no. of credits -0.03 0.01 -0.25 -3.08 0.002 -0.04 to -0.01
NCEA, National Certiicate of Educational Achievement; SE, standard error; BHSC, bachelor in health sciences; BPHAR, bachelor in pharmacy; GPA, grade point aver-age.
a)Reference, male. b)Reference, European/Pakeha. c)Reference, nursing. and NCEA GPA per subject). he dependent variable was the student’s end of irst year UoA GPA in these programmes.
Linear regression models were employed to identify the pre-dictors of student UoA GPA. he regression models employed two blocks. The first block included demographic variables, including the programmes studied at the university (‘enter me-thod’ i.e., all variables entered at once); and the second block included subject NCEA GPA and number of credits of all NC-EA subjects (‘stepwise method’). he stepwise method is pref-erable for such an exploratory investigation and has been com-monly employed in similar research [22, 27-29].
he NCEA comprises thousands of learning standards across tens of subjects [26]; therefore, there are a large number of mis-sing values for the NCEA subject GPA and credit numbers that could jeopardise any regression analysis. To overcome this chal-lenge and enable us to measure the impact of secondary school learning, we assumed that the contribution of a subject to stu-dent knowledge was similar if the stustu-dent achieved a fail (NC-EA subject GPA, 0) or did not study that subject.
RESULTS
he overarching aim of this study is to identify those features of the NCEA that best predict achievement (as measured by UoA GPA) in three selected health professional programmes (BHSC, BPHAR, and BNURS). In particular, this study focus-es on two speciic objectivfocus-es: 1) to compare the contribution of breadth of knowledge and grades to achievement in these undergraduate programmes; and 2) to identify the impact of demographic variables on achievement in these programmes.
Table 4. Linear regression all students all programmes (dependent variable 1st year GPA)
B (unstandardised) SE Beta (standardised) t Sig. 95% conidence interval
(Constant) 3.30 0.67 4.94 0.000 1.98 to 4.62
Gendera) 0.25 0.32 0.05 0.76 0.450 -0.39 to 0.88
Maorib) -0.58 0.93 -0.04 -0.62 0.537 -2.41 to 1.26
Paciicb) 0.13 0.58 0.02 0.22 0.824 -1.02 to 1.28
Asianb) -0.05 0.33 -0.01 -0.14 0.890 -0.69 to 0.60
Other ethnicityb) -0.26 0.54 -0.03 -0.49 0.626 -1.33 to 0.80
School decile -0.01 0.05 -0.01 -0.16 0.872 -0.10 to 0.09
BHSCc) -0.48 0.38 -0.11 -1.28 0.202 -1.22 to 0.26
BPHARc) 1.10 0.41 0.23 2.68 0.008 0.29 to 1.90
GPA biology 1.70 0.37 0.69 4.65 0.000 0.98 to 2.42
No. of credits biology -0.15 0.04 -0.52 -3.50 0.001 -0.24 to -0.07
GPA physics 1.14 0.47 0.61 2.42 0.017 0.21 to 2.07
No. of credits Japanese -0.06 0.03 -0.14 -2.27 0.024 -0.11 to -0.01
GPA visual arts -0.60 0.30 -0.13 -2.05 0.042 -1.19 to -0.02
No. of credit physics -0.11 0.05 -0.50 -1.98 0.049 -0.21 to 0.00
GPA, grade point average; SE, standard error; BHSC, bachelor in health sciences; BPHAR, bachelor in pharmacy. a)Reference, male. b)Reference, European/Pakeha. c)Reference, nursing.
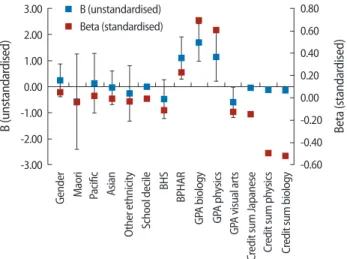
Fig. 2. Linear regression, all students (individual subjects; stepwise me-thod). B (unstandardised), Beta (standardised) coeicients. Creadit sum is summary of credits earned in a ield of study. GPA, grade point aver-age; BPHAR, bachelor in pharmacy; BNURS, bachelor in nursing; BHSC, bachelor in health sciences.
3.00 2.00 1.00 0.00 -1.00 -2.00 -3.00 0.80 0.60 0.40 0.20 0.00 -0.20 -0.40 -0.60 B (u n st an d ar d is ed ) B et a (s ta n d ar d is ed ) G en d er M ao ri Pa ci i c A si an O th er e th n ic it y Sc h o o l d ec ile B H S B P H A R G PA b io lo g y G PA p h ys ic s G PA v is u al a rt s C re d it s u m J ap an es e C re d it s u m p h ys ic s C re d it s u m b io lo g y Beta (standardised) B (unstandardised)
Fig. 3. Linear regression bachelor in health sciences (BHSC). B (unstan-dardised), Beta (standardised) coeicients. GPA, grade point average.
4.00 2.00 0.00 -2.00 -4.00 1.00 0.80 0.60 0.40 0.20 0.00 -0.20 -0.40 -0.60 B (u n st an d ar d is ed ) B et a (s ta n d ar d is ed ) G en d er M ao ri Pa ci i c A si an O th er e th n ic it y Sc h o o l d ec ile G PA b io lo g y C re d it s u m b io lo g y Beta (standardised) B (unstandardised)
acquired and overall NCEA GPA achieved) (Table 3, Fig. 1). he results show that, with the exception of school decile (which had a small negative efect, i.e., the higher the decile the lower the first year GPA) (Tables 3, 4), demographic variables did not afect irst year UoA GPA. In addition, although there were diferences in NCEA achievement between students entering diferent programmes, the diference in irst year UoA GPA across programmes (BHSC, BNURS, and BPHAR) was insig-nificant. However, the largest impact on UoA GPA was the NCEA GPA (beta, 0.73). he number of credits acquired,
how-ever, had a smaller, but negative, impact (beta, -0.25). To identify the impact of individual subjects, the next analy-sis included a similar linear regression model that included the same variables. However, in this case the summative re-sults of the NCEA rere-sults on each subject (NCEA subject GPA and subject number of credits) were included in the model using the Stepwise method (Table 4, Fig. 2). he results were interesting on two fronts: 1) that demographic variables had no efect on student irst year UoA GPA and 2) that only biol-ogy and physics subjects had a positive efect on the overall irst year UoA GPA, and that the impact came from the NCEA GPA rather than the number of credits.
sep-arately used for students in each programme. he results (Figs. 3-5; regression tables are not presented) demonstrate that, with the exception of school decile, which had a signiicant positive impact only on BPHAR students (Fig. 5), demographic vari-ables did not have a signiicant impact on students’ irst year UoA GPA. In terms of subjects, none of the subjects had any impact on BPHAR irst year UoA GPA. he NCEA GPA in biology had a positive and signiicant impact on irst year UoA GPA for the BHSC students; however, the impact of the num-ber of credits acquired in biology was negative (Fig. 3). For students in the BNURS programme, NCEA GPA in biology, physics, and economics had a positive and signiicant impact (Fig. 4). It is also noted that the only signiicant diference in the independent variables across the programmes was in their total NCEA GPA (P = 0.001), where BPHAR students had sig-niicantly higher NCEA GPA than their BNURS and BHSC counterparts (Fig. 6).
DISCUSSION
he objectives of this study were twofold: 1) to compare the contribution of breadth of knowledge and grades to the suc-cess in three undergraduate health professional programmes (BHSC, BNURS, and BPHAR) and 2) to identify the impact of demographic variables on achievement in these program-mes. In terms of the irst objective, the most important inding was that grades had a signiicant positive impact on student achievement in these programmes while breadth of knowledge had no impact at all. Although it has previously been shown that the size efect of the impact of courses taken at secondary school on tertiary education achievement appears to be rela-tively low (r = 0.24) [9], research exploring the impact of spe-ciic secondary school knowledge on university achievement could not be identiied in the literature. However, the impact of secondary school grades and aptitude tests on university achievement has been thoroughly investigated and indicates a moderate association [15, 22]. he indings of this study pro-vide a unique insight into this issue, suggesting that, while the GPA does make a diference, the number of credits gained in school, that is, breadth of knowledge, made little diference in terms of achievement in three undergraduate health profes-sion programmes.
It should be noted that national university entrance in New Zealand and the admissions criteria for these programmes in particular specifies some subjects as mandatory; therefore, students do not gain entry with a free choice of subjects, as they might in other countries [26]. he UoA’s admission crite-ria for the three programmes investigated in this study require students to strategically navigate their studies through the sec-ondary school curriculum and assessment system (NCEA). However, many fail to manage this, particularly in lower de-cile schools, where career advice or parental guidance regard-ing university entrance to specific programmes may be less available to pupils [6, 7, 30, 31]. Selecting students on their NCEA GPA, which emphasises the grade level of achievement in secondary school, however, might not only improve the
Fig. 4. Linear regression bachelor in nursing (BNURS). B (unstandardised), Beta (standardised) coeicients. GPA, grade point average.
6.00 4.00 2.00 0.00 -2.00 -4.00 -6.00 0.50 0.30 0.10 -0.10 -0.30 -0.50 B (u n st an d ar d is ed ) B et a (s ta n d ar d is ed ) G en d er Pa ci i c A si an O th er e th n ic it y Sc h o o l d ec ile G PA b io lo g y G PA e co n o m ic s G PA p h ys ic s Beta (standardised) B (unstandardised) B (u n st an d ar d is ed )
Fig. 5. Linear regression bachelor in pharmacy (BPHAR). B (unstandar-dis ed), Beta (standar(unstandar-dised) coeicients.
6 4 2 0 -2 0.3 0.25 0.2 0.15 0.1 0.05 0 -0.05 B et a (s ta n d ar d is ed ) G en d er Pa ci i c A si an O th er e th n ic it y Sc h o o l d ec ile Beta (standardised) B (unstandardised)
Fig. 6. Grade point average (GPA) of the National Certiicate of Education-al Achievement (NCEA) by university academic programmes. BPHAR, bachelor in pharmacy; BNURS, bachelor in nursing; BHSC, bachelor in health sciences. BPHAR BNURS BHSC A ca d em ic p ro g ra m
2.00 2.20 2.40 2.60
student selection process, in terms of relecting students’ po-tential achievement in the health professions programmes, but may also address important equity issues and enable more students from under-represented groups to enter and succeed in these programmes. his could ultimately reduce the need for special or airmative action admission policies [6, 10].
A second implication stemming from objective [1] relates to decisions made while students are still studying at second-ary school and their ability to overcome potential barriers to success, mainly subject choice, which is an important factor afecting their eligibility for admission. he results of this study suggest that, irrespective of subjects taken and breadth of know-ledge acquired, once students have been admitted to universi-ty, it is their secondary school grades (i.e., levels of achieve-ment) that have the greatest impact on their achievement in the irst year of university study (Tables 3, 4, Fig. 1). hus, level (rather than breadth of knowledge) has a greater impact on university GPA. However, it is noted that the NCEA GPA in biology, and to a lesser extent in physics, had the greatest im-pact on university GPA in BHSC and BNURS, but not in BP-HAR. his inding is notable as it suggests that level of knowl-edge, if relevant to the undergraduate programme, impacts student achievement. Consequently, if breadth of knowledge has a negligible impact on achievements (Tables 3, 4, Fig. 1), it is suggested that a key factor for success in BNURS and BHSC programmes is the achievement of high grades in biology and physics.
he challenge of making the right decisions under current admission policies is great, and a mineield for students to ne-gotiate [7, 30]. If current admission policies are to remain un-altered, schools need to take the lead in providing students with high-quality, fully-informed university/career advice to assist them in planning for university entry and enhance their chances of both admission and success.
It is interesting to note that achievements in the BPHAR were not afected by NCEA results (Fig. 5). An explanation for this is shown in Fig. 6, which indicates that students in BPHAR had a signiicantly higher NCEA GPA. his inding is impor-tant and provides additional support to the notion above re-lating to the importance of level of knowledge. he BPHAR indings suggest that achieving a threshold (or ‘high enough’) NCEA GPA may secure success in the BPHAR programme regardless of demographic factors or the number of credits achieved, as these did not have any signiicant impact on the university GPA. his suggests that once students achieve a thre-shold NCEA GPA, regardless of the subjects, they are likely to succeed in predominantly knowledge-based early university studies. As noted earlier, however, this does not predict subse-quent achievement or performance in clinical or professional practice, which supports ‘mixed methods’ admissions policies
for health professions’ programmes.
he second objective of this study was to identify the im-pact of demographic variables on achievement in these pro-grammes. he results indicate that ethnicity and gender did not have any signiicant impact on university GPA, with the exception of females, who had significantly higher achieve-ment in the BNURS programmes than males. On the one hand, this inding suggests that the current admission processes of these three programmes allow the enrolment of students whose potential to succeed is unrelated to their socio-demographic status. On the other hand, however, it is possible that students from under-represented groups are actually under-represent-ed among the applicants to these programmes, which ultima-tely afects the student population (unfortunaultima-tely no data to investigate this further were available). If this is the case, it is important to find appropriate ways to enhance and address equity via secondary schools as well as through appropriate changes in the admission criteria [6].
hree caveats must be considered in interpreting the ind-ings of this study. Since the study used data from students who had already been admitted to the programmes, there is some risk of bias relating to the restriction of range [32]. However, since undertaking a randomised controlled study is not feasi-ble or ethical, further research on this topic, using other ac-ceptable methodologies (e.g., quasi experimental design) is recommended, particularly if admission policies change. he second caveat relates to the diferences in the admission crite-ria and selection methods (Table 1) across the programmes investigated in this study [33]. For example, admission proce-dures to the BPHAR and BNURS programmes include an in-terview, which is not required for admission to the BHSC pro-gramme. Unfortunately, information on the results of the in-terviews was not available and was therefore not included in the analysis. Hence, the impact of the interview component within the selection process on admission, and students’ sub-sequent performance, remains unknown and might afect the results. Finally, it was not possible to investigate the inluence and impact of the diferent programmes’ curricula, teaching or learning and assessment methods on irst year performance. This is another important area for further research and not within the scope of this study.
students face similar challenges. This study clearly indicates that level of knowledge (identiied by grades) is the most im-portant factor predicting student success in the first year of university. Studying subjects in secondary schools that are rel-evant to the early stages of these programmes (i.e., biology or physics) is helpful; however, a breadth of achievement across diferent topics with mediocre grades does not predict subse-quent academic success. Hence, it is suggested that policy mak-ers, educational institutions and students work together to im-prove academic pathways within and beyond secondary edu-cation, particularly leading to undergraduate programmes in the health professions.
CONFLICT OF INTEREST
No potential conlict of interest relevant to this article was reported.
ACKNOWLEDGMENTS
he authors wish to thank Hilary Tolley for her assistance in preparing this manuscript for publication. he authors wish to acknowledge the Star-path Project, which contributed the data for this study.
REFERENCES
1. Crot C. he conlicting world of standards-based assessment. In: National Conference of the New Zealand Association for Re-search in Education; 1993 Dec 2-5; Hamilton, New Zealand. 2. Wilson P. Potential impacts of the new school qualiications
en-vironment in New Zealand on tertiary engineering education. Glob J Eng Educ. 2003;7:103-12.
3. Dobric K. Discourses in qualiications policy adoption in New Zealand, 1996-2000: identifying power imbalances in a trans-formative process. In: First International Congress of Qualitative Inquiry; 2005 May 5-7; Urbana-Champaign, IL, USA.
4. Crooks TJ. Educational assessment in New Zealand schools. As-sess Educ Princ Policy Pract. 2002;9:237-53.
5. University of Auckland. Admission to the University of Auckland in 2005 for year 13 students. Auckland: University of Auckland; 2003.
6. Shulruf B, Hattie J, Tumen S. he predictability of enrolment and irst-year university results from secondary school performance: the New Zealand National Certiicate of Educational Achieve-ment. Stud High Educ. 2008;33:685-98.
7. Hipkins R. Changing school subjects for changing times [Inter-net]. Wellington: New Zealand Council for Educational Research; 2004 [cited 2012 May 5]. Available from http://www.nzcer.org. nz/pdfs/12815.pdf.
8. Scott D. How does achievement at school afect achievement in tertiary education? Wellington: Ministry of Education; 2008. 9. Shulruf B, Keuskamp D. Course taking and student achievements
meta-analysis and a critical review of the literature. In: 12th Bi-ennial Conference for Research on Learning and Instruction; 2007 Aug 28 - Sep 1; Budapest, Hungary.
10. Shulruf B, Turner R, Hattie J. A dual admission model for equity in higher education: a multi-cohort longitudinal study. Procedia Soc Behav Sci. 2009;1:2416-20.
11. Campbell AR, Dickson CJ. Predicting student success: a 10-year review using integrative review and meta-analysis. J Prof Nurs. 1996;12:47-59.
12. Goldberg EL, Alliger GM. Assessing the validity of the GRE for students in psychology: a validity generalization approach. Educ Psychol Meas. 1992;52:1019-27.
13. Morrison T, Morrison M. A meta-analytic assessment of the pre-dictive validity of the quantitative and verbal components of the graduate record examination with graduate grade point average representing the criterion of graduate success. Educ Psychol Meas. 1995;55:309-16.
14. Kuncel NR, Ones DS, Hezlett SA. A comprehensive meta-analy-sis of the predictive validity of the graduate record examinations: implications for graduate student selection and performance. Psy-chol Bull. 2001;127:162-81.
15. McDonald A, Newton P, Whetton C, Beneield P. Aptitude test-ing for university entrance: a literature review. Berkshire, UK: National Foundation for Educational Research; 2001.
16. Allen DD, Bond CA. Prepharmacy predictors of success in phar-macy school: grade point averages, pharphar-macy college admissions test, communication abilities, and critical thinking skills. Phar-macotherapy. 2001;21:842-9.
17. Newton SE, Smith LH, Moore G, Magnan M. Predicting early academic achievement in a baccalaureate nursing program. J Prof Nurs. 2007;23:144-9.
18. Yates J, Smith J, James D, Ferguson E. Should applicants to Not-tingham University Medical School study a non-science A-level? A cohort study. BMC Med Educ. 2009;9:5.
19. McManus IC, Smithers E, Partridge P, Keeling A, Fleming PR. A levels and intelligence as predictors of medical careers in UK doc-tors: 20 year prospective study. BMJ. 2003;327:139-42.
20. McManus IC, Powis DA, Wakeford R, Ferguson E, James D, Ri-chards P. Intellectual aptitude tests and A levels for selecting UK school leaver entrants for medical school. BMJ. 2005;331:555-9. 21. McCall KL, MacLaughlin EJ, Fike DS, Ruiz B. Preadmission
pre-dictors of PharmD graduates’ performance on the NAPLEX. Am J Pharm Educ. 2007;71:5.
22. Chisholm MA, Cobb HH, Kotzan JA. Signiicant factors for pre-dicting academic success of irst-year pharmacy students. Am J Pharm Educ. 1995;59:364-70.
profession-al curriculum and the inluence of achieving a prior degree. Am J Pharm Educ. 2001;65:350-4.
24. Ferguson E, James D, Madeley L. Factors associated with success in medical school: systematic review of the literature. BMJ. 2002; 324:952-7.
25. Strachan J. Assessment in change: some relections on the local and international background to the National Certiicate of Edu-cational Achievement (NCEA). NZ Annu Rev Educ. 2001;11:245-74.
26. Shulruf B, Hattie J, Tumen S. he New Zealand’s standard based assessment for secondary schools (NCEA): implications for pol-icy makers. Asia Pac J Educ. 2010;30:141-65.
27. Cabrera AF. Logistic regression analysis in higher education: an applied perspective. In: Smart JC, editor. Higher education: hand-book of theory and research. vol. 10. New York: Agathon Press; 1994. p. 225-56.
28. Zarate N. Predictive factors of academic success for freshmen of
a multicultural university [dissertation]. Las Cruces: New Mexi-co State University; 1976.
29. Quinn DM. Coursework and the academic achievement of ur-ban high school students [dissertation]. Iowa: University of Iowa; 1994.
30. Hipkins R, Vaughan K. Well I know I need to English and maths.... [Internet]. Wellington: New Zealand Council for Educational Research; 2002 [cited 2012 May 5]. Available from http://www. nzcer.org.nz/pdfs/12762.pdf.
31. Shulruf B, Hattie J, Tumen S. Individual and school factors af-fecting students’ participation and success in higher education. High Educ. 2008;56:613-32.
32. Gross AL, Fleischman L. Restriction of range corrections when both distribution and selection assumptions are violated. Appl Psychol Meas. 1983;7:227-37.