The tide that lifts all focal boats: Asymmetric predictions of ascent and
descent in rankings
Shai Davidai
∗Thomas Gilovich
†Abstract
In six studies, we find evidence for an upward mobility bias, or a tendency to predict that a rise in ranking is more likely than a decline, even in domains where motivation or intention to rise play no role. Although people cannot willfully change their height (Study 1), and geographical entities cannot willfully alter their temperature (Study 2), number of natural disasters (Study 3), levels of precipitation (Studies 4A and 4B), or chemical concentration (Study 5), subjects believed that each is more likely to rise than drop in ranking. This bias is due to an association between a ranking’s order and the direction of absolute change, and to the tendency to give considerable weight to a focal agent over non-focal agents. Because people generally expect change to be represented in terms of higher ranks, and because they tend to focus on specific, focal targets, they believe that any given target will experience a larger relative increase than other targets. We discuss implications for social policy. Keywords: upward mobility bias, focalism, ranking, prediction.
1
Introduction
A popular oversimplification of Einstein’s theory of relativ-ity is that everything is relative. Although it doesn’t capture all that Einstein had in mind, the oversimplification works just fine as a description of human judgment and decision making. People rely on relative comparisons to make sense of the world, judging something to be big, strong, or fast only to the extent that it is bigger, stronger, or faster than something else (Festinger, 1954; Mussweiler, 2003; Kah-neman & Miller, 1986; Suls, Martin & Wheeler, 2002). They turn to published rankings for information on the safest cities in which to live, the most prestigious schools to send their children, the most gratifying occupations to pursue, the most attractive destinations for summer vacations, and the most retirement-friendly states to spend the golden years.
Most relative judgments are accurate. People have no trouble discerning that China is larger than Korea (Tversky, 1977), that rhinos are more dangerous than rabbits, or that Darwin’s account of the evolution of species has been more impactful than Derrida’s account of epistemology. Still, a large body of research has revealed some consistent biases in comparative judgments. First, because people often have more information about some targets than others, their rel-ative judgments are disproportionately influenced by what they know about the specific targets at hand. For example, because people have limited access to others’ thoughts and feelings, they tend to believe that they spend more time than
Copyright: © 2016. The authors license this article under the terms of the Creative Commons Attribution 3.0 License.
∗Princeton University, 524 Peretsman-Scully Hall, Princeton
Univer-sity, Princeton, NJ, USA, 08450. Email: shaidavidai@princeton.edu.
†Cornell University
their peers thinking of their loved ones, feeling rushed, or craving certain foods (Kruger, Windschitl, Burrus, Fessel & Chambers, 2008). And, because others’ knowledge is less accessible than one’s own, people tend to believe that they are likely to do better than others in easy trivia competi-tions, but worse than others in difficult competitions (Moore & Cain, 2007; Moore & Small, 2007).
Second, even when they have equal amounts of informa-tion about all targets, people tend to access fundamentally different types of information when making certain types of relative judgments—considering case-specific information when thinking about a focal target, but base-rate informa-tion when thinking about non-focal ones. For example, be-cause people consider specific reasons why they won’t get a divorce (e.g., I am a loyal partner) but base-rate information when thinking of a friend or a peer (e.g., one out of three marriages end in a divorce), they tend to believe that oth-ers are more likely to get divorced (Klar, Medding & Sarel, 1996).
Finally, even if people were to consider exactly the same information for all targets, the focal target’s attributes are likely to draw more attention and be processed more fluently than other targets’ attributes. For example, because people pay more attention to themselves than their peers, they tend to believe that they are above average in abilities they are good at (e.g., riding a bicycle, using a personal computer), but below average in abilities they are not good at (e.g., riding a unicycle, computer programming; Kruger, 1999), and more likely than their peers to experience common life events (e.g., traveling to Europe, being in a car accident), but less likely to experience uncommon events (e.g., travel-ing to the moon, betravel-ing in a boat accident; Kruger & Burrus,
2004). This bias is exhibited even when the focal target isn’t the self, leading people to judge every member of a positive group (e.g., attractive people, exquisite fragrances) as above the group’s average, and every member of a negative group (e.g., unattractive people, repugnant fragrances) as below average (Giladi & Klar, 2002; Krizan & Suls, 2008; Klar, 2002; Klar & Giladi, 1997).
1.1
The upward mobility bias
Complementing past work on biases in relative judgments, recent research has documented a pervasive asymmetry in judgments of ranked performance (Davidai & Gilovich, 2015a). When asked to predict a student’s future academic performance, a sports team’s standing, a business school’s ranking, or a sales agent’s success, subjects estimated that a rise in ranking is significantly more likely than a de-cline. This biased pattern of prediction—the upward mo-bility bias—has been shown to result, at least in part, from people’s tendency to assign considerable weight to a focal agent’s motivation, and to be relatively inattentive to the tal-ents or motivations of the agent’s competitors or to other obstacles standing in the way. Because people have a shaky understanding of quintiles, deciles, percentiles, and, more generally, relative assessments of all sorts (Shafir, Diamond & Tversky, 1997), they tend to overweight the impact of ab-solute motivation in predictions of relative performance.
One limitation of these findings, however, is that they fo-cused on judgments of relative performance in domains in which motivation is assumed to play an important role. In fact, Davidai and Gilovich (2015a) found that the upward mobility bias was exhibited only when the targets were as-sumed to be highly motivated to rise in ranking, not when their motivation was low. For example, subjects in one study read about a college course in which all students in the class were either highly motivated to succeed or not. Although students’ class rankings are (by definition) determined by relative, not absolute, performance, when the students in the course were thought to be all highly motivated, subjects es-timated that a target student was more likely to rise in the class ranking than to decline. In contrast, when the students in the course were thought to be poorly motivated to suc-ceed, subjects believed that the target student was equally likely to rise or drop in ranking.
But what about domains in which motivation plays no role? Would the upward mobility bias rear its head even there? Although rankings are common in domains where motivation and effort exert substantial influence, they are not limited to such domains. Rankings are compiled of the warmest places in the United States, the least pathogen-saturated countries in the world (Gangestad & Buss, 1993), and the rainiest cities on Earth. Obviously, warm places and rainy cities are not motivated to affect their rankings (al-though their residents might be), nor can they expend effort
to do so. It remains to be seen whether the upward mobil-ity bias—the belief that a rise in ranking is more likely than a decline—is also observed in rankings where effort, inten-tion, or motivation play no role.
There is reason to expect such a bias even in these circum-stances. When making relative judgments, people often sub-stitute simple assessments for the more difficult judgments that are actually required, in this case asking themselves “how is this focal target likely to change?” rather than “how is this target likely to change in comparison to other, non-focal targets?” (Davidai & Gilovich, 2015a; Kahneman & Frederick, 2002; Klar & Giladi, 1997; Kruger, 1999; Kruger & Burrus, 2004; Windschitl, Kruger & Simms, 2003). By itself, such a substitution does not imply that people would judge a rise in ranking to be more likely than a decline, since the focal target might be seen as likely to decline in terms of the attribute in question. However, people believe that some changes are more likely than others, and, to the extent that they expect absolute changes that are congruent with a rise in ranking (i.e., changes “in the direction of” or “towards” the top of the ranking), they should believe that a rise in ranking is more likely than a decline. In this paper, we ar-gue that people generally expect change in the direction of a given ranking (i.e., towards the top of the ranking), and that this expectation, coupled with the tendency to overweight a focal target in predictions, leads to the upward mobility bias. That is, because people generally expect things to change in the direction embodied by a given ranking, and because they tend to be more attentive to the focal target for which they are making a prediction, they tend to believe that focal tar-gets are more likely to rise than drop in ranking.
1.2
Expectations of absolute change
a trend in the domain in question and therefore expect abso-lute changes in the direction consistent with a rise in rank-ing.
Second, people might anchor on the most salient posi-tion in the ranking and insufficiently adjust from it (Epley & Gilovich, 2001, 2006; Tversky & Kahneman, 1974). Be-cause the most salient position in most rankings is the top (Davidai & Gilovich, 2015a), people may predict each tar-get’s future ranking by anchoring on the likelihood that it would reach first place and insufficiently adjust downward. Thus, regardless of whether a target is motivated to rise in ranking or not, anchoring on the top position is likely to give rise to an upward mobility bias.
Finally, even if people do not associate a ranking’s or-der with the direction of change and do not simply anchor on the top rank, their beliefs about absolute change—how things have changed in the past, are changing in the present, or are likely to change in the future—may nevertheless be influenced by the most salient target in the ranking. To illus-trate, imagine a policymaker studying the ranking of crime rates in all 50 state capitols in descending order, with the safest state capitol at the top—the most salient position in the ranking. Primed with an exemplar of safety, the policy-maker will likely seek out information consistent with safety (rather than harm, threat, or danger), and therefore come away believing that absolute levels of safety are, indeed, in-creasing (Gilovich, 1991; Lord, Ross & Lepper, 1979; Sny-der & Swann, 1978).
Now imagine that the policymaker is presented with the same ranking, but this time in inverted order, with the most dangerous city at the top. In this case, since the most salient exemplar is a crime-ridden city, the policymaker is more likely to think in terms of danger and wonder whether the top city’s crime rate is indicative of a more general trend. Here again, because the policymaker is likely to seek infor-mation that confirms the notion of harm and menace, she is likely to conclude that crime levels are increasing. Thus, despite getting the same information, the order of the rank-ing and the salience of the top position may guide the poli-cymaker down two different cognitive paths, leading to the belief that a ranking’s order implies a trend.
In six studies, we examine whether people are prone to an upward mobility bias even in domains where motivation can play no role in the ranking and we test our focalism-cum-expectation account of this bias. Subjects predicted the future ranking of a target previously ranked high or low in height (Study 1), temperature (Study 2), natural disasters (Study 3), precipitation (Studies 4A and 4B), and pollution (Study 5). In line with the upward mobility bias, we ex-pected subjects to estimate that a rise in ranking is more likely than a decline. Furthermore, we predicted that this effect would result from the combination of subjects’ ex-pectation of absolute changes in the direction of how the ranking is structured and their tendency to overweight a
fo-cal target in their predictions. For all studies we report all measures and conditions and, where applicable, data exclu-sions. Sample sizes were determined prior to running each study (set to 50 subjects per condition), and the results were analyzed only after data collection was completed.
2
Study 1: Height
As a first test of our hypothesis, we asked subjects to predict a target person’s future ranking in a domain in which mo-tivation plays no role: height. We examined whether peo-ple’s belief that height has been increasing from generation to generation, coupled with a tendency to overweight focal targets in predictions, would lead them to exhibit the upward mobility bias even when, try as they might, the targets can do nothing to influence how tall they are. Specifically, we asked subjects to predict the percentile standing of an in-dividual born to either relatively short (e.g., at the 25th per-centile) or relatively tall parents (e.g., at the 75th perper-centile). Based on subjects’ beliefs about the correlation between the heights of parents and children, their predictions could take one of several forms. If subjects believe that children’s and parents’ heights are imperfectly correlated, their predic-tions should regress toward the mean: they should expect taller parents to have relatively shorter children, and shorter parents to have relatively taller children. In contrast, if sub-jects believe that children’s height is perfectly correlated with their parents’ height, or if they fail consider the influ-ence of statistical regression (Tversky & Kahneman, 1974), their predictions should match the parents’ percentile: they should expect relatively tall parents to have children who are equally tall in percentile terms, and relatively short parents to have equally short children in percentile terms.
We predicted, however, that subjects’ predictions would neither match the parents’ percentile nor regress toward the mean, but would instead exhibit an upward mobility bias. Because people expect absolute change in the direction of a rise in ranking (i.e., generation-to-generation increases in height), and because they substitute absolute change for rel-ative change, we expected subjects to predict that a rise in height percentile is more likely than a decline. That is, we expected subjects to estimate a target person to have a higher percentile ranking than her unusually short parents, but a ranking similar to her parents if her parents were unusually tall.
2.1
Method
Subjects. One hundred three Mechanical Turk subjects (47 females,Mage= 35.98) completed the study in exchange
Materials and procedure. Subjects were asked to predict a person’s relative height based on her parents’ height per-centile. Specifically, subjects predicted the likelihood that the child of either relatively short or relatively tall parents would, as an adult, be relatively short or tall herself. In a between-subject design, we used two different measures to capture subjects’ beliefs. First, we asked subjects to predict the likelihood that a child of either relatively short or tall parents would be, as an adult, at different quartiles of the distribution of height (e.g., the bottom 25% of the popula-tion). Specifically, in the short parents condition, subjects estimated the likelihood (as a percentage) that a person born to relatively short parents (i.e., both at the 25th percentile in terms of height) would, as an adult, be somewhere in the 1st–25th percentiles, 26th–50th percentiles, 51st–74th per-centiles, or 75th–99th percentiles. In the tall parents con-dition, subjects estimated the likelihood that a person born to relatively tall parents (i.e., both at the 75th percentile) would, as an adult, be in each of the 4 quartiles. Subjects typed their estimates and were unable to proceed if the sum of their estimates did not equal 100%.1
Second, subjects were asked to estimate an individual’s precise height percentile. Subjects were presented with a sliding scale ranging from 0% to 100% in 5% increments, and were asked to move the slider to the percentile they ex-pected a child of relatively short or tall parents to reach.
2.2
Results
We first summed subjects’ estimates of the likelihood that a person’s percentile group would differ from that of her par-ents. In theshort parentscondition, we summed subjects’ estimates that a person born to parents in the 25th percentile would, as an adult, be in the 26th–50th, 51st–74th, or 75th– 99th percentile groups. In the tall parents condition, we summed subjects’ estimates that a person born to parents in the 75th percentile would, as an adult, be in the 1st–25th, 26th–50th, or 51st–74th percentile groups.
Consistent with our hypothesis, subjects’ estimates ex-hibited an upward mobility bias. Subjects estimated that a person born to relatively short parents is significantly more likely to be taller (in relative terms) than her parents (i.e., rise in percentile ranking; M = 52.14%,SD = 26.58) than a person born to relatively tall parents is to be shorter than them (i.e., drop in percentile ranking; M = 33.79%, SD= 19.53),t(101) = 3.99,p= .0001. Even though the target per-son’s height could not be influenced by any motivation to be taller, subjects believed that relatively short people are more
1Because people often provide probability estimates that are
non-additive (that exceed 100%; Tversky & Koehler, 1994; see also Riege & Teigen, 2013, 2015), in this and all following studies we forced subjects’ responses to sum 100%. Doing so emphasized the compensatory nature of changes in ranking (i.e., the tradeoff between rising and dropping in rank-ing) and therefore created a more stringent test of our hypothesis.
likely to have tall children than relatively tall people are to have short ones.
Next, we examined subjects’ estimates of the precise per-centile at which children of relatively tall or short parents would end up as adults. To examine the predicted change between one generation and the next, we subtracted the par-ents’ original height percentile from subjects’ predictions. That is, we subtracted 25 from subjects’ predictions in the
short parentscondition, and 75 from subjects’ predictions in thetall parentscondition. As before, we found evidence for an upward mobility bias: Whereas subjects in theshort parentscondition estimated that a person would end up at a significantly higher percentile than that of her parents (M
= 8.08,SD= 16.67),t(50) = 3.46,p= .001, subjects in the
tall parentscondition estimated there would be no differ-ence between the target’s percentile ranking and that of her parents (M = 0.21, SD= 8.59), t< .20,ns. The means of these two difference scores differed significantly from each other,t(101) = 3.02,p< .004.
Another way of looking at these data is to examine whether subjects predicted that the individual’s percentile ranking would be more or less extreme than that of her par-ents. Providing additional support for the upward mobil-ity bias, it appears that subjects believed that regression to the mean applies only to relatively short people: Whereas almost 61% of subjects in theshort parentscondition pre-dicted that a child would outdo her parents in her genera-tion’s height distribution, only 21% of subjects in the tall parents condition predicted that a child would lag behind her parents in her generation’s height distribution,χ2(103)
= 17.29,p< .0001. Subjects’ predictions “moved” signifi-cantly more toward the 50th percentile in theshort parents
condition (M = 8.08,SD = 16.67) than in thetall parents
condition (M= –0.21,SD= 8.59),t(101) = 3.18,p= .002. Whereas having relatively tall parents is seen as almost a guarantee of a child being relatively tall, being born to rel-atively short parents is not thought to condemn a child to a life of being short.
3
Study 2: Temperature
strin-gent test of the upward mobility bias in the absence of mo-tivation, one involving a domain that does not involve in-tentional agents at all. Indeed, because of people’s habit of anthropomorphizing non-human agents (Epley, Waytz & Cacioppo, 2007; Waytz, Cacioppo & Epley, 2010), we fo-cused in Study 2 on abstract, non-entitative targets unlikely to be ascribed any intention or motivation.
3.1
Method
Subjects. One hundred Mechanical Turk subjects (63 fe-males,Mage = 35.17) completed the study in exchange for
modest monetary compensation.
Materials and procedure. In the past fifty years, aver-age temperatures in the United States have been steadily rising. Based on information from the National Climatic Data Center, we presented subjects with the ranking of the Top 20 states in terms of average temperature, ranging from Florida (70.7◦Fahrenheit) to Maryland (54.2◦F). After
re-viewing the ranking, subjects predicted the likelihood that a state’s future standing would differ from its present rank. To simplify their task, subjects estimated the likelihood that 35 years from now, a given state would rank in the Top 5 warmest states, the Second 5, the Third 5, or the Fourth 5. For example, subjects who were asked about Florida (cur-rently ranked #1), estimated the likelihood that in 2050 it would remain in the Top 5 warmest states, or drop to each of the other quartiles of the Top 20. Subjects were randomly presented with two states: one from the Top 10, and one from the Second 10. They typed their percentage estimates and were unable to proceed if the sum of their estimates did not equal 100%.
We have argued that the upward mobility bias is due to a lay theory that things tend to change, in absolute terms, in the direction consistent with a rise in ranking. Nonethe-less, predicted rankings are also likely to be influenced by people’s specific beliefs about the domain in question (i.e., global warming). Whereas some domain-specific be-liefs may be compatible with people’s lay theory that things change in the direction of a rise in ranking, other domain-specific beliefs may contradict such a theory. Thus, although people generally expect ranked targets to change in a man-ner consistent with a rise in ranking, we predicted that skep-ticism about global warming would counter this expecta-tion and, therefore, reduce the upward mobility bias. That is, when it comes to predicting the ranking of the warmest states, deniers of global warming should be less likely to ex-hibit the bias than people who accept its reality. Therefore, we asked subjects to indicate their belief in global warm-ing: “In the next 50 years or so, do you believe that the world’s temperature will rise, drop, or remain unchanged?”
(trichotomous forced choice: the world’s temperature will rise in the next 50 years, the world’s temperature will drop
in the next 50 years, the world’s temperature will not change in the next 50 years).
3.2
Results
Predicted rankings. Each subject made two predictions—one for a state ranked in the Top 10 (places 1–10), and one for a state ranked in the Second 10 (places 11–20). We therefore computed two likelihood assessments for each subject—that the state from the Second 10 would rise to the Top 5 or Second 5 (rise in rankingmeasure), and that the state from the Top 10 would drop to the Third 5 or Fourth 5 (drop in rankingmeasure).
Overall, subjects exhibited an upward mobility bias in their predictions of temperature rankings: they estimated that a state currently ranked in the Second 10 is signifi-cantly more likely to rise to the Top 10 warmest states (M
= 29.35%,SD= 26.79) than a state ranked in the Top 10 is to drop to the Second 10 (M= 18.87%,SD=22.31), paired
t(99) = 3.14,p< .005. Furthermore, despite being equally distant from the middle rank, subjects believed that a state ranked in the Fourth 5 is significantly more likely to rise to the Top 10 (M= 46.77%,SD= 33.95) than a state in the Top 5 is to drop to the Second 10 (M = 23.88%,SD = 24.87), pairedt(25) = 3.41,p< .005, and that a state ranked in the Third 5 is more likely to rise in ranking (M= 34.58%,SD= 26.04) than a state ranked in the Second 5 is to drop (M = 22.29%,SD=22.01), pairedt(23) = 1.95,p= .06.2
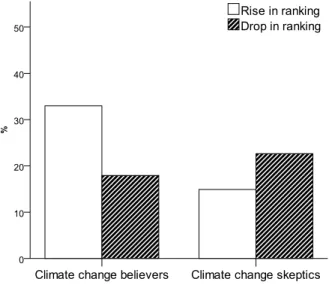
Moderation by belief in global warming. Twenty sub-jects were classified as climate change skeptics: fifteen who said the world’s temperature will not change in the next 50 years and five who said that temperatures will drop. As pre-dicted, climate change skeptics did not believe that a rise in ranking is more likely than a decline. Subjects who indi-cated that they believe in global warming predicted that a state ranked in the Second 10 is more likely to rise in rank-ing (M = 32.96%, SD= 26.89) than a state ranked in the Top 10 is to drop (M = 17.93%,SD= 21.01), pairedt(79) = 4.02,p= .0001. In contrast, subjects who did not believe in global warming predicted that a state from the Second 10 is only as likely to rise in ranking (M = 14.90%, SD= 21.45) as a state from the Top 10 is to drop (M = 22.65%,
SD= 27.19), pairedt(19) = 1.31,ns. The interaction was significant,F(1,98) = 7.99,p= .006 (see Figure 1). Thus, the belief that a rise in ranking is more likely than a decline was exhibited only among subjects whose domain-specific expectation (about global warming) was consistent with the belief that things change in the direction of how the entities in question are ranked.
2Because subjects were randomly presented with two different states—
Figure 1: Perceived likelihood of a rise/drop in ranking, bro-ken down by subjects who expect temperatures to increase in the future (climate change believers) versus those who do not expect temperatures to increase (climate change skep-tics) (Study 2).
4
Study 3: Natural disasters
Study 2 provided further support for the upward mobil-ity bias in predictions of relative performance, even when the predictions pertain to non-agentic entities lacking inten-tion, voliinten-tion, or motivation. Subjects thought that relatively warm states are less likely to drop in temperature rankings than relatively cool states are to rise. This bias was appar-ent despite the fact that each state can do very little—or nothing—to control its temperature. Furthermore, we found that this bias was due, at least in part, to subjects’ general ex-pectations about the direction of future change. When their general notion that change occurs in the direction of how a ranking is structured was countered by domain-specific be-liefs about global warming, they predicted that a given U.S. state is equally likely to rise or drop in the ranking of hottest states. In contrast, when their domain-specific knowledge was consistent with an overarching belief about the direction of change, they exhibited the upward mobility bias, predict-ing that a state is more likely to rise in rankpredict-ing than to drop. Study 3 further examined this account by asking subjects to predict states’ ranking in terms of the frequency of natural disasters. To further probe our account of this bias, we asked subjects to report what images came more easily to mind— the occurrence of more or fewer disasters. We predicted that the upward mobility bias would be exhibited only to the ex-tent that subjects’ domain-specific beliefs (tapped by their ease of imagining an increase or decrease in natural disas-ters) are consistent with the general expectation that things change in the direction implied by a ranking. In contrast, when their domain-specific beliefs are inconsistent with this
meta-theory, we predicted that the bias would not be exhib-ited (or would be exhibexhib-ited to a smaller extent). Therefore, we expected the upward mobility bias to be exhibited only when subjects found it easy to imagine an increase (but not a decrease) in natural disasters.
4.1
Method
Subjects. One hundred two Mechanical Turk subjects (40 females,Mage= 30.04) completed the study in exchange for
modest monetary compensation.
Materials and procedure. Based on information from the National Climatic Data Center, the National Hurricane Cen-ter, and the U.S. Geographical Survey Earthquake data, we presented subjects with the ranking of the Top 10 states in terms of major natural disaster declarations since 1953, ranging from Texas (86 major disasters declared) to Mis-souri (53 disasters declared). In a between-subject design, subjects were asked to predict a specific state’s ranking 35 years in the future, in 2050. To simplify their task, subjects assessed the likelihood that a given state would rank in the Top 5 states in terms of natural disasters (places 1–5), or in the Second 5 (places 6–10). In therise in rankingcondition, subjects estimated the likelihood that Louisiana, currently ranked #6, would either rise to the Top 5 or remain in the Second 5. In thedrop in rankingcondition, they estimated the likelihood that Florida, currently ranked #5, would ei-ther remain in the Top 5 or drop to the Second 5. Subjects made their two estimates on sliding scales, and were unable to proceed if the sum of their estimates did not equal 100%. Next, subjects were asked two questions about the changes they expected with respect to natural disasters: “When thinking about [the state’s] future ranking, what were you imagining? That is, what images came to mind?” (7-point Likert scale: 1-“More natural disasters occurring in [the state]”, 7-“Fewer natural disasters occurring in [the state]”), and “When thinking about [the state’s] future rank-ing, which were you more focused on?” (trichotomous forced choice: “Reasons for it to rise in ranking”, “Reasons for it to drop in ranking”, or “Reasons for it to remain at the same rank”).
4.2
Results
they thought that a state ranked #6 is equally likely to rise in ranking as it is to remain in the Second 5,t(50) < 1,ns.
We next examined subjects’ domain-specific thoughts about the occurrence of natural disasters in the target state. First, subjects were significantly more inclined to think about future increases rather than future decreases in natu-ral disasters,M= 3.26, one-samplet(102) = 4.45,p< .0001. Second, whereas 64% of the subjects thought mostly of rea-sons why the target state would rise in ranking, only 36% thought mostly about reasons it would either drop in rank-ing (8%) or remain at the same position (28%),χ2(1) = 79,
p= .005.
Finally, as shown in Figure 2, subjects exhibited the up-ward mobility bias only to the extent that their domain-specific expectations about natural disasters were consis-tent with their general belief that changes occur in the di-rection implied by a ranking’s structure. Subjects who did not expect future increases in natural disasters (i.e., whose domain-specific expectations were at odds with the general belief about changes in ranks) predicted that a state in the Second 5 is as likely to rise in rank (M = 37.54%, SD = 18.39) as a state in the Top 5 is to drop (M= 36.15%,SD= 21.17),t(35) < 1. In contrast, subjects who expected more natural disasters in the future (i.e., whose domain-specific expectations were consistent with their general belief that things change in the direction of a rise in ranking) predicted that a rise in ranking (M= 66.63%,SD= 19.37) is signifi-cantly more likely than a decline (M= 17.29%,SD= 13.32),
t(63) = 12.18,p< .0001. The interaction between condition (risevs.drop in ranking) and subjects’ domain-specific ex-pectations (consistentvs.inconsistentwith the structure of the ranking) was significant,F(1,101) = 41.61,p< .0001.3
5
Studies 4A and 4B: Domain-specific
expectations about rainfall
Providing additional evidence of the upward mobility bias, subjects in Study 3 estimated that a state is more likely to rise than to drop in the ranking of states with the most natu-ral disasters. Moreover, this bias was only observed among subjects whose domain-specific expectations were consis-tent with the general belief that a ranking’s order signi-fies the direction of future change. In contrast, when their domain-specific expectations ran counter to that general be-lief, there was no such bias.
3An analysis with subjects’ responses on the continuous measure
yielded somewhat similar results. A more pronounced upward mobility bias was observed among subjects who expected more natural disasters, t(53) = 5.28,p< .0001, than among those who did not expect more disas-ters,t(45) = 3.04,p= .004. However, the interaction between direction of prediction (rise vs. drop in ranking) and subjects’ domain-specific expecta-tions on the continuous measure was not significant,F(1,101) = 1.30,p= .29.
Figure 2: Perceived likelihood of a rise/drop in ranking, bro-ken down by subjects who thought mostly about reasons the target state might rise in ranking (i.e., consistent expecta-tions) versus those who thought mostly about reasons the target state might drop in ranking or about reasons it might remain in the same position (i.e.,inconsistent expectations) (Study 3).
6
Study 4A
6.1
Method
Subjects. One hundred sixty nine Mechanical Turk sub-jects (107 females, Mage = 35.10) completed the study in
exchange for modest monetary compensation.4
Materials and procedure. Subjects were presented with the ranking of the 10 driest states in the U.S., ranging from Nevada to South Dakota, and were asked to predict a spe-cific state’s ranking 35 years in the future, in 2050. Us-ing a 2x2 between-subjects design, we first manipulated whether subjects’ domain-specific expectations of precipita-tion trends were consistent or inconsistent with the general belief that things tend to change “towards” the top of a rank-ing. All subjects read that “there is some consensus among the scientific community that the world is getting warmer”, but “there is much less of a consensus regarding of what this means for rainfall and snowfall”. In the expectation-consistent condition, subjects read that there is some evi-dence “that the world is getting drier”, and that the warmer the world gets, the less rainfall is expected. Because subjects were presented with a ranking of driest states, this informa-tion was consistent with an expectainforma-tion of a rise in ranking. In contrast, in the expectation-inconsistentcondition, sub-jects read that there is some evidence “that the world is get-ting wetter”, and that the warmer the world gets, the more rainfall is expected. Here the information was inconsistent with an expected rise in ranking.
Next, subjects judged the likelihood that a given state would rank in the Top 5 (ranks 1–5), or in the Second 5 (ranks 6–10) driest states. In therise in rankingcondition, subjects predicted the likelihood that Montana (currently ranked #6) would either rise to the Top 5 driest states or remain in the Second 5. In contrast, in thedrop in ranking
condition, subjects predicted the likelihood that New Mex-ico (currently ranked #5) would either remain in the Top 5 or drop to the Second 5. Subjects made their predictions on a sliding scale, ranging from 0% to 100%.
6.2
Results
We predicted that subjects would exhibit the upward mobil-ity bias only when their domain-specific expectations about
4Nineteen subjects who failed a comprehension-check (whether the text
they read implied an increase or decrease in future rainfall) were excluded from the analyses, leaving a final sample of 150 subjects. Perhaps because it was inconsistent with their lay theory about how things change with re-spect to the structure of the ranking, subjects in theexpectation-inconsistent condition were more likely to fail the comprehension-check than those in theexpectation-consistentcondition,χ2(1) = 11.42,p< .001. Not surpris-ingly, the critical 2 (domain-specific expectation: increased vs. decreased precipitation) x 2 (direction of prediction: rise vs. drop in ranking) interac-tion was not significant when subjects who failed the comprehension-check were included in the analysis,F(1, 168) < 1,ns.
future rainfall levels were consistent with the general be-lief that things change in a direction implied by the rank-ing’s structure. Indeed, whereas subjects in the expectation-consistentcondition predicted that a rise in ranking is more likely than a decline, subjects in theexpectation-inconsistent
condition predicted that a rise and a decline were equally likely. Despite being equally distant from the midrange, subjects in the expectation-consistent condition (i.e., who expected a drier climate in the future) predicted that a state ranked #6 is more likely to rise in the ranking of driest states (M= 44.37%,SD= 23.55) than a state ranked #5 is to drop (M= 24.60%,SD= 18.04),t(146) = 3.84,p< .001. In con-trast, in theexpectation-inconsistentcondition, there was no difference between subjects’ estimates of a rise or drop in ranking: They predicted that a low-ranked state is as likely to rise in ranking (M = 38.97%, SD = 27.34) as a high-ranked state is to drop (M = 32.20%, SD= 24.85), t(146) = 1.18,ns. The interaction between target of prediction (5th or 6th ranked) and expectation (drier or wetter) was almost significant,F(1,149) = 2.85,p= .09 (two-tailed, but a one-tailed test of the prediction would be significant).
7
Study 4B
In Study 4A, subjects exhibited the upward mobility bias only when their domain-specific expectation was consistent with the belief that absolute change moves in the direction of how the ranking is structured. In Study 4B, in addition to manipulating subjects’ expectations about the domain in question, we manipulated how the ranking was structured (and hence what the top of the ranking signifies). Whereas some subjects predicted the future ranking of a state listed among the 10 Driest States, others predicted the future rank-ing of a state listed among the 10WettestStates.
We predicted that, regardless of a ranking’s structure, sub-jects would exhibit the upward mobility bias as long as their domain-specific expectation was consistent with their gen-eral belief about changes in ranking. When it comes to es-timates of the future ranking of the Top 10 Driest states, we predicted that subjects would exhibit the upward mobility bias only if they expect a general decrease in rainfall; when it comes to the Top 10 Wettest states, we predicted that sub-jects would exhibit the bias only if they expect a general
increasein rainfall.
7.1
Method
Subjects. Three hundred ninety two Mechanical Turk subjects (226 females,Mage = 33.73) completed the study
in exchange for modest monetary compensation.5
5Thirty five subjects who failed a comprehension-check question were
Materials and procedure. Subjects were presented with the ranking of either the 10 driest or the 10 wettest states in the U.S. and were asked to predict a specific state’s ranking 35 years in the future, in 2050. We manipulated subjects’ domain-specific expectations about precipitation. In the
increased-precipitation conditions, subjects read that “sci-entists have shown that the increasing frequency of floods around the world and in the United States is evidence that the world is getting wetter”, and that “experts are warning that there will be more rain in the future”. In the decreased-precipitationconditions, subjects read that “scientists have shown that the increasing frequency of droughts [. . . ] is ev-idence that the world is getting drier”, and that “experts are warning that there will be less rain in the future”.
Next, subjects estimated the likelihood that a given state would rank in the Top 5 (places 1–5) or Second 5 (places 6–10) driest or wettest states. In the tworise in ranking con-ditions, subjects estimated the likelihood that Montana (6th driest state) or Tennessee (6th wettest state) would either rise to the Top 5 driest/wettest states or remain in the Second 5. In thedrop in rankingconditions, subjects estimated the likelihood that New Mexico (5th driest state) or Florida (5th wettest state) would either remain in the Top 5 driest/wettest states or drop to the Second 5. Subjects made their predic-tions on a sliding scale, ranging from 0% to 100%.
7.2
Results
We analyzed subjects’ estimates of the target state’s likely movement in a 2 (direction of ranking: 10 wettest vs. 10 driest states) x 2 (domain-specific expectation: increased vs. decreased precipitation) x 2 (direction of prediction: rise vs. drop in ranking) between-subjects ANOVA. As pre-dicted, this analysis yielded a significant 3-way interaction,
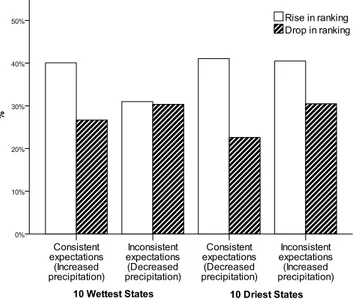
F(1,356) = 5.82,p = .016 (see Figure 3). To examine the nature of this interaction in more detail, we separately ana-lyzed subjects’ predictions for the 10 wettest states and the 10 driest states.
As predicted, in the 10 Wettest States conditions, the upward mobility bias was exhibited only when subjects’ domain-specific expectations about precipitation were con-sistent with a general expectation that things change in the direction implied by the ranking’s structure. In the
increased-precipitation condition (where domain-specific expectations were consistent with a rise in ranking), subjects predicted that a state ranked #6 would be more likely to rise in ranking (M= 40.08%,SD= 22.87) than a state ranked #5
how things change with respect to the ranking, subjects in the expectation-inconsistentconditions were more likely to fail the comprehension-check than those in theexpectation-consistentconditions,χ2(1) = 9.27,p= .002. However, including these subjects in the analysis only slightly reduced the significance of the 2 (direction of ranking: 10 wettest vs. 10 driest states) x 2 (domain-specific expectation: increased vs. decreased precipitation) x 2 (direction of prediction: rise vs. drop in ranking) between-subjects ANOVA,F(1,391) = 5.11,p= .024.
Figure 3: Perceived likelihood of a rise/drop in ranking when subjects’ domain-specific expectations were consis-tent or inconsisconsis-tent with a rise in ranking (Study 4B).
would be to drop (M= 26.69%,SD= 20.29),t(185) = 3.31,p
= .001. In contrast, in thedecreased-precipitationcondition (where domain-specific expectations were inconsistent with a rise in ranking), subjects predicted that a low-ranked state is only as likely to rise in ranking (M= 30.98%,SD= 18.84) as a high-ranked state is to drop (M= 30.35%,SD= 20.14),
t(185) < 1,ns. The interaction between subjects’ expecta-tions (expectation consistent vs. inconsistent) and target of prediction (5th or 6th ranked state) was significant,F(1,185) = 4.35,p= .039.
An analysis of subjects’ predictions in the 10 Driest
States conditions revealed a similar, but less pronounced pattern of results. In thedecreased-precipitationcondition (where domain-specific expectations were consistent with a rise in ranking), subjects predicted that a low-ranked state is significantly more likely to rise in ranking (M= 41.07%,SD
= 22.69) than a high-ranked state is to drop (M = 22.59%,
These results show that, replicating Study 4A, people are more likely to exhibit an upward mobility bias when their domain-specific expectations are consistent with a lay the-ory about the direction of change implied by the ranking. The upward mobility bias was most pronounced when sub-jects expected more rainfall in the future and predicted a state’s standing among the wettest states, or when they ex-pected less rainfalland predicted a state’s standing among the driest states. The bias was less pronounced (or non-existent) when subjects expected more rainfallbutpredicted future rankings among the driest states or when they ex-pected less rainfallbutpredicted future rankings among the wettest states. So long as their domain-specific expectations were not at odds with the assumption that changes tend to occur in the direction implied by a ranking’s structure, sub-jects in Studies 4A and 4B estimated that a rise in ranking is more likely than a decline.
8
Study 5: Industrial pollution
Regardless of whether they were thinking about the wettest or driest states in the U.S., subjects in Study 4B thought that a state is more likely to rise than drop in ranking. However, because we manipulated the ranking’s direction by present-ing subjects with two different lists (i.e., the 10 wettest states or the 10 driest states), Study 4B necessarily confounded the ranking’s direction with the information subjects were given (i.e., the specific states listed in the ranking). In Study 5, we address this (we believe minor) concern by presenting subjects with the exact same list of states, and manipulating whether the list was said to correspond to the 10 most pol-luted states or the 10 least polpol-luted states. Thus, by having all subjects estimate the future ranking of the same states, we were able to manipulate the ranking’s direction inde-pendent of the particular entities that were ranked. As in Study 4B, we predicted that, regardless of the ranking’s or-der (most or least polluted), subjects would exhibit the up-ward mobility bias, believing that a rise in ranking is more likely than a decline.
8.1
Method
Subjects. Two hundred nineteen Mechanical Turk sub-jects (116 females, Mage = 31.85) completed the study in
exchange for modest monetary compensation.
Materials and procedure. Subjects were asked to imag-ine the following scenario:
Imagine you were an environmental consultant who is the highest authority on a specific chem-ical compound — Chemchem-ical XXZ. Your research has shown that Chemical XXZ may be dangerous when in high concentration, and should therefore
be monitored. You have traveled to all 50 states to examine the concentration of this chemical.
Next, we manipulated the direction of the ranking. Whereas some subjects were told that their work culminated in a ranking of “The Top 10 States with highest concen-tration of Chemical XXZ” (most-polluted-statescondition), others were told that their work culminated with a ranking of “The Top 10 States with lowest concentration of Chemical XXZ” (cleanest-statescondition). Regardless of condition, subjects were presented with a ranking of the exact same 10 states and were asked to imagine that they had been hired by the governor of New York to predict the future concen-tration of Chemical XXZ. Subjects were told that this was “a difficult task, because it is hard to accurately predict how changes in industry, population, and weather would influ-ence this chemical”. Despite these difficulties, they were asked to do their best to predict “where the state of New York would rank 35 years from now, in 2050”.
Subjects were randomly assigned to one of two condi-tions. In therise in rankingcondition, New York was said to rank 6th among the top 10 states, and subjects were asked to estimate the likelihood that it would either rise to the Top 5 states with the highest/lowest concentration of Chemical XXZ or remain in the Second 5. In thedrop in ranking con-dition, New York was said to rank 5th, and subjects were asked to estimate the likelihood that it would either remain in the Top 5 states or drop to the Second 5. Subjects made their predictions on two sliding scales, and were unable to proceed if the sum of their estimates did not equal 100%.
8.2
Results
We compared subjects’ predictions of the likelihood that New York would rise in ranking (when it was ranked #6) with the likelihood that it would drop in ranking (when it was ranked #5). As can be seen in Figure 4, regardless of the order of the ranking (most polluted/least polluted), sub-jects estimated that a state (New York) ranked #6 is more likely to rise in ranking than a state ranked #5 is to drop: they believed that it was more likely to rise (M = 59.00%,
SD =19.27) than drop (M = 33.07%, SD = 21.36) in the ranking of “states with thehighestconcentration of Chemi-cal XXZ”,t(218) = 6.55,p< .0001, and more likely to rise (M = 49.38%,SD= 19.62) than drop (M = 40.48%,SD= 22.29) in the ranking of “states with thelowest concentra-tion of Chemical XXZ” , t(218) = 2.26, p= .025.6 Thus,
even though subjects were presented with the same list of 10 states, and regardless of whether the rankings were of
6Although subjects exhibited the upward mobility bias in both
Figure 4: Perceived likelihood of a rise/drop in the ranking of the cleanest/most-polluted states (Study 5).
the cleanest or the most polluted states, subjects exhibited the upward mobility bias. Put differently, subjects believed that a state is more likely to become both relatively more pollutedandrelatively less polluted.
9
General discussion
Six studies provided consistent evidence of an upward mo-bility bias even when the entities could do little or noth-ing to influence their rank. Although people cannot will-fully change their height (Study 1), and states cannot (or are severely limited in their ability to) alter their temperature (Study 2), number of natural disasters (Study 3), levels of precipitation (Studies 4A and 4B), or chemical concentra-tion (Study 5), subjects thought that each of these entities is significantly more likely to rise in their respective rankings than to drop. Replicating past findings (Davidai & Gilovich, 2015a), we find that this bias was not the product of op-timism or wishful thinking. Subjects believed that states were more likely to rise in the ranking of natural disasters (Study 3) and the concentration of a potentially dangerous chemical (Study 5)—rises that are surely undesirable. In-stead, the upward mobility bias appears to be due to expec-tations about the direction of absolute change. As long as subjects’ domain-specific expectations were consistent with a meta-belief that change occurs in the direction implied by a ranking, they estimated that each focal target is more likely to experience a relative increase in ranking than a decline (Studies 2–5).
We suggest a new framework for understanding the up-ward mobility bias in the absence of intention, motivation, or effort. Based on prior work on focalism (Klar & Giladi,
1997; Kruger, 1999; Kruger & Burrus, 2004; Moore, 2005; Moore & Kim, 2003; Radzevick & Moore, 2008; Winds-chitl et al., 2003), we have argued that the tendency to over-weight a focal target in judgment leads to the belief that a rise in ranking is more likely than a decline. However, it is important to note that focalism by itself cannot account for the upward mobility bias. A narrow focus on the target of judgment could, by itself, lead equally to a conviction that the target is likely to rise or drop in ranking. Focalism can account for the upward mobility bias only when it is coupled with a belief that things change “towards” a rise in ranking. Because, as we have argued, people generally expect change to be reflected in higher, not lower, ranks, and because they tend to focus on specific, focal targets, they tend to believe that any given target is likely to experience a larger relative increase than other targets.
Why do people infer the direction of change from a rank-ing’s order? Although the order of any ranking can be arbi-trarily determined (e.g., size can be ranked from biggest to smallest or smallest to biggest), experience teaches people to assume—however implicitly or explicitly—that the cho-sen order reflects the likely direction of future change. In addition, because perceptions of change are influenced by the most salient target in a ranking, and because the most salient target is the one ranked at the top position, people come to believe that things change in the direction implied by the ranking’s structure. When the top target is the largest, strongest, or fastest in ranking, people are likely to seek out information consistent with absolute increases in size, strength, or speed. In contrast, when the top ranked target is the smallest, weakest, or slowest, people are likely to seek and find information consistent with absolute decreases in size, strength, or speed. Just as decision frames influence judgments, preferences, decisions, and choice (Tversky & Kahneman, 1981), a ranking’s order often “frames” people’s expectations of future change.
9.1
Implications and future research
We have so far discussed instances in which people sub-stitute absolute change for relative change, leading to the upward mobility bias. However, it is worth considering whether a complementary bias sometimes occurs, with peo-ple substituting relative change for absolute change. Peopeo-ple often treat a rise or drop in ranking as informative of a more general, absolute change in quality: They attribute a ten-nis player’s rise in ranking to her own improvement (rather than to other players’ injuries), a company’s drop from the S&P 500 to its own profitability (rather than other compa-nies’ profitability), or a drop in freedom-of-the-press rank-ing to a focal country’s policy (rather than the other coun-tries’ policies; see Diamond, 2015). Thus, it is worth ex-amining instances in which relative rankings are substituted for absolute assessments and vice versa. The existence of such symmetric substitutions would constitute evidence that attribute substitution can work both ways, with thetarget at-tributeandheuristic attributeswitching roles (Kahneman & Fredrick, 2002).
Are people aware that their estimated future rankings are biased? We don’t believe so. For one thing, despite the fact that people are quick to notice bias in others, they are noto-riously slow to detect it in themselves (Pronin, Gilovich & Ross, 2004). To the extent that the upward mobility bias (like many other cognitive biases) results from processes that operate outside awareness (e.g., from a narrow focus on the target and an implicit lay theory of change), it is unlikely that people would be aware that they anticipate more move-ment upward than downward in rank. Also, to the extent that having to make multiple predictions can cue subjects to the fact that relative change is distinct from absolute change, one might expect the bias to be exhibited only in between-subject designs. However, mirroring past findings (Davidai & Gilovich, 2015a), in Study 2 we found that the upward mobility bias was exhibited even in a within-subject design, where predictions were made for both high- and low-ranked states.
By showing that it is not restricted to domains involv-ing motivated, intentional agents, these findinvolv-ings comple-ment previous work on the upward mobility bias. Further-more, the present work helps explain Davidai and Gilovich’s (2015a) finding that a focus on a target’s motivation leads to an erroneous belief that a rise in ranking is more likely than a decline. Motivation is naturally expected to improve an individual’s absolute performance. Given that performance is generally ranked in ascending order (e.g., graduating in the top of one’s class is commonly understood as having maintained the highest, not lowest, grades), a focus on
mo-tivation is therefore consistent with the general belief that things change “towards” the top of the ranking. Thus, fo-cusing on a person’s motivation may lead people to expect an increase in absolute performance and, due to attribute substitution (Kahneman & Frederick, 2002), an increase in relative performance as well. In contrast, when a person is not motivated to succeed, there is little reason to expect improvement in absolute terms and, as a result, not in rel-ative terms either. Because a focus on motivation creates a domain-specific expectation of absolute improvement, the upward mobility bias is likely to be especially reliable and pronounced when it comes to predictions about the future ranking of highly-motivated agents (Davidai & Gilovich, 2015a).
The present work also sheds light on the finding that people overestimate the likelihood of upward social mobil-ity in the U.S., and underestimate the likelihood of down-ward social mobility (Davidai & Gilovich, 2015b; Kraus, 2015; Kraus & Tan, 2015). To the extent that people have a domain-specific belief that absolute levels of wealth and income are slowly rising (and will continue to do so in the future), they may erroneously conclude that relative upward social mobility is more likely than it really is. Moreover, to the extent that everyone is motivated to increase their in-come, people may expect each individual’s relative income to increase as well. Thus, although it may be perfectly rea-sonable to expect a rise in absolute income levels, the belief that things change in a manner that is consistent with a rise in ranking, coupled with the tendency to overweight a focal target in one’s predictions, may lead to unwarranted confi-dence in the likelihood and extent of upward social mobility.
References
Campbell, T. H., & Kay, A. C. (2014). Solution aversion: On the relation between ideology and motivated disbelief.
Journal of Personality and Social Psychology, 107(5), 809–824.
Davidai, S., & Gilovich, T. (2015a). What goes up appar-ently needn’t come down: Asymmetric predictions of as-cent and desas-cent in rankings. Journal of Behavioral De-cision Making,28(5), 491–503.
Davidai, S. & Gilovich, T. (2015b). Building a more mobile America – one income quintile at a time.Perspectives on Psychological Science,10(1), 60–71.
Davidai, S., Gilovich, T., & Ross, L. D. (2012). The mean-ing of default options for potential organ donors. Pro-ceedings of the National Academy of Sciences,109(38), 15201–15205.
Diamond, J. (2015). U.S. slips again in press freedom ranking with blame on Obama administration. CNN. Retrieved May 27th, 2015, from http://www.cnn.com/ 2015/02/13/politics/u-s-press-freedom-ranking-obama-administration-leaks/.
Epley, N., & Gilovich, T. (2001). Putting adjustment back in the anchoring and adjustment heuristic: Differential pro-cessing of self-generated and experimenter-provided an-chors.Psychological Science,12(5), 391–396.
Epley, N., & Gilovich, T. (2006). The anchoring-and-adjustment heuristic: Why the anchoring-and-adjustments are insuffi-cient.Psychological Science,17(4), 311–318.
Epley, N., Waytz, A., & Cacioppo, J. T. (2007). On see-ing human: A three-factor theory of anthropomorphism.
Psychological Review,114(4), 864–886.
Feinberg, M., & Willer, R. (2010). Apocalypse soon? Dire messages reduce belief in global warming by contradict-ing just-world beliefs.Psychological Science,22(1), 34– 48.
Festinger, L. (1954). A theory of social comparison pro-cesses.Human Relations,7, 117–140.
Gangestad, S. W., Buss, D. M., (1993). Pathogen prevalence and human mate preferences.Ethology and Sociobiology, 14(2), 89–96.
Giladi, E. E., & Klar, Y. (2002). When standards are wide of the mark: Nonselective superiority and inferiority biases in comparative judgments of objects and concepts. Jour-nal of Experimental Psychology: General,131(4), 538– 551.
Gilovich, T. (1991). How we know what isn’t so: The falli-bility of human reason in everyday life. New York, NY: Free Press
Gilovich, T., & Ross, L. (2015).The wisest one in the room: How you can benefit from social psychology’s most pow-erful insights. New York: Simon & Schuster
Grice, H.P. (1975). Logic and conversation. In P. Cole and J.L. Morgan (Eds.),Syntax and semantics, Vol. 3: Speech
acts (pp. 225–242). New York: Seminar Press.
Hoffman, R. R., & Kemper, S. (1987). What could reaction-time studies be telling us about metaphor comprehension?
Metaphor and Symbol,2(3), 149–186.
Kahneman, D., & Frederick, S. (2002). Representativeness revisited: Attribute substitution in intuitive judgment. In T. Gilovich, D. Griffin & D. Kahneman (Eds.).Heuristics and biases: The psychology of intuitive judgment, 49–81. Cambridge: Cambridge University Press.
Kahneman, D., & Miller, D. T. (1986). Norm theory: Com-paring reality to its alternatives. Psychological Review,
93(2), 136–153.
Klar, Y. (2002). Way beyond compare: Nonselective superi-ority and inferisuperi-ority biases in judging randomly assigned group members relative to their peers.Journal of Experi-mental Social Psychology,38(4), 331–351.
Klar, Y., & Giladi, E. E. (1997). No one in my group can be below the group’s average: A robust positivity bias in favor of anonymous peers. Journal of Personality and Social Psychology,73(5), 885–901.
Klar, Y., Medding, A., & Sarel, D. (1996). Nonunique invul-nerability: Singular versus distributional probabilities and unrealistic optimism in comparative risk judgments. Or-ganizational Behavior and Human Decision Processes,
67(2), 229–245.
Kraus, M.W. (2015). Americans still overestimate social class mobility: A pre-registered self-replication. Fron-tiers in Psychology,6, 1–5.
Kraus, M.W., & Tan, J.J.X. (2015). Americans overestimate social class mobility,Journal of Experimental Social Psy-chology,58, 101–111.
Krizan, Z., & Suls, J. (2008). Losing sight of oneself in the above-average effect: When egocentrism, focalism, and group diffuseness collide.Journal of Experimental Social Psychology,44(4), 929–942.
Kruger, J. (1999). Lake Wobegon be gone! The “below-average effect” and the egocentric nature of comparative ability judgments.Journal of Personality and Social Psy-chology,77, 221–232.
Kruger, J. & Burrus, J. (2004). Egocentrism and focalism in unrealistic optimism (and pessimism). Journal of Exper-imental Social Psychology,40, 332–340.
Kruger, J., Windschitl, P. D., Burrus, J., Fessel, F., & Cham-bers, J. R. (2008). The rational side of egocentrism in social comparisons.Journal of Experimental Social Psy-chology,44(2), 220–232.
Li, Y., Johnson, E. J., & Zaval, L. (2011). Local warm-ing daily temperature change influences belief in global warming.Psychological Science,22(4), 454–459. Lord, C., Ross, L., & Lepper, M. (1979). Biased
Moore, D. A. (2005). Myopic biases in strategic social pre-diction: Why deadlines put everyone under more pressure than everyone else. Personality and Social Psychology Bulletin,31(5), 668–679.
Moore, D. A., & Cain, D. M. (2007). Overconfidence and underconfidence: When and why people underestimate (and overestimate) the competition. Organizational Be-havior and Human Decision Processes,103(2), 197–213. Moore, D. A., & Kim, T. G. (2003). Myopic social predic-tion and the solo comparison effect.Journal of Personal-ity and Social Psychology,85(6), 1121–1135.
Moore, D. A., & Small, D. A. (2007). Error and bias in comparative judgment: On being both better and worse than we think we are. Journal of Personality and Social Psychology,92(6), 972–989.
Mussweiler, T. (2003). Comparison processes in social judgment: Mechanisms and consequences. Psychologi-cal Review,110(3), 472–489.
Pronin, E., Gilovich, T., & Ross, L. (2004). Objectivity in the eye of the beholder: Divergent perceptions of bias in self versus others. Psychological Review,111(3), 781– 799.
Radzevick, J. R., & Moore, D. A. (2008). Myopic biases in competitions. Organizational Behavior and Human De-cision Processes,107(2), 206–218.
Riege, A. H., & Teigen, K. H. (2015). Everybody Will Win, and All Must Be Hired: Comparing Additivity Neglect with the Nonselective Superiority Bias. Journal of Be-havioral Decision Making.
Riege, A. H., & Teigen, K. H. (2013). Additivity neglect in probability estimates: Effects of numeracy and response format. Organizational Behavior and Human Decision Processes,121(1), 41–52.
Risen, J. L., & Critcher, C. R. (2011). Visceral fit: While in a visceral state, associated states of the world seem more likely. Journal of Personality and Social Psychol-ogy,100(5), 777–793.
Roberts, R. M., & Kreuz, R. J. (1994). Why do people use figurative language? Psychological Science, 5(3), 159– 163.
Shafir, E., Diamond, P.A, & Tversky, A. (1997). Money illusion. Quarterly Journal of Economics,110(1), 341– 374.
Slovic, P. (2007). "If I look at the mass I will never act": Psychic numbing and genocide. Judgment and Decision Making,2(2), 79–95.
Snyder, M., & Swann, W. B. (1978). Hypothesis-testing processes in social interaction.Journal of Personality and Social Psychology,36(11), 1202–1212.
Suls, J., Martin, R., & Wheeler, L. (2002). Social compar-ison: Why, with whom, and with what effect? Current Directions in Psychological Science,11(5), 159–163. Tversky, A. (1977). Features of similarity. Psychological
Review,84(4), 327–352.
Tversky, A., & Kahneman, D. (1974). Judgment under un-certainty: Heuristics and biases. Science, 185, 1124– 1131.
Tversky, A., & Kahneman, D. (1981). The framing of deci-sions and the psychology of choice. Science,211(4481), 453–458.
Tversky, A., & Koehler, D. J. (1994). Support theory: A nonextensional representation of subjective probability.
Psychological Review,101(4), 547–567.
Waytz, A., Cacioppo, J., & Epley, N. (2010). Who sees human? The stability and importance of individual dif-ferences in anthropomorphism. Perspectives on Psycho-logical Science,5(3), 219–232.