Expression in Human Alveolar Macrophages
Joel W. Graff1,2, Linda S. Powers1, Anne M. Dickson1¤, Jongkwang Kim1, Anna C. Reisetter1, Ihab H. Hassan1, Karol Kremens1, Thomas J. Gross1, Mary E. Wilson1,2,3., Martha M. Monick1
*.
1Department of Medicine, University of Iowa, Iowa City, Iowa, United States of America,2Iowa City Veteran Affairs Medical Center, Iowa City, Iowa, United States of America,3Department of Microbiology, University of Iowa, Iowa City, Iowa, United States of America
Abstract
Human alveolar macrophages are critical components of the innate immune system. Cigarette smoking-induced changes in alveolar macrophage gene expression are linked to reduced resistance to pulmonary infections and to the development of emphysema/COPD. We hypothesized that microRNAs (miRNAs) could control, in part, the unique messenger RNA (mRNA) expression profiles found in alveolar macrophages of cigarette smokers. Activation of macrophages with different stimuli
in vitroleads to a diverse range of M1 (inflammatory) and M2 (anti-inflammatory) polarized phenotypes that are thought to
mimic activated macrophages in distinct tissue environments. Microarray mRNA data indicated that smoking promoted an ‘‘inverse’’ M1 mRNA expression program, defined by decreased expression of M1-induced transcripts and increased expression of M1-repressed transcripts with few changes in M2-regulated transcripts. RT-PCR arrays identified altered expression of many miRNAs in alveolar macrophages of smokers and a decrease in global miRNA abundance. Stratification of human subjects suggested that the magnitude of the global decrease in miRNA abundance was associated with smoking history. We found that many of the miRNAs with reduced expression in alveolar macrophages of smokers were predicted to target mRNAs upregulated in alveolar macrophages of smokers. For example, miR-452 is predicted to target the transcript encoding MMP12, an important effector of smoking-related diseases. Experimental antagonism of miR-452 in differentiated monocytic cells resulted in increased expression of MMP12. The comprehensive mRNA and miRNA expression profiles described here provide insight into gene expression regulation that may underlie the adverse effects cigarette smoking has on alveolar macrophages.
Citation:Graff JW, Powers LS, Dickson AM, Kim J, Reisetter AC, et al. (2012) Cigarette Smoking Decreases Global MicroRNA Expression in Human Alveolar Macrophages. PLoS ONE 7(8): e44066. doi:10.1371/journal.pone.0044066
Editor:Jianping Ye, Pennington Biomedical Research Center, United States of America
ReceivedFebruary 22, 2012;AcceptedJuly 30, 2012;PublishedAugust 29, 2012
Copyright:ß2012 Graff et al. This is an open-access article distributed under the terms of the Creative Commons Attribution License, which permits unrestricted use, distribution, and reproduction in any medium, provided the original author and source are credited.
Funding:This study was supported by NIH R01 HL079901 and NIH R21HL109589 to M.M., NIH R21 AI080801, NIH R01 AI045540 and a Merit Review Award from the Department of Veteran’s Affairs to M.W., and CDA-1 award from the Department of Veterans’ Affairs to J.G. This publication was also made possible by funding from the National Institute for Environmental Health Sciences through the University of Iowa Environmental Health Sciences Research Center, NIEHS/NIH P30 ES005605 and Grant Number UL1RR024979 from the National Center for Research Resources (NCRR), Clinical and Translational Science Awards (CTSA). The funders had no role in study design, data collection and analysis, decision to publish, or preparation of the manuscript.
Competing Interests:The authors have read the journal’s policy and have the following conflicts. Author A.D. is now employed at Life Technologies. This does not alter the authors’ adherence to all the PLOS ONE policies on sharing data and materials.
* E-mail: martha-monick@uiowa.edu
.These authors contributed equally to this work.
¤ Current address: Life Technologies, Eugene, Oregon, United States of America
Introduction
Cigarette smoking is a prominent risk factor for many respiratory diseases including emphysema/COPD, respiratory bronchiolitis, interstitial lung disease, and desquamative interstitial pneumonitis [1,2,3]. In fact, a correlation exists between alveolar macrophage numbers and the severity of COPD [4,5,6,7]. Aberrant gene expression in alveolar macrophages has been shown to alter the protease/anti-protease balance in the lung contributing to the development of emphysema [7,8,9,10]. Of particular importance in maintaining the optimal protease/anti-protease balance is expression of matrix metalloproteinase 12 (MMP12), a macrophage secreted enzyme that degrades elastin. The importance of alveolar macrophage-derived MMP12 in emphysema is well described [8,11].
Alveolar macrophages are essential immune effector cells in the lung with functions that include pathogen clearance and responses
to inhaled environmental exposures [8,12,13,14,15,16]. Smoking causes alveolar macrophage defects in phagocytosis, responses to pathogen-associated molecular patterns, and microbicidal activity [17,18,19,20,21]. These defects compromise alveolar macro-phage-mediated protection from infectious agents [22].
Macrophage gene expression programs are altered in response to local environmental cues. These changes may underlie the regulatory role macrophages play in many disease processes [23]. The use of polarizing stimuli to activate macrophages in vitro
activities including wound healing, immunosuppression, or pro-duction of cytokines promoting type 2 immune responses.
Transcriptional profiles of human alveolar macrophages directly isolated from nonsmokers and active smokers have shown that cigarette smoke exposure alters macrophage gene expression [1,2,25]. The pattern in alveolar macrophages from smokers has been suggested to reflect both suppression of M1-induced transcripts and increased expression of M2-induced transcripts [2]. The data shown here, partially replicates this finding, while proposing a new definition of the altered phenotype in smoker alveolar macrophages.
MicroRNAs (miRNAs) are small, noncoding RNAs that have an important regulatory role in gene expression programs [26,27,28]. Inhibition of translation and degradation of the miRNA-targeted transcripts occurs when a miRNA guides an RNA-induced silencing complex to the targeted transcript via miRNA:mRNA base pairing [29]. Each miRNA has the potential to repress the expression of hundreds of genes [30]. Expression profiling has identified miRNAs that have increased abundance in macrophages responding to inflammatory conditions [31,32,33,34,35,36]. Despite an incomplete understanding of all transcripts targeted by the inflammation-induced miRNAs, several are known to regulate components of important signaling pathways involved in macrophage gene expression [31,37,38,39,40].
An initial study on the effect of smoking on human miRNA expression was reported by Schembri et al [41]. They identified 28 differentially expressed miRNAs when comparing primary human bronchial airway epithelium of smokers and nonsmokers. The effect of smoking on miRNA expression in human alveolar macrophages is unknown. We hypothesized that miRNAs have a role in regulating the unique gene expression program in alveolar macrophages of cigarette smokers. We examined miRNA and mRNA expression in alveolar macrophage RNA from active smokers and nonsmokers. Microarray-derived mRNA expression profiles suggested that smoking is associated with an inverse M1-type gene expression pattern in alveolar macrophages. Expression analysis of miRNAs showed a smoking dose-dependent global repression of miRNAs in alveolar macrophages. Target prediction analyses revealed many examples of downregulated miRNAs in smokers that correlated with increased expression of predicted mRNA targets.In vitroexperiments showed a direct link between
low expression of miR-452 and increased expression of MMP12 mRNA. These results are consistent with the hypothesis that miRNAs play a role in regulating gene expression in alveolar macrophages of smokers, and possibly a corresponding role in disease pathogenesis.
Materials and Methods
Ethics Statement
All procedures and protocols described in this communication were approved by the University of Iowa Institutional Review Board. Written informed consent was obtained and all clinical investigation has been conducted according to the principles expressed in the Declaration of Helsinki.
Alveolar Macrophage Donors
Subjects were recruited from the community by the Iowa Institute for Clinical and Translational Science (ICTS) Clinical Core via advertisements and word-of-mouth. Inclusion criteria for case subjects required at least a 10 pack-year history of smoking, while the nonsmoker control subjects were self-reported never smokers. Subjects were excluded if they had any significant
co-morbid conditions such as pregnancy or other acute or chronic disease such as pre-existing asthma, interstitial lung disease or cardiovascular disease. Subjects were also excluded if a baseline spirometry revealed the forced expiratory volume in the first second was less than 60% of the predicted value based on National Health and Nutrition Examination Survey III data set.
Cohort 1. The first cohort of alveolar macrophage donors
consisted of 4 nonsmokers and 4 active smokers with 31614 pack-year histories. All subjects were Caucasian. The nonsmoker group had 3 males and 1 female with a mean group age of 2669 years. The smoker group had 2 males and 2 females with a mean group age of 5168 years.
Cohort 2. The second cohort included 4 nonsmokers and 4
smokers with 3163 pack-year histories. All subjects were Caucasian except for 1 African American in the smoker group. The nonsmoker group had 2 females and 2 males with a mean group age of 3166 years. The smoker group had 2 males and 2 females with a mean age of 476years.
Cohort 3. The third cohort included 4 nonsmokers, 4 light
smokers (1262 pack-year histories), and 4 heavy smokers (3366 pack-year histories). All subjects were Caucasian except for 1 African American in each of the smoker groups. Each of the three groups had 2 male and 2 female donors. The mean age for the groups was 35612 years for the nonsmokers, 3667 years for the light smokers, and 5167 years for the heavy smokers.
Bronchoalveolar Lavage
After informed consent was obtained, subjects underwent standard flexible bronchoscopy [42]. Local anesthesia with lidocaine instillation into the upper airway was followed by bronchoalveolar lavage whereby 20 ml of normal saline was instilled into a tertiary bronchus up to five times in three different lung segments. The first collection out of five was discarded to avoid possible contamination with upper airway secretions or lidocaine. The remaining lavage was filtered through sterile gauze and centrifuged at 2006g for 5 minutes to pellet cellular material.
The resulting pellet was suspended in phosphate buffered saline (PBS) and centrifuged at 2006g for 5 minutes. A sample of the
cells were labeled with Wright stain and microscopically examined to determine the proportion of the cells that were macrophages [43,44,45,46]. Aliquots of 56106cells were stored at280uC until RNA isolation procedure was performed. Cell yields from bronchoscopy in cohort 1 averaged 25636106 cells for the nonsmokers and 67646106 cells for the active smokers. In all three cohorts the procedure generated a relatively pure population of alveolar macrophages with fewer than 5% neutrophils or lymphocytes in the bronchoalveolar lavage fluid.
RNA Isolation
RNA was isolated from alveolar macrophages or PMA-differentiated THP-1 cells using the mirVana miRNA Isolation kit (Applied Biosystems (ABI)). The quantity and quality of the RNA samples was assessed using an Experion Automated Electrophoresis Station (Bio-Rad). The RNA quality indicator was above 8 for all samples where values of greater than 8 indicate primarily intact RNA on a scale of 1–10. After preparation, RNA samples were stored at280uC until use.
mRNA Expression Analysis
using the Partek Genomics Suite version 6.5 (Partek). The data were assessed for quality and subjected to robust multiarray averaging (RMA) normalization. The normalized data were then analyzed using an ANOVA model with linear contrasts to calculate p-values and smoker-to-nonsmoker expression ratios. The false discovery rate (FDR) step-up method [47] was applied to correct for multiple testing. The expression data has been deposited in NCBI Geo repository (GSE34517).
miRNA Expression Analysis
RNA from alveolar macrophages of nonsmokers and active smokers was reverse transcribed with MultiScribe Reverse Transcriptase (ABI) using Megaplex Primers version 2.0 (ABI). Changes in miRNA expression was then determined using human TaqMan Low Density Arrays version 2.0 (ABI). Ct values calculated using SDS version 2.4 (ABI) were exported to the Partek Genomics Suite to calculate smoker-to-nonsmoker expres-sion ratios. RMA-normalized data were subjected to an ANOVA model with linear contrasts to calculate p-values.
Principle component analysis (PCA) was performed using standard functions built in MATLAB software version 7.9 (MathWorks). This analysis identified a representative miRNA
within each cluster with the highest Pearson correlation between its expression profile and the first principal component from our PCA analysis [48]. Cluster analysis was performed using DCt values of the miRNAs with expression changes of .2-fold was accomplished using the CiMminer web interface and the default Euclidean clustering algorithm (http://discover.nci.nih.gov/ cimminer/).
Validation of Changes in Individual miRNAs
Validation studies were performed using alveolar macrophage RNA collected from the initial array group (cohort 1) and a non-redundant sample set (cohort 2). Individual TaqMan MicroRNA Assays corresponding to assays including in the TLDA version 2.0 assays (ABI) were used to document abundance of the mature forms of three of the downregulated miRNAs. Briefly, 10 ng RNA was reversed transcribed with MultiScribe RT (ABI) using a miRNA-specific stem loop primer. Then, PCR with TaqMan Universal PCR Master Mix (ABI) was performed using miRNA-specific real time primers. Expression levels were defined as a ratio between the Ct values of the indicated miRNA and the endogenous control, RNU48.
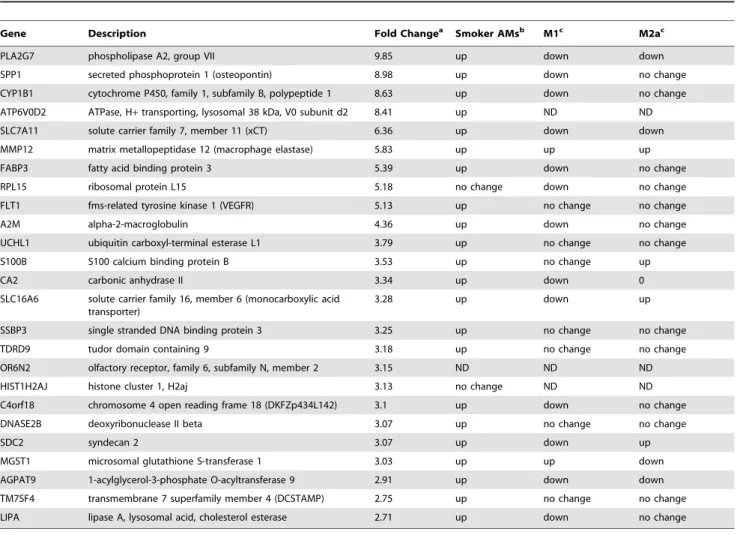
Table 1.25 most upregulated mRNAs in alveolar macrophages of smokers.
Gene Description Fold Changea Smoker AMsb M1c M2ac
PLA2G7 phospholipase A2, group VII 9.85 up down down
SPP1 secreted phosphoprotein 1 (osteopontin) 8.98 up down no change CYP1B1 cytochrome P450, family 1, subfamily B, polypeptide 1 8.63 up down no change
ATP6V0D2 ATPase, H+transporting, lysosomal 38 kDa, V0 subunit d2 8.41 up ND ND
SLC7A11 solute carrier family 7, member 11 (xCT) 6.36 up down down MMP12 matrix metallopeptidase 12 (macrophage elastase) 5.83 up up up
FABP3 fatty acid binding protein 3 5.39 up down no change
RPL15 ribosomal protein L15 5.18 no change down no change
FLT1 fms-related tyrosine kinase 1 (VEGFR) 5.13 up no change no change
A2M alpha-2-macroglobulin 4.36 up down no change
UCHL1 ubiquitin carboxyl-terminal esterase L1 3.79 up no change no change
S100B S100 calcium binding protein B 3.53 up no change up
CA2 carbonic anhydrase II 3.34 up down 0
SLC16A6 solute carrier family 16, member 6 (monocarboxylic acid transporter)
3.28 up down up
SSBP3 single stranded DNA binding protein 3 3.25 up no change no change
TDRD9 tudor domain containing 9 3.18 up no change no change
OR6N2 olfactory receptor, family 6, subfamily N, member 2 3.15 ND ND ND
HIST1H2AJ histone cluster 1, H2aj 3.13 no change ND ND
C4orf18 chromosome 4 open reading frame 18 (DKFZp434L142) 3.1 up down no change
DNASE2B deoxyribonuclease II beta 3.07 up no change no change
SDC2 syndecan 2 3.07 up down up
MGST1 microsomal glutathione S-transferase 1 3.03 up up down
AGPAT9 1-acylglycerol-3-phosphate O-acyltransferase 9 2.91 up down down TM7SF4 transmembrane 7 superfamily member 4 (DCSTAMP) 2.75 up no change no change
LIPA lipase A, lysosomal acid, cholesterol esterase 2.71 up down no change
aChange indicates smoker-to-nonsmoker expression ratio in alveolar macrophages from this study.
bExpression change of indicated mRNA described by Woodruff et al [25] in analysis of alveolar macrophage smokers and nonsmokers (GEO dataset 1269). cExpression change of indicated mRNA described by Martinez et al [55] in analysis of monocyte-derived macrophages (MDMs) polarized toward M1 or M2a phenotypes relative to unstimulated MDMs (GEO datasets 2429 and 2430).
Analysis of miRNA Target Prediction Expression
Using the Partek Genomics Suite software, each indicated miRNA was used to query the TargetScan [49] and MicroCosm [50] databases to identify predicted targets. The smoker-to-nonsmoker expression ratio and ANOVA-derived p-value of each predicted miRNA target were exported from the GeneChip Human Exon microarray results to an Excel spreadsheet (Microsoft). Excel was used to filter data by expression ratios and p-values.
Expression of Predicted Targets in miRNA Antagonist-transfected THP-1 Cells
THP-1 cells were maintained in RPMI 1640 (Gibco) supple-mented with fetal bovine serum (10%; Gibco). Cells were incubated with PMA (5 ng/ml; Sigma-Aldrich) for 18 hours to induce differentiation toward a macrophage phenotype [51]. They were then transfected with the miR-452 or negative control mirVana miRNA Inhibitors (25 nM; ABI) using RNAiMAX (Invitrogen). RNA was purified from cell lysates collected at 24
hours post-transfection. Total RNA (300 ng) was reverse-tran-scribed to cDNA using iScript cDNA Synthesis kit (Bio-Rad). SYBR Green-based quantitative PCR reactions (BioRad) were performed as previously described [52]. Specificity of the amplification was confirmed using melting curve analysis. Expres-sion levels were defined as a ratio between the threshold cycle (Ct) values of MMP12 or TM7SF4 and the endogenous control, HPRT. The primers (Integrated DNA Technologies) used in the PCR reactions were: MMP12, forward 59 -aggtggaatcctagcc-catgcttt-39, reverse 59-tcaggatttggcaagcgttggttc-39; TM7SF4, for-ward 59-tgggagtttgctgtttggttgctc-39, reverse 59 -atcaaagcattcctgcctt-cacgc-39; HPRT, forward 59-ccatcacattgtagccctctgtgt-39, reverse 59-actgcctgaccaaggaaagcaaag-39.
Results
Alveolar Macrophages from Smokers Displayed an ‘‘Inverse’’ M1 Gene Expression Profile
Cigarette smoking has been shown to alter the transcriptional profile of human alveolar macrophages in a consistent manner as
Table 2.25 most downregulated mRNAs in alveolar macrophages of smokers.
Gene Description Fold Changea Smoker AMsb M1c M2ac
CXCL11 chemokine (C-X-C motif) ligand 11 213.14 down up no change
CXCL9 chemokine (C-X-C motif) ligand 9 26.59 down up no change
SLC19A3 solute carrier family 19 (thiamine transporter) 25.93 down no change no change
EMR1 egf-like module containing, mucin-like, hormone receptor-like 1 (F4/80)
25 down up no change
CXCL10 chemokine (C-X-C motif) ligand 10 24.97 down up no change
PDGFD platelet derived growth factor D 24.65 down no change no change
IGF1 insulin-like growth factor 1 24.47 down down no change
GBP5 guanylate binding protein 5 24.03 down up no change
OVCH1 ovochymase 1 23.86 ND ND ND
C8B complement component 8, beta 23.78 down no change no change
CD69 CD69 molecule 23.61 down no change no change
WDR49 WD repeat domain 49 23.32 down ND ND
TNFSF10 tumor necrosis factor (ligand) superfamily, member 10 (TRAIL)
23.27 down up no change
IFI27 interferon, alpha-inducible protein 27 (ISG12) 23.17 down up up
TRHDE thyrotropin-releasing hormone degrading enzyme 22.99 down no change no change
MYB v-myb myeloblastosis viral oncogene homolog 22.97 down no change no change
GZMA granzyme A 22.82 no change up no change
CLDN6 claudin 6 22.67 no change no change no change
ARHGAP24 Rho GTPase activating protein 24 22.64 down no change no change RXFP2 relaxin/insulin-like family peptide receptor 2 22.63 no change ND ND
TRPC6 transient receptor potential cation channel, subfamily C, member 6
22.59 down no change no change
KLRK1 killer cell lectin-like receptor subfamily K, member 1 22.55 no change no change no change
MS4A6A membrane-spanning 4-domains, subfamily A, member 6A
22.54 no change down no change
GBP3 guanylate binding protein 3 22.52 no change up no change
ITIH5 inter-alpha (globulin) inhibitor H5 22.52 down no change no change
aChange indicates smoker-to-nonsmoker expression ratio in alveolar macrophages from this study.
bExpression change of indicated mRNA described by Woodruff et al [25] in analysis of alveolar macrophage smokers and nonsmokers (GEO dataset 1269). cExpression change of indicated mRNA described by Martinez et al [55] in analysis of monocyte-derived macrophages (MDMs) polarized toward M1 or M2a phenotypes relative to unstimulated MDMs (GEO datasets 2429 and 2430).
reported by two independent groups [1,2,25]. Prior to measuring miRNA expression in alveolar macrophages from four normal healthy subjects and four cigarette smokers (cohort 1), microarrays were performed to compare the transcriptional profile of these donors to previous reports.
Tables 1 and 2 display the most upregulated and downregulated mRNAs, respectively, with p-values ,0.05 in alveolar macro-phages from smokers compared to nonsmokers. These regulated genes were compared to an independent mRNA expression profiling study in alveolar macrophages from 15 smokers and 15 nonsmokers by Woodruff et al., summarized in the 4thcolumn of Tables 1 and 2 ([25] and GEO dataset GDS1269). Results from our study were in strong agreement with this previous study. Most of the highly regulated mRNAs were similarly regulated in both studies and none of these mRNAs were regulated in the opposite direction (compare 3rdand 4thcolumns within Tables 1 and 2).
To further evaluate the extent to which the gene expression profile in alveolar macrophages from smokers contrasts with an M1 profile, the highly regulated mRNAs listed in Tables 1 and 2 were compared to results reported by Martinez et al [53] that described the transcriptional profile of unstimulated, M1-polarized (IFNc- and LPS-treated), and M2a-polarized (IL-4 treated) macrophages (GEO datasets GDS2429 and GDS2430). The alveolar macrophages from smokers have an ‘‘inverse’’ M1 gene expression profile because not only were mRNAs that are upregulated in M1 macrophages downregulated in alveolar macrophages from smokers, similar to the observations of Shaykhiev et al [2], but also mRNAs downregulated by M1 polarization were often upregulated in smoker alveolar macro-phages (compare 3rd and 5th columns within Tables 1 and 2). Unlike the M1-regulated mRNAs, there was not any discernible correlation between mRNAs regulated in alveolar macrophages in response to cigarette smoking and mRNAs regulated in macro-phages in response toin vitroM2a-polarizing conditions.
A global mRNA abundance increase was reported in lung tissue from a rat model of cigarette smoking [54]. Among the mRNAs
with p-values,0.05, more transcripts were upregulated in smoker alveolar macrophages relative to nonsmoker alveolar macrophages when using a 2-fold change cut-off. Specifically, 70 mRNAs were upregulated and 48 mRNAs were downregulated. However, when assessing all mRNAs detected by the microarrays, there were approximately equal numbers of mRNAs with smoker-to-non-smoker expression ratios greater than 1 (51.2%) and less than 1 (48.8%) in the alveolar macrophage samples (Figure 1A) and the expression ratios of mRNAs commonly used as endogenous controls were each close to 1 (Figure 1B). While there were significant differences in expression of specific mRNAs, there was no apparent global shift in global mRNA levels in human alveolar macrophages of smokers and nonsmokers.
Total miRNA Abundance is Reduced in Smoker Alveolar Macrophages
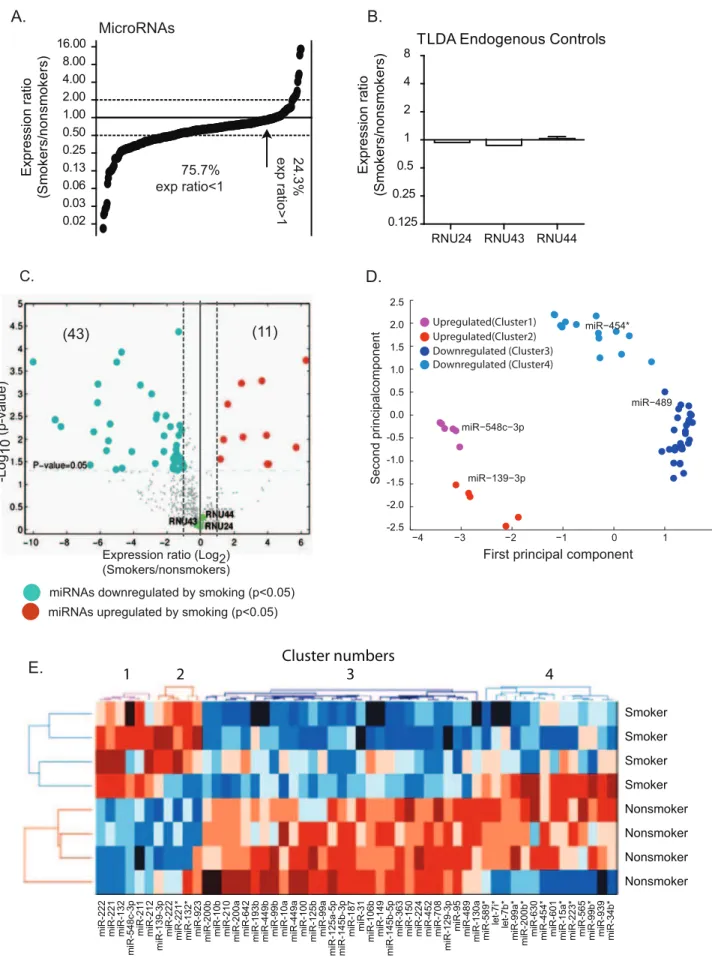
To address our hypothesis that miRNAs have a role in maintaining the unique smoking-associated gene expression profile, we next obtained miRNA expression profiles. TaqMan Low Density Array (TLDA) assays were used to measure miRNA expression in the same RNA samples from alveolar macrophages of smokers and nonsmokers that had been used to analyze mRNA expression (cohort 1). TLDA assays use quantitative RT-PCR to specifically measure the abundance of 667 mature human miRNAs. The total miRNA abundance appeared to be lower in alveolar macrophages from cigarette smokers compared to nonsmokers, with a median expression ratio of 0.63. Therefore, the majority (75.7%) of miRNA smoker-to-nonsmoker expression ratios was less than 1 (Fig 2A). Interestingly, the general repression of miRNA expression in alveolar macrophages of cigarette smokers coincides with reports that cigarette smoke reduces overall miRNA expression in primary human epithelial cells [41] and in lung tissues of rats [54].
The expression of miRNAs was determined using a small nucleolar RNA, RNU48, as an endogenous control. Three other small nucleolar RNAs (RNU24, RNU43, and RNU44) were Figure 1. Expression profiling indicates similar numbers of mRNAs are upregulated and downreglated in alveolar macrophages of cigarette smokers and nonsmokers.Smoker-to-nonsmoker mRNA expression ratios were determined using RNA from alveolar macrophages as template in GeneChip Human Exon 1.0 ST cDNA microarrays (Affymetrix). The RNA was collected from alveolar macrophages directly isolated from four nonsmokers and four smokers (cohort 1).A)Smoker-to-nonsmoker expression ratios are represented by black circles in order from lowest to highest for the 17,860 detected cDNAs. The arrow indicates the point where specific mRNA expression ratios in smokers and nonsmokers = 1.B)The expression ratios are shown for several commonly used endogenous controls. (ACTB = actin, beta; B2M = beta-2-microglobulin; GAPDHS = glycer-aldehyde-3-phosphate dehydrogenase, spermatogenic; PGK1 = phosphoglycerate kinase 1; peptidylprolyl isomerase A; RPLP0 = ribosomal protein, large, P0; TBP = TATA box-binding protein).
included in the TLDA assays as alternative endogenous controls. The expression of all three of the additional controls was unchanged when calculated using RNU48 as an endogenous control (Fig 2B). The general repression of global miRNAs described in figure 2A is unlikely to be caused by an artifactual skewing of the data due to unreliable endogenous controls since all four endogenous controls available on the TLDA assays were in agreement with each other.
The overall repression of miRNA expression in alveolar macrophages of smokers compared to nonsmokers was also observed when comparing the number of miRNAs with statisti-cally significant (p,0.05) abundance differences. For example, when using a 2-fold cut-off, 11 miRNAs have increased abundance and 43 miRNAs have decreased abundance (Fig 2C). General information for the upregulated and downregulated miRNAs is shown in Table 3 and Table 4, respectively. We list 10 miRNAs in Table 3, rather than the 11 in the data set because miR-923 is no longer considered a miRNA by miRBase. Principal component analysis (PCA) groups these 54 miRNAs into four clusters (Clusters 1–4) with the upregulated miRNAs and the downregulated miRNAs each separated into two clusters (Fig 3D). The PCA analysis identified a representative miRNA (miR-548c-3p, miR-139-(miR-548c-3p, miR-489, and miR-454*) for each of the four clusters. Although the significance is unclear, we note that clusters 2 and 4 are dominated by passenger strands while clusters 1 and 3 are dominated by guide miRNA strands (Fig 3E). miRNA passenger strands are the strand of each miRNA-duplex that is less likely to be loaded into the RNA-induced silencing complex (RISC) [52,53].
Individual RT-PCR miRNA assays were used to confirm the observations from the TLDA assays. Three differentially expressed miRNAs (miR-146b-3p, miR-150, and miR-210) were validated using the same RNA samples from cohort 1 analyzed in the TLDA assays (Fig 3A). Furthermore, these miRNAs were similarly
regulated in a second, non-redundant set of alveolar macrophage samples (cohort 2) from nonsmokers and smokers (Fig 3B).
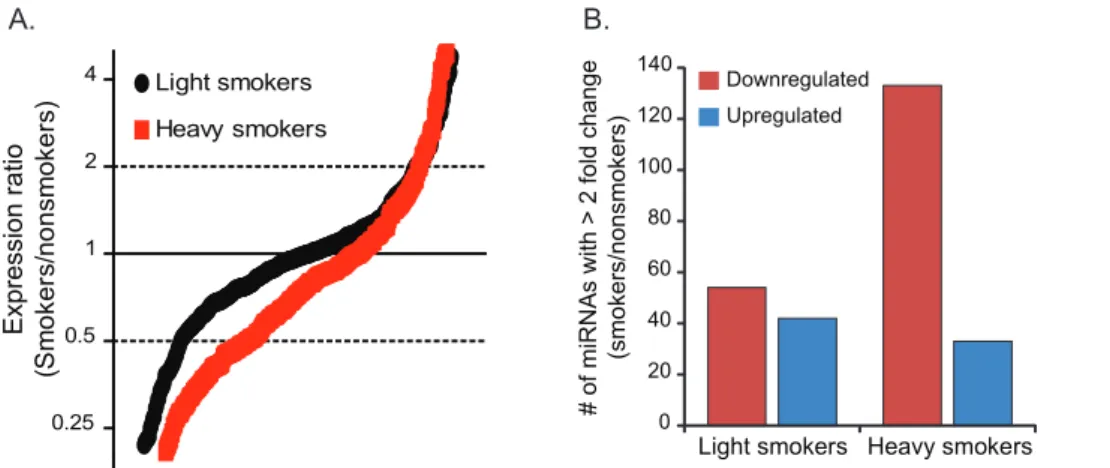
Decreased Global miRNA Expression is Associated with Heavy Smoking Histories
TLDA assays were used to evaluate miRNA expression profiles in a third set of alveolar macrophages (cohort 3). Four donors each were categorized as nonsmokers (no smoking history), light smokers, and heavy smokers. Light smoking resulted in a modest reduction in miRNA expression compared to nonsmokers with 54.2% of miRNAs have an expression ratio less than 1 relative to nonsmokers. The decrease in global miRNA expression was more pronounced in heavy smokers with expression ratios of less than 1 for 72.6% of the miRNAs (Figure 4A). The general downregu-lation of miRNAs in alveolar macrophages of smokers was also apparent by assessing the number of miRNAs using a 2-fold expression change cut-off (Figure 4B). These results from cohort 3 confirmed that smoking represses global miRNA expression and suggests that the amplitude of overall repression is directly related to the extent of an individuals’ smoking history.
Inverse Correlations between Regulated miRNAs and the Expression of their Predicted mRNA Targets
Most mRNAs targeted for repression by miRNAs are degraded [28]. Therefore, using the results from cohort 1, the miRNAs with regulated expression were analyzed further to determine whether the expression of these miRNAs inversely correlated with the mRNA expression of their predicted targets. Using Partek Genomics Suite software, all targets predicted by either the MicroCosm or TargetScan algorithms for each miRNA were identified. Analysis of the expression for all predicted targets of each miRNA as calculated in the microarray experiments failed to reveal any examples in which a downregulated miRNA correlated with a global increase in its predicted targets, or conversely an figure 1 were also used in these TLDA assays (cohort 1).A)Smoker-to-nonsmoker expression ratios are represented by black circles in order from lowest to highest for the 481 detected miRNAs. The arrow indicates the point where miRNA expression ratios in smokers and nonsmokers = 1.B)The expression ratios are shown for three additional endogenous control options provided with the TLDA assay are shown.C)The expression ratios and p-values of the 481 detected miRNAs are shown using a volcano plot. The significantly upregulated (red) and downregulated (blue) miRNAs are indicated along with the endogenous controls (green).D)The 54 miRNAs with smokers-to-nonsmokers expression ratios greater than 2 are shown following principle component analysis (PCA) with MATLAB software. This analysis identified a representative miRNA within each cluster with the highest Pearson correlation between its expression profile and the first principal component from our PCA analysis.E)Clustering analysis of the 54 regulated miRNAs was performed using CiMminer based onDCt-values of the TLDA results. The 4 clusters identified by PCA are labeled. Upregulated miRNAs are designated by various shades of red and downregulated miRNAs by various shades of blue.
doi:10.1371/journal.pone.0044066.g002
Table 3.miRNAs upregulated.2-fold in alveolar macrophages of smokers.
miRNA miRNA Family Polycistronic miRNA Precursor Fold Change p-value
miR-132* miR-132 miR-132/212 78.47 0.0002
miR-139-3p N/A N/A 52 0.0151
miR-548c-3p miR-548 miR-548c/548z 16.71 0.0357
miR-211 miR-204 N/A 15.77 0.0355
miR-222* miR-221 miR-221/222 15.3 0.0082
miR-221 miR-221 miR-221/222 12.59 0.0005
miR-221* miR-221 miR-221/222 5.77 0.009
miR-222 miR-221 miR-221/222 5.42 0.0006
miR-132 miR-132 miR-132/212 3.05 0.0017
miR-212 miR-132 miR-132/212 2.58 0.0102
upregulated miRNA correlated with a global decrease in its predicted targets (data not shown). There were, however, many instances in which downregulated miRNAs correlated with
increased expression of a subset of predicted targets (Table 5). There was only one upregulated miRNA family, miR-221, that was associated with a downregulated predicted target, IGF1.
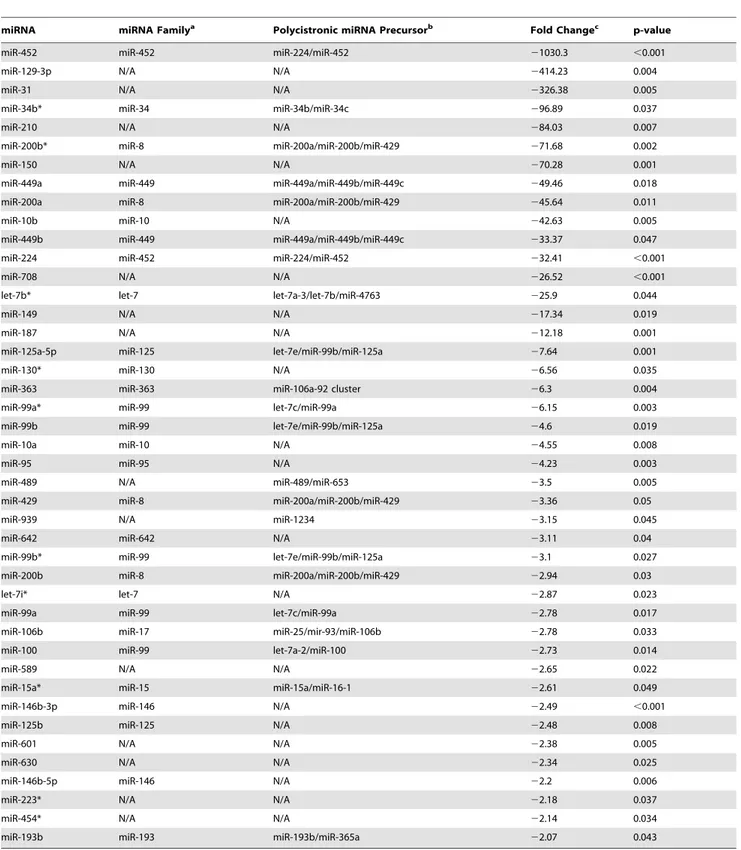
Table 4.miRNAs downregulated.2-fold in alveolar macrophages of smokers.
miRNA miRNA Familya Polycistronic miRNA Precursorb Fold Changec p-value
miR-452 miR-452 miR-224/miR-452 21030.3 ,0.001
miR-129-3p N/A N/A 2414.23 0.004
miR-31 N/A N/A 2326.38 0.005
miR-34b* miR-34 miR-34b/miR-34c 296.89 0.037
miR-210 N/A N/A 284.03 0.007
miR-200b* miR-8 miR-200a/miR-200b/miR-429 271.68 0.002
miR-150 N/A N/A 270.28 0.001
miR-449a miR-449 miR-449a/miR-449b/miR-449c 249.46 0.018
miR-200a miR-8 miR-200a/miR-200b/miR-429 245.64 0.011
miR-10b miR-10 N/A 242.63 0.005
miR-449b miR-449 miR-449a/miR-449b/miR-449c 233.37 0.047
miR-224 miR-452 miR-224/miR-452 232.41 ,0.001
miR-708 N/A N/A 226.52 ,0.001
let-7b* let-7 let-7a-3/let-7b/miR-4763 225.9 0.044
miR-149 N/A N/A 217.34 0.019
miR-187 N/A N/A 212.18 0.001
miR-125a-5p miR-125 let-7e/miR-99b/miR-125a 27.64 0.001
miR-130* miR-130 N/A 26.56 0.035
miR-363 miR-363 miR-106a-92 cluster 26.3 0.004
miR-99a* miR-99 let-7c/miR-99a 26.15 0.003
miR-99b miR-99 let-7e/miR-99b/miR-125a 24.6 0.019
miR-10a miR-10 N/A 24.55 0.008
miR-95 miR-95 N/A 24.23 0.003
miR-489 N/A miR-489/miR-653 23.5 0.005
miR-429 miR-8 miR-200a/miR-200b/miR-429 23.36 0.05
miR-939 N/A miR-1234 23.15 0.045
miR-642 miR-642 N/A 23.11 0.04
miR-99b* miR-99 let-7e/miR-99b/miR-125a 23.1 0.027
miR-200b miR-8 miR-200a/miR-200b/miR-429 22.94 0.03
let-7i* let-7 N/A 22.87 0.023
miR-99a miR-99 let-7c/miR-99a 22.78 0.017
miR-106b miR-17 miR-25/mir-93/miR-106b 22.78 0.033
miR-100 miR-99 let-7a-2/miR-100 22.73 0.014
miR-589 N/A N/A 22.65 0.022
miR-15a* miR-15 miR-15a/miR-16-1 22.61 0.049
miR-146b-3p miR-146 N/A 22.49 ,0.001
miR-125b miR-125 N/A 22.48 0.008
miR-601 N/A N/A 22.38 0.005
miR-630 N/A N/A 22.34 0.025
miR-146b-5p miR-146 N/A 22.2 0.006
miR-223* N/A N/A 22.18 0.037
miR-454* N/A N/A 22.14 0.034
miR-193b miR-193 miR-193b/miR-365a 22.07 0.043
aFamily names as specified by miRBase release 18.
To test our hypothesis that miRNAs influence the mRNA expression profiles in alveolar macrophages of cigarette smokers, we evaluated whether antagonizing the function of a specific miRNA would lead to increased mRNA expression of the predicted target. We were particularly interested in whether the highly downregulated miRNA, miR-452, influenced the expres-sion of MMP12, a protease relevant to smoking-related diseases that is highly upregulated in alveolar macrophages of smokers. Transfecting in an inhibitor of miR-452 resulted in elevated
expression of MMP12 transcripts, but had no effect on another predicted target of miR-452, TM7SF4 (Figure 5).
Discussion
dependent decrease in global miRNA abundance. Importantly, we describe many examples of inverse relationships between miRNAs and their predicted mRNA targets and used anin vitrosystem to
support our hypothesis that miRNAs influence the expression of an important macrophage product.
In vitropolarization of monocyte-derived macrophages (MDMs)
leads to distinct phenotypes that have been categorized as M1, M2a, M2b, and M2c [24,55]. This classification system is useful, particularly in defining gene expression programs related to
specific polarized phenotypes. However, the extent to which these phenotypes accurately depict macrophage phenotypesin vivohas
been difficult to determine, partly because purification of human macrophages from the tissues in which they are embedded is usually not possible. Human alveolar macrophages are unique in this aspect since relatively pure populations can be obtained from bronchoalveolar lavage fluid. A consistent alteration in gene expression profiles of human alveolar macrophages from cigarette smokers compared to nonsmokers has been reported by two Figure 4. Expression profiling of a second data set indicates a global repression of total miRNA abundance in alveolar macrophages of cigarette smokers.Nonsmoker, light smoker, and heavy smoker miRNA expression ratios were determined by TLDA assays using RNA from alveolar macrophages (cohort 3). The endogenous control, RNU48, was used to normalize the data.A)Smoker-to-nonsmoker expression ratios are represented by black circles (light smokers) and red circles (heavy smokers) in order from lowest to highest for 277 and 281 detected miRNAs, respectively.B)The number of miRNAs with a greater than 2-fold change between the two smoker groups and the nonsmokers are displayed.
doi:10.1371/journal.pone.0044066.g004
Table 5.Downregulated miRNAs in alveolar macrophages of smokers and corresponding predicted mRNA targets with
upregulated expression.
miRNA Predicted mRNA targeta
miR-95 PRSS21 (M)
miR-99a UGCG (M) miR-99b UGCG (M)
miR-100 UGCG (M)
miR-106b C10orf58 (M)
miR-125b ATP13A3 (T), BCAT1 (T), C10orf58 (T), CSF (M), LIPA (T), TXNRD1 (T) miR-130a ATP13A3 (T), BCAT1 (T)
miR-187 FAIM (M), MGST (M), UCHL1 (M)
miR-193b GCLC (M), SLC16A6 (M & T) miR-200b CCDC102B (M), CYP1B1 (T), FLT1 (T)
miR-363 SLC16A1
miR-429 ATP13A3 (M), CCDC102B (M), CSF1 (M), CYP1B1 (T), FLT1 (T), SDC2 (T) miR-449a C15orf48 (M), FABP3 (M), PRSS21 (M)
miR-449b C15orf48 (M), FABP3 (M)
miR-452 CCDC102B (M), GSR (M),MMP12 (M),MOSPD1 (M), SPRY2 (M), TDRD9 (M),TM7SF4 (M),C10orf58 (M), SLC7A11 (T) miR-601 CA2 (M)
miR-630 C15orf48 (M), CA2 (M), PLA2G7 (M), SLC04C1 (T), SPRY2 (M)
miR-708 CSF1 (T)
aGene symbols of putative miRNA targets with the prediction algorithm indicated within parenthesis (‘‘M’’ = MicroCosm; ‘‘T’’ = TargetScan). Text in bold identifies genes tested in correlation assays (see Figure 5).
independent groups of investigators [1,2,25]. Despite a relatively small alveolar macrophage sample size, we were able to confirm a similar transcriptional expression profile with Woodruff et al [25]. The gene expression profile of smoker alveolar macrophages was recently described as a ‘‘deactivated M1 polarization program’’ [2]. We suggest that the gene expression program could best be described as an ‘‘inverse’’ M1 profile, because M1-induced mRNAs are less abundant and M1-repressed mRNAs were more abundant in alveolar macrophages of smokers relative to nonsmokers.
Since cigarette smoking is associated with increased risk of pulmonary infections [56], understanding the mechanisms causing the inverse M1 phenotype in smoker alveolar macrophages might provide therapeutic targets for improving antimicrobial activity. Generation of M1-polarized MDMs in vitro is accomplished by
treatment with two stimuli, typically IFNcand either TNFa or another molecule that promotes TNFa production such as LPS [23,55]. One possibility is that the inverse M1 phenotype described for smoker alveolar macrophages is due to a cigarette smoke-induced defect in TNFa- and/or IFNc-induced signaling such as the NF-kB and JAK-STAT pathways. Indeed, impairment in IFNcsignaling has been described in alveolar macrophages and epithelial cells of cigarette smokers [57,58]. The mechanism responsible for impaired IFNc signaling is unknown. Whether miRNAs play a role promoting the inverse M1 gene expression program is currently being investigated.
We hypothesized that miRNAs are at least partly responsible for regulating the unique gene expression profile in alveolar macro-phages of smokers. The RNA samples collected from cohort 1 for mRNA expression profiling of smoker and nonsmoker alveolar macrophages were also used in TLDA miRNA profile assays to compare the abundance of 667 human miRNAs. This global approach to evaluating miRNA expression identified 54 miRNAs with significantly altered expression. Among the 10 miRNAs that were significantly upregulated by.2-fold, 7 are located on two polycistronic pri-miRNAs, the 132/212 cluster and the miR-221/222 cluster. Therefore, increased transcription of these two
polycistronic pri-miRNAs could explain almost all of the highly upregulated miRNAs in smoker alveolar macrophages. Similarly, transcriptional regulation may also be important for many of the significantly repressed miRNAs in smoker alveolar macrophages because ten downregulated miRNAs were processed from four polycistronic pri-miRNAs (miR-224/miR452, miR-200a/miR-200b/miR-429, miR-449a/miR-449b/miR-449c, and let-7e/ miR-99b/miR-125a).
An important observation from the miRNA profiling experi-ments was that the majority of miRNAs with altered expression in alveolar macrophages of smokers compared to nonsmokers were downregulated. Functionally, this should lead to increased mRNA expression in targeted genes. Using both the TargetScan and MicroCosm target prediction algorithms to analyze the results from cohort 1, we found that 30 of the 70 statistically significant mRNAs upregulated by.2-fold were putative targets of miRNAs that were significantly downregulated by .2-fold. The most strongly downregulated miRNA in smokers, miR-452, had the most predicted targets with upregulated expression. In experi-ments utilizing a miR-452 inhibitor, we show that inhibition of this miRNA in differentiated THP-1 cells resulted in elevated MMP12 transcript expression.
It is likely that miRNAs are not the only mechanism that could contribute to the inverse M1 alveolar macrophage phenotype. For example, soluble TNF receptor type II is increased in the sputum of smokers with COPD [59] and in mouse models [60]. This likely sequesters TNFa and dampens the effects of M1 polarizing stimuli. Furthermore, the transcript SPP1 (encoding osteopontin), is consistently highly upregulated in studies of smoker alveolar macrophages [1,2,25]. Osteopontin treatment of macrophages results in proteasome-mediated degradation of STAT1 [61,62].
There was a striking ,50–60% reduction in total miRNA abundance in alveolar macrophages of smokers relative to nonsmokers. Global repression of miRNA expression that was also noted using non-TLDA miRNA profiling platforms in epithelial cells of smokers and in lung tissue of rats in a model of cigarette smoking [41,54]. Furthermore, miRNA expression Figure 5. Inhibition of miRNA-452 results in increased MMP12 expression.RNA was collected from PMA-differentiated THP1 cells at 24 hours post-transfection with either a control miRNA inhibitor or a miR-452 inhibitor. Quantitative RT-PCR was used to determine the expression of putative miR-452 target. The mean expression with SEM from three independent experiments is shown for MMP12 and TM7SF4 as a ratio to HPRT for each sample.
profiling in induced sputum of cigarette smokers and nonsmokers showed that the majority of differentially expressed miRNAs were downregulated [59], although the method of data analysis in this latter study prevented the authors from commenting on differences in global miRNA abundance between the two alveolar macro-phage sample types.
The reduced global expression of miRNAs reported here in alveolar macrophages of smokers has also been reported for many cancers. For example, total miRNA abundance is lower in tumors and tumor-derived cell lines relative to corresponding normal tissue [63,64]. The initial studies of global miRNA repression in cancer noted that mRNAs encoding the miRNA processing machinery were not altered in cancer cells [64]. Likewise, we detected no statistically significant changes in alveolar macro-phages of smokers for transcripts encoding Dicer, Drosha, Ago1– 4, DGCR8, TRBP, PACT, exportin-5, or GW182 (data not shown). The repression of miRNAs in cancer appears to be due to inefficient processing of primary miRNA transcripts [65]. The cigarette smoke-induced mechanism of global miRNA repression in alveolar macrophages may be due to a deficiency in miRNA processing as described for cancer, an enhancement of miRNA degradation, or changes in primary miRNA transcription. Studies are ongoing to address each of these possibilities.
The impact that global miRNA expression levels has on cancer progression was addressed by experimentally knocking down the expression of Drosha, DCGR8, and Dicer [66]. The resulting global repression of miRNA abundance promoted cellular transformation and tumorigenesis. It is tempting to speculate that the global decrease in miRNA abundance described here is a previously unrecognized link between cigarette smoking and lung cancer. It will be important to determine whether global miRNA expression is restored in former cigarette smokers.
In summary, this is the first study to analyze miRNA expression in human alveolar macrophages from nonsmokers and active smokers. The data show a global repression of miRNA levels in smokers. In addition, many of the downregulated miRNAs are predicted to target mRNAs that had increased expression in alveolar macrophages of smokers. This supports a role for miRNA expression in regulating disease-relevant changes in gene expres-sion in smoker alveolar macrophages.
Author Contributions
Conceived and designed the experiments: JG TG MW MM. Performed the experiments: LP AD AR IH KK. Analyzed the data: JG AD JK MM. Contributed reagents/materials/analysis tools: JK. Wrote the paper: JG MW MM.
References
1. Heguy A, O’Connor TP, Luettich K, Worgall S, Cieciuch A, et al. (2006) Gene expression profiling of human alveolar macrophages of phenotypically normal smokers and nonsmokers reveals a previously unrecognized subset of genes modulated by cigarette smoking. J Mol Med 84: 318–328.
2. Shaykhiev R, Krause A, Salit J, Strulovici-Barel Y, Harvey BG, et al. (2009) Smoking-dependent reprogramming of alveolar macrophage polarization: implication for pathogenesis of chronic obstructive pulmonary disease. J Immunol 183: 2867–2883.
3. Vlahos R, Bozinovski S, Jones JE, Powell J, Gras J, et al. (2006) Differential protease, innate immunity, and NF-kappaB induction profiles during lung inflammation induced by subchronic cigarette smoke exposure in mice. Am J Physiol Lung Cell Mol Physiol 290: L931–945.
4. Hogg JC, Chu F, Utokaparch S, Woods R, Elliott WM, et al. (2004) The nature of small-airway obstruction in chronic obstructive pulmonary disease. N Engl J Med 350: 2645–2653.
5. Finkelstein R, Fraser RS, Ghezzo H, Cosio MG (1995) Alveolar inflammation and its relation to emphysema in smokers. Am J Respir Crit Care Med 152: 1666–1672.
6. Barnes PJ, Shapiro SD, Pauwels RA (2003) Chronic obstructive pulmonary disease: molecular and cellular mechanisms. Eur Respir J 22: 672–688. 7. Shapiro SD (1999) The macrophage in chronic obstructive pulmonary disease.
Am J Respir Crit Care Med 160: S29–32.
8. Hautamaki RD, Kobayashi DK, Senior RM, Shapiro SD (1997) Requirement for macrophage elastase for cigarette smoke-induced emphysema in mice. Science 277: 2002–2004.
9. Shapiro SD (2005) COPD unwound. N Engl J Med 352: 2016–2019. 10. Shapiro SD, Ingenito EP (2005) The Pathogenesis of Chronic Obstructive
Pulmonary Disease: Advances in the Past 100 Years. Am J Respir Cell Mol Biol 32: 367–372.
11. Hunninghake GM, Cho MH, Tesfaigzi Y, Soto-Quiros ME, Avila L, et al. (2009) MMP12, lung function, and COPD in high-risk populations. N Engl J Med 361: 2599–2608.
12. Bitterman PB, Rennard SI, Hunninghake GW, Crystal RG (1982) Human alveolar macrophage growth factor for fibroblasts. Regulation and partial characterization. J Clin Invest 70: 806–822.
13. Bitterman PB, Wewers MD, Rennard SI, Adelberg S, Crystal RG (1986) Modulation of alveolar macrophage-driven fibroblast proliferation by alternative macrophage mediators. J Clin Invest 77: 700–708.
14. Houghton AM, Quintero PA, Perkins DL, Kobayashi DK, Kelley DG, et al. (2006) Elastin fragments drive disease progression in a murine model of emphysema. J Clin Invest 116: 753–759.
15. Venet A, Hance AJ, Saltini C, Robinson BW, Crystal RG (1985) Enhanced alveolar macrophage-mediated antigen-induced T-lymphocyte proliferation in sarcoidosis. J Clin Invest 75: 293–301.
16. Wert SE, Yoshida M, LeVine AM, Ikegami M, Jones T, et al. (2000) Increased metalloproteinase activity, oxidant production, and emphysema in surfactant protein D gene-inactivated mice. Proc Natl Acad Sci U S A 97: 5972–5977. 17. Berenson CS, Garlipp MA, Grove LJ, Maloney J, Sethi S (2006) Impaired
phagocytosis of nontypeable Haemophilus influenzae by human alveolar
macrophages in chronic obstructive pulmonary disease. J Infect Dis 194: 1375–1384.
18. Chen H, Cowan MJ, Hasday JD, Vogel SN, Medvedev AE (2007) Tobacco smoking inhibits expression of proinflammatory cytokines and activation of IL-1R-associated kinase, p38, and NF-kappaB in alveolar macrophages stimulated with TLR2 and TLR4 agonists. J Immunol 179: 6097–6106.
19. Hodge S, Hodge G, Ahern J, Jersmann H, Holmes M, et al. (2007) Smoking alters alveolar macrophage recognition and phagocytic ability: implications in chronic obstructive pulmonary disease. American journal of respiratory cell and molecular biology 37: 748–755.
20. King TE Jr, Savici D, Campbell PA (1988) Phagocytosis and killing of Listeria monocytogenes by alveolar macrophages: smokers versus nonsmokers. J Infect Dis 158: 1309–1316.
21. Russell RE, Thorley A, Culpitt SV, Dodd S, Donnelly LE, et al. (2002) Alveolar macrophage-mediated elastolysis: roles of matrix metalloproteinases, cysteine, and serine proteases. Am J Physiol Lung Cell Mol Physiol 283: L867–873. 22. Stampfli MR, Anderson GP (2009) How cigarette smoke skews immune
responses to promote infection, lung disease and cancer. Nat Rev Immunol 9: 377–384.
23. Mosser DM, Edwards JP (2008) Exploring the full spectrum of macrophage activation. Nature Rev Immunol 8: 958–969.
24. Mantovani A, Sozzani S, Locati M, Allavena P, Sica A (2002) Macrophage polarization: tumor-associated macrophages as a paradigm for polarized M2 mononuclear phagocytes. Trends Immunol 23: 549–555.
25. Woodruff PG, Koth LL, Yang YH, Rodriguez MW, Favoreto S, et al. (2005) A distinctive alveolar macrophage activation state induced by cigarette smoking. Am J Respir Crit Care Med 172: 1383–1392.
26. Bartel DP (2009) MicroRNAs: target recognition and regulatory functions. Cell 136: 215–233.
27. Ventura A, Jacks T (2009) MicroRNAs and cancer: short RNAs go a long way. Cell 136: 586–591.
28. Guo H, Ingolia NT, Weissman JS, Bartel DP (2010) Mammalian microRNAs predominantly act to decrease target mRNA levels. Nature 466: 835–840. 29. Djuranovic S, Nahvi A, Green R (2011) A parsimonious model for gene
regulation by miRNAs. Science 331: 550–553.
30. Lim LP, Lau NC, Garrett-Engele P, Grimson A, Schelter JM, et al. (2005) Microarray analysis shows that some microRNAs downregulate large numbers of target mRNAs. Nature 433: 769–773.
31. Taganov KD, Boldin MP, Chang KJ, Baltimore D (2006) NF-kappaB-dependent induction of microRNA miR-146, an inhibitor targeted to signaling proteins of innate immune responses. Proc Natl Acad Sci U S A 103: 12481– 12486.
32. Androulidaki A, Iliopoulos D, Arranz A, Doxaki C, Schworer S, et al. (2009) The kinase Akt1 controls macrophage response to lipopolysaccharide by regulating microRNAs. Immunity 31: 220–231.
33. O’Connell RM, Taganov KD, Boldin MP, Cheng G, Baltimore D (2007) MicroRNA-155 is induced during the macrophage inflammatory response. Proc Natl Acad Sci U S A 104: 1604–1609.
micro-RNA-155 precursors in macrophages. The FASEB journal : official publication of the Federation of American Societies for Experimental Biology 23: 2898– 2908.
35. Tili E, Michaille JJ, Cimino A, Costinean S, Dumitru CD, et al. (2007) Modulation of miR-155 and miR-125b levels following lipopolysaccharide/ TNF-alpha stimulation and their possible roles in regulating the response to endotoxin shock. J Immunol 179: 5082–5089.
36. Tserel L, Runnel T, Kisand K, Pihlap M, Bakhoff L, et al. (2011) MicroRNA expression profiles of human blood monocyte-derived dendritic cells and macrophages reveal miR-511 as putative positive regulator of Toll-like receptor 4. J Biol Chem 286: 26487–26495.
37. Lu LF, Boldin MP, Chaudhry A, Lin LL, Taganov KD, et al. (2010) Function of miR-146a in controlling Treg cell-mediated regulation of Th1 responses. Cell 142: 914–929.
38. Nahid MA, Pauley KM, Satoh M, Chan EK (2009) miR-146a is critical for endotoxin-induced tolerance: IMPLICATION IN INNATE IMMUNITY. J Biol Chem 284: 34590–34599.
39. O’Neill LA, Sheedy FJ, McCoy CE (2011) MicroRNAs: the fine-tuners of Toll-like receptor signalling. Nat Rev Immunol 11: 163–175.
40. Tang Y, Luo X, Cui H, Ni X, Yuan M, et al. (2009) MicroRNA-146A contributes to abnormal activation of the type I interferon pathway in human lupus by targeting the key signaling proteins. Arthritis Rheum 60: 1065–1075. 41. Schembri F, Sridhar S, Perdomo C, Gustafson AM, Zhang X, et al. (2009)
MicroRNAs as modulators of smoking-induced gene expression changes in human airway epithelium. Proc Natl Acad Sci U S A 106: 2319–2324. 42. Reisetter AC, Stebounova LV, Baltrusaitis J, Powers L, Gupta A, et al. (2011)
Induction of inflammasome-dependent pyroptosis by carbon black nanoparti-cles. J Biol Chem 286: 21844–21852.
43. Monick MM, Carter AB, Gudmundsson G, Geist LJ, Hunninghake GW (1998) Changes in PKC isoforms in human alveolar macrophages compared with blood monocytes. Am J Physiol 275: L389–397.
44. Monick MM, Powers LS, Barrett CW, Hinde S, Ashare A, et al. (2008) Constitutive ERK MAPK activity regulates macrophage ATP production and mitochondrial integrity. J Immunol 180: 7485–7496.
45. Monick MM, Powers LS, Gross TJ, Flaherty DM, Barrett CW, et al. (2006) Active ERK Contributes to Protein Translation by Preventing JNK-Dependent Inhibition of Protein Phosphatase 1. J Immunol 177: 1636–1645.
46. Monick MM, Powers LS, Walters K, Lovan N, Zhang M, et al. (2010) Identification of an autophagy defect in smokers’ alveolar macrophages. J Immunol 185: 5425–5435.
47. Benjamini Y, Krieger A, Yekutieli D (2001) Two staged linear step up FDR controlling procedure. Tel Aviv University, and Department of Statistics, Wharton School, University of Pennsylvania.
48. Langfelder P, Horvath S (2007) Eigengene networks for studying the relationships between co-expression modules. BMC systems biology 1: 54. 49. Lewis BP, Shih IH, Jones-Rhoades MW, Bartel DP, Burge CB (2003) Prediction
of mammalian microRNA targets. Cell 115: 787–798.
50. Griffiths-Jones S, Saini HK, van Dongen S, Enright AJ (2008) miRBase: tools for microRNA genomics. Nucleic Acids Res 36: D154–158.
51. Tsuchiya S, Kobayashi Y, Goto Y, Okumura H, Nakae S, et al. (1982) Induction of maturation in cultured human monocytic leukemia cells by a phorbol diester. Cancer Res 42: 1530–1536.
52. Hansdottir S, Monick MM (2011) Vitamin D effects on lung immunity and respiratory diseases. Vitamins and hormones 86: 217–237.
53. Martinez FO, Gordon S, Locati M, Mantovani A (2006) Transcriptional profiling of the human monocyte-to-macrophage differentiation and polariza-tion: new molecules and patterns of gene expression. Journal of immunology 177: 7303–7311.
54. Izzotti A, Calin GA, Arrigo P, Steele VE, Croce CM, et al. (2009) Downregulation of microRNA expression in the lungs of rats exposed to cigarette smoke. The FASEB journal : official publication of the Federation of American Societies for Experimental Biology 23: 806–812.
55. Martinez FO, Sica A, Mantovani A, Locati M (2008) Macrophage activation and polarization. Frontiers in bioscience : a journal and virtual library 13: 453– 461.
56. Stampfli MR, Anderson GP (2009) How cigarette smoke skews immune responses to promote infection, lung disease and cancer. Nature reviews Immunology 9: 377–384.
57. Modestou MA, Manzel LJ, El-Mahdy S, Look DC (2010) Inhibition of IFN-gamma-dependent antiviral airway epithelial defense by cigarette smoke. Respir Res 11: 64.
58. Dhillon NK, Murphy WJ, Filla MB, Crespo AJ, Latham HA, et al. (2009) Down modulation of IFN-gamma signaling in alveolar macrophages isolated from smokers. Toxicol Appl Pharmacol 237: 22–28.
59. Pottelberge GR, Mestdagh P, Bracke KR, Thas O, Durme YM, et al. (2011) MicroRNA expression in induced sputum of smokers and patients with chronic obstructive pulmonary disease. Am J Respir Crit Care Med 183: 898–906. 60. D’Hulst A I, Bracke KR, Maes T, De Bleecker JL, Pauwels RA, et al. (2006)
Role of tumour necrosis factor-alpha receptor p75 in cigarette smoke-induced pulmonary inflammation and emphysema. The European respiratory journal : official journal of the European Society for Clinical Respiratory Physiology 28: 102–112.
61. Gao C, Guo H, Mi Z, Grusby MJ, Kuo PC (2007) Osteopontin induces ubiquitin-dependent degradation of STAT1 in RAW264.7 murine macrophag-es. Journal of immunology 178: 1870–1881.
62. Guo H, Wai PY, Mi Z, Gao C, Zhang J, et al. (2008) Osteopontin mediates Stat1 degradation to inhibit iNOS transcription in a cecal ligation and puncture model of sepsis. Surgery 144: 182–188.
63. Gaur A, Jewell DA, Liang Y, Ridzon D, Moore JH, et al. (2007) Characterization of microRNA expression levels and their biological correlates in human cancer cell lines. Cancer Res 67: 2456–2468.
64. Lu J, Getz G, Miska EA, Alvarez-Saavedra E, Lamb J, et al. (2005) MicroRNA expression profiles classify human cancers. Nature 435: 834–838.
65. Thomson JM, Newman M, Parker JS, Morin-Kensicki EM, Wright T, et al. (2006) Extensive post-transcriptional regulation of microRNAs and its implications for cancer. Genes & development 20: 2202–2207.