Impaired Visual Integration in Children with
Traumatic Brain Injury: An Observational
Study
Marsh Königs1☯*, Wouter D. Weeda1,2,3‡, L. W. Ernest van Heurn4‡, R.
Jeroen Vermeulen5,6‡, J. Carel Goslings7‡, Jan S. K. Luitse8‡, Bwee Tien Poll-Thé9‡, Anita Beelen10,11‡, Marleen van der Wees12‡, Rachèl J. J. K. Kemps13‡, Coriene E. Catsman-Berrevoets14‡, Jaap Oosterlaan1,15☯
1Department of Clinical Neuropsychology, VU University Amsterdam, Amsterdam, The Netherlands, 2Department of Methods, VU University Amsterdam, Amsterdam, The Netherlands,3Institute of Psychology, Department of Methodology and Statistics, Leiden University, Leiden, The Netherlands, 4Pediatric Surgical Center of Amsterdam, Emma Children’s Hospital Academic Medical Center and VU University Medical Center, Amsterdam, The Netherlands,5Department of Pediatric Neurology, VU University Medical Center, Amsterdam, The Netherlands,6Department of Pediatric Neurology, Maastricht University, Medical Center, Maastricht, The Netherlands,7Trauma Unit, Academic Medical Center, Amsterdam, The Netherlands,8Department of Emergency Medicine, Academic Medical Center, Amsterdam, The Netherlands,9Department of Pediatric Neurology, Emma Children’s Hospital Academic Medical Centre, Amsterdam, The Netherlands,10 Merem Rehabilitation Center‘De Trappenberg’, Huizen, The Netherlands,11Department of Rehabilitation, Academic Medical Center, Amsterdam, The Netherlands, 12Libra Rehabilitation Medicine and Audiology,‘Blixembosch’, Eindhoven, The Netherlands,13Libra Rehabilitation Medicine and Audiology‘Leijpark’, Tilburg, The Netherlands,14 Department of Pediatric Neurology, Erasmus Medical Center, Rotterdam, The Netherlands,15 Emma Children’s Hospital Academic Medical Center, Amsterdam, the Netherlands
☯These authors contributed equally to this work. ‡These authors also contributed equally to this work. *[email protected]
Abstract
Background
Axonal injury after traumatic brain injury (TBI) may cause impaired sensory integration. We aim to determine the effects of childhood TBI on visual integration in relation to general neu-rocognitive functioning.
Methods
We compared children aged 6–13 diagnosed with TBI (n= 103; M = 1.7 years post-injury) to
children with traumatic control (TC) injury (n= 44). Three TBI severity groups were
distin-guished: mild TBI without risk factors for complicated TBI (mildRF-TBI,n= 22), mild TBI with
1 risk factor (mildRF+TBI,n= 46) or moderate/severe TBI (n= 35). An experimental para-digm measured speed and accuracy of goal-directed behavior depending on: (1) visual identification; (2) visual localization; or (3) both, measuring visual integration. Group-differ-ences on reaction time (RT) or accuracy were tracked down to task strategy, visual process-ing efficiency and extra-decisional processes (e.g. response execution) usprocess-ing diffusion
a11111
OPEN ACCESS
Citation:Königs M, Weeda WD, van Heurn LWE, Vermeulen RJ, Goslings JC, Luitse JSK, et al. (2015) Impaired Visual Integration in Children with Traumatic Brain Injury: An Observational Study. PLoS ONE 10 (12): e0144395. doi:10.1371/journal.pone.0144395
Editor:Anna-Leena Sirén, University of Wuerzburg, GERMANY
Received:August 13, 2015
Accepted:November 17, 2015
Published:December 4, 2015
Copyright:© 2015 Königs et al. This is an open access article distributed under the terms of the Creative Commons Attribution License, which permits unrestricted use, distribution, and reproduction in any medium, provided the original author and source are credited.
model analysis. General neurocognitive functioning was measured by a Wechsler Intelli-gence Scale short form.
Results
The TBI group had poorer accuracy of visual identification and visual integration than the
TC group (Ps.03; ds-0.40). Analyses differentiating TBI severity revealed that visual
identification accuracy was impaired in the moderate/severe TBI group (P = .05,d= -0.50)
and that visual integration accuracy was impaired in the mildRF+TBI group and moderate/
severe TBI group (Ps<.02,ds-0.56). Diffusion model analyses tracked impaired visual
integration accuracy down to lower visual integration efficiency in the mildRF+TBI group and
moderate/severe TBI group (Ps<.001,ds-0.73). Importantly, intelligence impairments
observed in the TBI group (P = .009,d= -0.48) were statistically explained by visual
integra-tion efficiency (P = .002).
Conclusions
Children with mildRF+TBI or moderate/severe TBI have impaired visual integration
effi-ciency, which may contribute to poorer general neurocognitive functioning.
Introduction
Worldwide, an estimated 54–60 million individuals sustain traumatic brain injury (TBI) each year [1], being the leading cause of acquired disability among children and adolescents [2]. Impaired white matter integrity is believed to represent a crucial mechanism in the neuropa-thology of TBI [3]. Axonal injury causes disconnection of neural networks and is thought to underlie impaired integration of sensory processing after TBI [4]. Visual processing is essential to general neurocognitive functioning [5] and impaired visual integration after TBI may there-fore account for daily life difficulties observed in children with TBI.
Axonal injury in TBI is caused by shearing mechanical forces of rapid acceleration and deceleration, followed by secondary biochemical mechanisms involving cytotoxic inflamma-tory cascades and edema that may result in raised intracranial pressure [6]. A meta-analysis of diffusion tensor imaging studies has shown widespread microstructural white matter abnor-malities in children with moderate/severe TBI [7]. Even children with mild TBI have been identified with microstructural white matter abnormalities in the acute phase, while evidence from adults additionally indicates that these white matter abnormalities persist into the chronic phase of recovery [7,8]. These findings indicate that TBI induces white matter damage along the full span of injury severity, with a persisting detrimental impact on white matter integrity.
White matter facilitates the structural connectivity of the brain, allowing the integration of processes originating from specialized brain areas [9–11]. The visual cortex is known to have a high degree of functional specialization [12], thereby crucially relying on visual integration to construct of a full representation of the environment, which is in turn essential for efficient interaction with the environment [5]. The detrimental impact of TBI on white matter integrity -and its associated loss of structural connectivity- is therefore likely to interfere with visual inte-gration. In line with this hypothesis, we showed in a recent meta-analysis of 81 studies that visuospatial functioning is strongly impacted by TBI, and is considered to be more heavily affected than verbal functioning [13]. However, most of the tasks measuring visual functioning Funding:This work was supported by the
Netherlands Organization for Scientific Research (NWO,http://www.nwo.nl/) grant number 022.003.010, granted to Marsh Königs MSc. The funders had no role in study design, data collection and analysis, decision to publish, or preparation of the manuscript.
used in the literature do not only require visual integration, but also tap a range of other func-tions including attention, speed of information processing and visuomotor skills [14,15]. To the best of our knowledge, no study to date has attempted to isolate the effects of childhood TBI on visual integration.
We developed the Visual Integration Test to measure the efficiency of goal-directed behav-ior that is increasingly dependent on visual integration. This computerized test is a sensitive measure of visual processing of identity and location as well as the integration of these pro-cesses, with minimal load on motor function and correcting for the potentially confounding influence of processing speed over test conditions. The aim of current study is to elucidate the effects of childhood TBI on visual integration along the full continuum of injury severity. Dif-fusion model analysis was used to study the contributions of task strategy, efficiency of visual processing and extra-decisional processes (i.e. encoding and response execution) to task perfor-mance. Last, we explored the impact of potential visual integration deficits on general neuro-cognitive functioning as measured by intelligence. We hypothesize that the effects of TBI on the structural connectivity of the brain reduce the efficiency of visual integration, having a neg-ative impact on intelligence.
Methods
Participants
Sample. This study compared a TBI group of 103 children to a trauma control (TC) group of 44 children with traumatic injury not involving the head, to control for pre-injury risk fac-tors of traumatic injury and psychological effects of hospitalization [16]. All children were ret-rospectively recruited from a consecutive cohort of three university-affiliated level I trauma centers and three rehabilitation centers in the Netherlands. Inclusion criteria were: (1) age at testing 6–13 years; (2) proficient in the Dutch language; (3) hospital admission with a clinical diagnosis of TBI for inclusion in the TBI group; (4) hospital admission for traumatic injuries below the clavicles for inclusion in the TC group [17], and (5) more than two months post-injury to avoid additional patient burden in the acute phase of recovery. Exclusion criteria were: (1) previous TBI; (2) visual disorder interfering with neurocognitive testing; (3) current neurological condition with known effects on neurocognitive functioning, other than TBI; or (4) clinical diagnosis of dyslexia or dyscalculia, as the task involved in current study required correct identification of numbers. Of all 375 children admitted between October 2009-October 2013 that were eligible for inclusion (TBI and TC:n= 232 vs.n= 143), 54 were not reached (n= 39 vs.n= 15) and 137 declined participation (n= 68 vs.n= 69). Main reasons not to par-ticipate were: not interested (25% vs. 32%), no time (22% vs. 22%) or too high a burden on child (8% vs. 16%). Last, 31 children were excluded (TBI:n= 6 not proficient in Dutch,n= 5 age exceeding criterion,n= 1 motor retardation,n= 8 dyslexia,n= 1 premature termination of participation; TC:n= 3 not proficient in Dutch,n= 1 previous TBI,n= 1 brain tumor,n= 1 mental retardation,n= 3 dyslexia andn= 1 premature termination of participation), while data of six children was not available due to technical failure (TBI:n= 1, TC:n= 5). The remaining children with TBI (n= 103) did not differ from their respective recruitment cohort (n= 232) on age (M [SD] = 8.5 [2.0] and M [SD] = 8.7 [2.1], respectively; P = .39) and gender (64% and 58% males, respectively, P = .29). Likewise, the remaining children with TC (n= 44) did also not differ from their respective recruitment cohort (n= 143) in terms of age (M [SD] = 9.2 [2.2] and M [SD] = 9.6 [2.1], respectively; P = .25) or gender (48% and 63%, respectively; P = .08).
day of admission; (3) admission duration; (4) the presence of risk factors for complicated mild TBI according to the European Federation of Neurological Societies guidelines on mild TBI [18]. These risk factors involved impaired consciousness (GCS = 13–14), focal neurological deficits, persistent vomiting (3 episodes), post-injury epileptic insults, progressive headache and abnormal CT-scan of the skull or brain [18]. Injury severity was categorized into mild TBI (GCS = 15–13, loss of consciousness [LOC] duration30 minutes, post-traumatic amnesia [PTA] duration1 hour) without risk factors (mildRF-TBI,n= 22), mild TBI with at least one risk factor (mildRF+TBI,n= 46), and moderate/severe TBI (GCS = 12–3, LOC duration>30
minutes, PTA duration>1 hour;n= 35) [19].
Measures
Demographics and clinical diagnoses. Data on gender, age, socio-economic status (SES) and diagnosed psychiatric and learning disorders were collected using a parental questionnaire. SES was defined as the average level of parental education ranging from 1 (no education) to 8 (postdoctoral education) [20].
Intelligence. Full-scale IQ (FSIQ) was estimated using a short form of the Wechsler Intel-ligence Scale for Children-III (including the subtests Vocabulary, Similarities, Block Design and Picture Arrangement), with a previous study indicating excellent validity (r= .93) and reli-ability (r= .93) in estimating FSIQ [21].
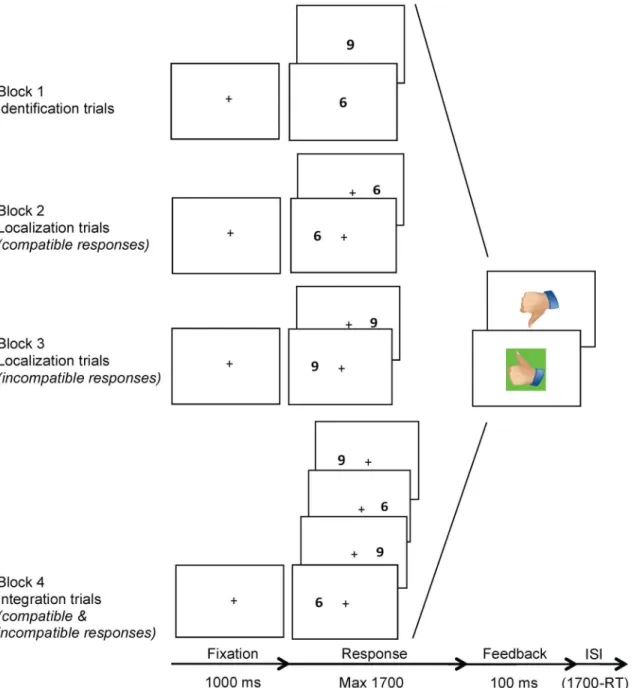
Visual Integration Test. The Visual Integration Test is a computerized paradigm that was designed to measure the efficiency of: (1) identification of visual stimuli, (2) localization of visual stimuli and (3) the integration of these two processes. This test consisted of three condi-tions: the identification, localization and integration conditions, administered in four sequen-tial blocks (Fig 1). The identification condition (block 1) required visual processing of identity: the target was digit‘6’or‘9’presented in the center of the screen and subjects were required to press the left or right button on a response box, respectively. The localization condition (block 2 and 3) required visual processing of the location of targets that were presented on the left or right side of the screen. In block 2, the target was‘6’and the required response was compatible with the target location. In block 3, the target was '9' and the required response was incompati-ble with the target location. The integration condition (block 4) required processing of the visual identity as well as location of targets presented on the left or right of the screen, measur-ing visual integration. The targets were either '6' or '9', and they required compatible and incompatible responses, respectively. In other words, a‘6’presented on the right side of the screen required a right button response, whereas a‘9’presented on the right side of the screen required a left button response, and vice versa. Dependent variables were mean reaction time (MRT) and accuracy in the three conditions.
Diffusion model. In case effects of TBI were observed on MRT or accuracy, we used the diffusion model in order to pinpoint deficits underlying impaired performance on visual iden-tification, localization or integration. The diffusion model is an extensively studied model that allows to distinguish between the effects ofboundary separation(i.e. task strategy),drift rate
the amount of information required to initiate a response.Boundary separationdepends on the ratio between RT and accuracy (i.e. speed-accuracy trade-off), where higher values indicate a more conservative response strategy (slow but accurate responding) while lower values indicate a more risky strategy (fast and inaccurate responding).Drift ratedescribes the speed and Fig 1. Visual Integration Test procedure.Note. The Visual Integration Test consisted of three conditions: the identification, localization and integration conditions, administered in four sequential blocks. The identification condition (block 1) required visual processing of identity: the target was digit‘6’or‘9’ presented in the center of the screen and subjects were required to press the left or right button on a response box, respectively. The localization condition (block 2 and 3) required visual processing of the location of targets that were presented on the left or right side of the screen. In block 2, the target was‘6’and the required response was compatible with the target location. In block 3, the target was '9' and the required response was incompatible with the target location. The integration condition (block 4) required processing of the visual identity as well as location of targets presented on the left or right of the screen, measuring visual integration. The targets were either '6' or '9', and they required compatible and incompatible responses, respectively. In other words, a‘6’ presented on the right side of the screen required a right button response, whereas a‘9’presented on the right side of the screen required a left button response, and vice versa. ISI = inter-stimulus interval.
quality of information accumulation, where higher values indicate more efficient processing (fast and accurate) and lower values indicate less efficient processing (slow and inaccurate).
Non-decision timerefers to processes involved in a task other than the decision process, mainly involving encoding and motor response execution. Higher values of non-decision time indicate slower non-decisional processes, while lower values indicate faster non-decisional processes.
Procedure
The families of eligible children were sent an information letter and contacted by telephone two weeks later. Participating children were administered the Visual Integration Test by trained examiners in a quiet room while parents filled out the questionnaire in a waiting room. The Visual Integration Test was administered during approximately 15 minutes in four sequentially presented blocks: the first block consisted of 30 identification trials, the second and third block of 30 localization trials each and the third block of 60 integration trials. Visually presented feedback on performance was provided following each response throughout the test (Fig 1).
Ethics statement
This study was approved for all participating centers by the VU University Medical Centre medical ethical committee (NL37226.029.11) and conducted in accordance with the declara-tion of Helsinki [27]. Parents and participating children aged>11 years provided written
informed consent for participation.
Statistical Analysis
Statistical analyses were performed using SPSS 22.0. Dependent variables were screened for outliers (-3.29>z-score>3.29) which were rescaled to a value one unit extremer than the
most extreme non-outlier [28]. There were no missing data. To address group comparability, the TBI group, TBI severity groups and TC group were compared on demographics, injury-related variables and the prevalence of clinical diagnoses using ANOVA and chi-square tests, where appropriate. To assess intelligence after TBI, the TBI and TC group were compared on FSIQ using ANOVA.
Regarding Visual Integration Test performance, trials with very fast RTs suspected of antici-patory behavior (RT<250 ms) or very slow RTs suspected of distracted behavior (individual
outliers at z-score>3.29), were removed for each subject in each condition. Next, MRT and
accuracy were separately analyzed using repeated measures ANOVA with task condition as within-subject variable (identification, localization and integration condition) and group as between-subject variable (TBI and TC group). When a significant interaction between group and task condition was found, the TBI and TC groups were further compared in each task con-dition separately. When a significant main effect of group was found for a certain task condi-tion, the diffusion model was applied to the RT and accuracy distributions of each participant in that condition usingfast-dm[29]. The resulting measures, involvingboundary separation
If a main effect of group on any dependent variable was obtained, this variable was subjected to: (1) a Pearson correlation analysis with time since injury in the TBI group to explore recov-ery effects; and (2) follow-up analyses differentiating for TBI severity using a linear polynomial contrast (TC, mildRF-TBI, mildRF+TBI and moderate/severe TBI) and least square difference (LSD) post hoc tests. Last, the role of potential deficits in visual identification, visual localiza-tion and visual integralocaliza-tion for general neurocognitive funclocaliza-tioning after pediatric TBI was investigated using bootstrapping mediation models [31]. Visual Integration Test variables for which group differences were observed, were inserted as mediators of the relation between group membership (TBI-TC group) and FSIQ. As FSIQ is adjusted for age, we also age-adjusted Visual Integration Test variables using linear regression. Analyses were two-tailed,α was set at .05 and effect sizes were expressed as Cohen’sd.
Results
Patient Characteristics
Patient characteristics regarding demographics, injury severity and clinical diagnoses, and rele-vant group comparisons are provided inTable 1. Comparisons between the TBI group
(n= 103) and TC group (n= 44) on demographic variables revealed no differences, except for lower SES in the TBI group. As expected on basis of the inclusion criteria, the TBI group had longer hospitalization duration, higher prevalence of CT-scanning and lower prevalence of extracranial fractures and orthopedic surgery than the TC group. The TBI group and TC group did not differ on the prevalence of psychiatric or learning disorders.
Group comparisons differentiating TBI severity also revealed no differences on demo-graphic variables, except for lower SES in all TBI groups as compared to the TC group (Ps .03). The moderate/severe TBI group had longer hospital admission, lower GCS scores and more neurosurgery as compared to all other groups (Ps.04). CT-scans were more prevalent in the moderate/severe TBI group and mildRF+TBI group than in the mildRF-TBI group, and in turn more prevalent in the mildRF-TBI group as compared to the TC group (Ps<.001). The
available CT-scans revealed progressively more cranial fractures and intracranial pathology in the mildRF-, mildRF+and moderate/severe TBI groups (Ps.01). Differences in the prevalence of clinical diagnoses only reached significance for the higher prevalence of psychiatric condi-tions in the mildRF+TBI group as compared to the TC group (P = .02).
Intelligence
FSIQ was lower in the TBI group than the TC group. Follow-up analysis revealed a linear effect of TBI severity on FSIQ (P = .008), reflecting that increasing TBI severity was related to poorer intelligence. More specifically, FSIQ was significantly lower in the mildRF+TBI group (P = .02,
d= -0.54) and moderate/severe TBI group (P = .02,d= -0.58) as compared to the TC group. Time since injury was not related to FSIQ in the TBI group (r = -.03, P = .78).
Visual Integration Test Performance
Table 2. MRT and accuracy of Visual Integration Test performance in the TBI and TC groups.
Group Condition Condition x
Group
Group Contrasts
TBI TC F P F P F P P Cohen’sd
n 103 44
MRT 660.4 <.001 0.4 .64 4.7 .03
Identification, M (SD) 706 (188) 650 (167) Localization, M (SD) 604 (177) 532 (150) Integration, M (SD) 982 (206) 901 (254)
Accuracy 66.6 <.001 4.2 .02 7.8 .006
Identification, M (SD) 0.92 (0.07) 0.95 (0.05) .03 -0.40
Localization, M (SD) 0.97 (0.04) 0.98 (0.02) .21 -0.22
Integration, M (SD) 0.86 (0.12) 0.91 (0.09) .006 -0.50
Note. TBI = traumatic brain injury; TC = trauma control; MRT = mean reaction time; M = mean; SD = standard deviation.
doi:10.1371/journal.pone.0144395.t002
Table 1. Demographics, injury-related variables, clinical diagnoses and intelligence in the TBI, TC and TBI severity groups.
Group Contrast TBI Severity Contrastsa
TBI TC P Cohen’sd MildRF-TBI MildRF+TBI Moderate/Severe TBI
n 103 44 22 46 35
Demographics
Males,n(%) 59 (57) 21 (48) .29 - 11 (50) 18 (61) 15 (57) NS
Age at testing in y, M (SD) 8.7 (2.0) 9.3 (2.2) .12 -0.29 8.5 (2.0) 8.8 (2.0) 8.8 (2.0) NS SES, M (SD) 5.3 (1.3) 5.9 (1.1) .003 -0.54 5.2 (1.3) 5.3 (1.2) 5.2 (1.3) TC>1,2,3
Injury-related information
Age at injury in y, M (SD) 6.9 (2.3) 7.7 (2.3) .07 -0.33 6.8 (2.3) 7.1 (2.3) 6.8 (2.5) NS
Lowest GCS, M (SD) 12.5 (3.5) - - - 15.0 (0.0) 14.6 (0.7) 8.2 (2.8) 3<1,2
Hospital admission ind 8.3 (19.0) 2.5 (1.9) .04 0.37 1.9 (0.3) 3.4 (2.9) 18.8 (30.1) 3>TC,1,2 Time since injury in y, M (SD) 1.8 (1.1) 1.6 (0.8) .34 -0.17 1.7 (1.0) 1.7 (1.0) 1.9 (1.3) NS
Range 0.3–5.4 0.4–3.5 0.5–3.8 0.3–4.4 0.4–5.4
Extracranial fracture,n(%) 17 (17) 32 (73) <.001 1 (5) 8 (17) 8 (23) TC>1,2,3
>1 Extracranial fractures,n(%) 7 (7) 4 (9) .63 0 (0) 3 (7) 4 (11) NS
CT-scan 83 (81) 1 (2) <.001 9 (41) 41 (89) 34 (97) 2,3>1>TC
Cranial fracture,n(%) 36 (35) - 0 (0) 15 (33) 21 (60) 3>2>1
Intracranial pathology,n(%) 39 (38) - 0 (0) 15 (33) 24 (69) 3>2>1
Orthopedic surgery,n(%) 9 (9) 35 (80) <.001 1 (5) 7 (15) 1 (3) TC>1,2,3
Neurosurgery,n(%) 12 (12) - 0 (0) 0 (0) 12 (34) 3>2,1
Diagnosed conditions
Psychiatric disorder,n(%) 8 (8) 0 (0) .06 1 (5) 5 (11) 2 (6) 2>TC
Premorbid ADHD,n(%) 4 (4) 0 (0) .19 0 (0) 3 (7) 1 (3) NS
Learning disorder,n(%) 1 (1) 0 (0) .51 0 (0) 0 (0) 1 (3) NS
Intelligence
FSIQ, M(SD) 98.4 (15.9) 105.8 (14.5) .009 -0.48 101.7 (16.9) 97.8 (15.8) 97.3 (15.7) TC>2,3
Note. TBI = traumatic brain injury; TC = traumatic control; M = mean; SD = standard deviation; SES = socio-economic status, GCS = Glasgow Coma Scale, CT = computerized tomography, FSIQ = full-scale IQ; NS = not significant
aTC = traumatic control; 1 = mildRF-TBI; 2 = mildRF+TBI; 3 = moderate/severe TBI.
more severe TBI was associated with increasingly slower task performance. Post-hoc group comparisons only revealed significantly slower task performance in the moderate/severe TBI group than in the TC group (P = .01,d= 0.57).
The main effect of task condition on accuracy reflected progressively poorer performance in the visual localization, identification and integration conditions, respectively. Group interacted with task condition on accuracy, suggesting differential effects of TBI on visual identification, localization and integration. Subsequent analyses on separate conditions revealed lower accu-racy in the TBI group as compared to the TC group in the identification condition and the inte-gration condition. In the TBI group, time since injury was not related to the accuracy of visual identification or visual integration (rs<.07, Ps>49).
Follow-up analyses differentiating TBI severity (displayed inFig 2) revealed linear effects of TBI severity on accuracy in both the identification condition (P = .04) and the integration con-dition (P = .01). These findings indicate that more severe TBI was associated with increasingly poorer identification accuracy and integration accuracy. Post-hoc analyses in the identification condition only revealed lower accuracy in the moderate/severe TBI group (P = .05,d= -0.50) as compared to the TC group. Post-hoc analyses in the integration condition revealed lower accuracy in the mildRF+TBI group (P = .006,d= -0.60) and moderate/severe TBI group (P = .02,d= -0.56) than in the TC group.
Diffusion model analysis. Diffusion model analysis (Table 3) was used to track down the observed effects of TBI on visual identification accuracy and visual integration accuracy to the following aspects of task performance:boundary separation(i.e. task strategy),drift rate(i.e. visual processing efficiency) and/ornon-decision time(i.e. extra-decisional processes involving encoding and motor response execution). With regard to visual identification, the TBI and TC
Fig 2. Analyses differentiating TBI severity on visual identification accuracy, visual integration accuracy and visual integrationdrift rate.Note.*P
<.05**P<.01***P<.001.
groups did not differ on any of the diffusion model parameters. In contrast, comparisons of dif-fusion model parameters for visual integration revealed lower visual integrationdrift ratein the TBI group than in the TC group. Time since injury was not related to visual integration
drift ratein the TBI group (r = .04, P = .70).
Follow-up analysis on visual integrationdrift rate(Fig 2) revealed a linear effect of TBI severity, indicating that more severe TBI was related to increasingly lower integrationdrift rate. Group differences on visual integrationdrift rateassessed by post-hoc analysis reached significance between the TC group and the mildRF+TBI group (P<.001,d= -0.73) and
between the TC group and moderate/severe TBI group (P<.001,d= -0.81), indicating that
mildRF+TBI and moderate/severe TBI have a negative impact on the efficiency of visual inte-gration processing.
Mediating role of VIT performance
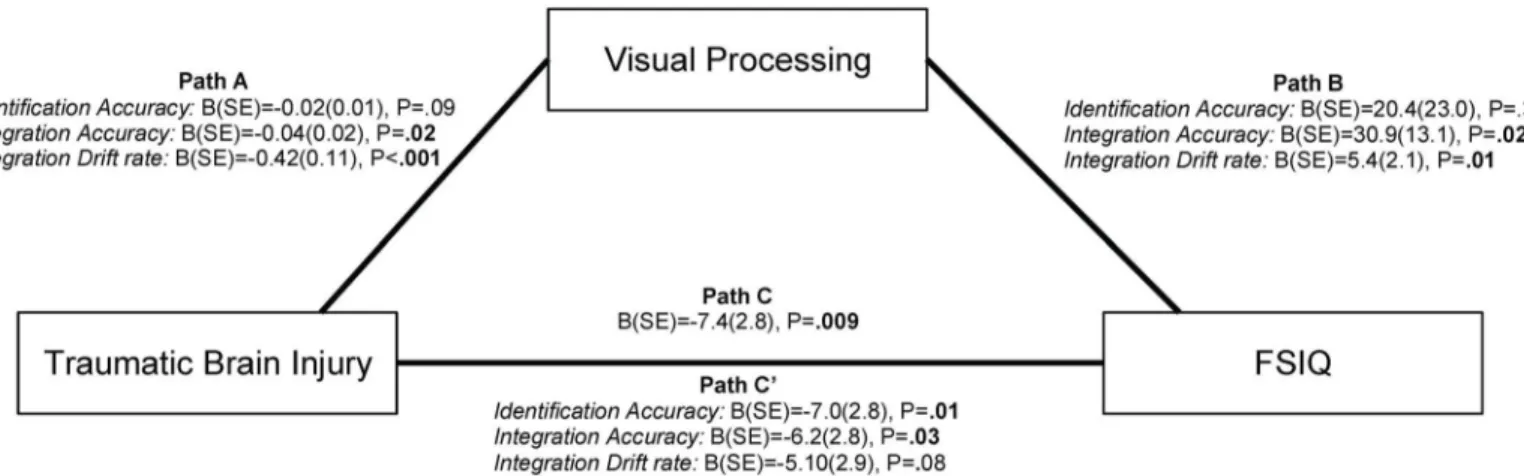
We included variables for which effects of TBI were observed (identification accuracy, integra-tion accuracy and integraintegra-tiondrift rate) in a mediation analysis to investigate the role of visual processing in the relation between TBI and general neurocognitive functioning, as measured by intelligence (FSIQ,Fig 3). As expected, membership of the TBI group (relative to member-ship of the TC group) was related to lower FSIQ (Path C). Likewise, membermember-ship of the TBI group was related to lower integration accuracy as well as lower integrationdrift rate(Path A). Lower integration accuracy and lower integrationdrift ratewere in turn related to lower FSIQ (Path B). Importantly, lower integration accuracy partially accounted for the relation between TBI and FSIQ (Path C’; z = -2.5, P = .01), while integrationdrift ratefully explained this rela-tionship (z = -3.1, P = .002). Together these findings suggest that impaired visual integration may contribute to intelligence impairments following TBI. Interestingly, identification accu-racy was not related to FSIQ (P = .38), emphasizing the specific role of impaired visual integra-tion in the relaintegra-tionship between TBI and intelligence.
Confounding analysis
Lower SES was observed in all TBI groups relative to the TC group. Visual Integration Test var-iables with obtained group differences were not related to SES (Ps.62), in contrast to FSIQ which showed a strong relationship with SES (r= .53, P<.001). To explore the role of SES in
the reported effects of mildRF+TBI and moderate/severe TBI on FSIQ, the mildRF+TBI and Table 3. Diffusion model analysis of visual identification and visual integration in the TBI and TC groups.
Groups Contrasts
TBI TC P Cohen’sd
n 103 44
Identification
Boundary separation, M (SD) 1.47 (0.42) 1.39 (0.37) .26 0.20
Drift rate, M (SD) 2.06 (0.97) 2.32 (0.87) .13 -0.28
Non-decision time, M (SD) 0.39 (0.12) 0.38 (0.12) .76 0.06
Integration
Boundary separation, M (SD) 1.66 (0.30) 1.68 (0.42) .68 -0.08
Drift rate, M (SD) 1.27 (0.56) 1.80 (0.96) <.001 -0.76
Non-decision time, M (SD) 0.52 (0.14) 0.50 (0.17) .43 0.14
Note. TBI = traumatic brain injury; TC = trauma control; MRT = mean reaction time;d= Cohen’s d.
moderate/severe TBI groups were combined and matched on SES to the TC group (1:1, ±1). The reported difference on FSIQ was replicated using the matched groups (S1 Table), indicat-ing that SES did not confound the reported results. Additionally, we excluded children with intracranial pathology or a psychiatric diagnosis from the mildRF+TBI group and replicated all reported group differences with the remaining group (S2 Table), with the single exception of the reported difference in visual identification accuracy. This finding indicates that intracranial pathology or psychiatric diagnoses did not account for the reported effects of mildRF+TBI on FSIQ and the accuracy anddrift rateof visual integration.
Discussion
This study investigated visual integration efficiency in a large sample of children with mild to severe TBI relative to children with trauma control injury. The results indicate that children with mildRF+TBI or moderate/severe TBI have impaired efficiency of visual integration, which was furthermore found to statistically explain intelligence impairments as observed in children with TBI. The findings from this study suggest that visual integration impairments may con-tribute to the detrimental effects of childhood TBI on general neurocognitive functioning, as measured by intelligence.
We hypothesized that impact of TBI on white matter integrity as described in the literature [7,8] would affect visual integration in children with TBI. To test visual integration in children with TBI, we developed the Visual Integration Test to measure the efficiency of visual identifi-cation, visual localization and the integration of these processes during goal-directed behavior. The results show that more severe TBI is related to increasingly lower accuracy of visual identi-fication and visual integration. More specifically, children with moderate/severe TBI have decreased accuracy of visual identification, while the accuracy of visual integration is decreased in children with mildRF+TBI and children with moderate/severe TBI. Application of the diffu-sion model allowed us to determine the contributions of task strategy (i.e.boundary separa-tion), efficiency of information processing (i.e.drift rate) and extra-decisional processes (i.e.
non-decision time, involving encoding and motor response execution) to task performance. Diffusion model analysis tracked down the impact of TBI severity on visual integration Fig 3. Mediation analysis investigating the roles of visual identification and visual integration in the relation between intelligence impairments and TBI.Note. The mediation analysis describes the relations between: (1) group membership and full-scale IQ (FSIQ, Path C); (2) group membership and Visual Integration Test performance (identification accuracy, integration accuracy and integrationdrift rate, Path A); (3) Visual Integration Test performance and FSIQ (Path B); and (4) group membership and FSIQ, corrected for Visual Integration Test performance (Path C’).
accuracy to impaired visual integrationdrift rate. More specifically, children with mildRF+TBI and children with moderate/severe TBI have impaired visual integrationdrift rate, reflecting decreased efficiency of information processing during visual integration. Some children in the mildRF+TBI group had intracranial pathology, which potentially could have accounted for the observed effects of mildRF+TBI. However, the reported results were replicated after exclusion of children with intracranial pathology, indicating that children with mild TBI and risk factors for complicated TBI are at risk of persisting visual integration deficits—even when evidence for intracranial pathology is absent.
Based on the premise that effective interaction with the environment relies on visual inte-gration to construct a full visual representation of our surroundings, we also hypothesized that impaired visual integration deficits would in turn affect general neurocognitive functioning. We found support for this hypothesis in mediation analyses showing that impaired visual inte-gration accuracy and visual inteinte-grationdrift ratewere related to intelligence in children with TBI. In fact, visual integrationdrift ratefully explained the observed intelligence impairments in children with TBI in statistical terms, while visual integration accuracy partly explained intelligence impairments. Importantly, visual identification accuracy was not related to intelli-gence, further emphasizing that specifically impaired visual integration (and not impaired identification) was related to intelligence after TBI. Although the results from the mediation model do not necessarily imply causal relationships, these findings suggest that impaired visual integration may importantly contribute to intelligence impairment after childhood TBI.
The results from this study indicating that children with TBI have visual integration deficits are in line with the scarcely available literature. One study showed that a small sample of adult patients with acquired brain injury (n= 13) had impaired spatial grouping of visual stimuli, thought to be caused by reduced integration of information in the visual cortex after axonal disruption [32]. A functional magnetic resonance imaging study further showed that an increased load on the integration of visual features in an attention task was associated with impaired task performance in a small sample of patients with diffuse axonal injury after TBI (n = 7) [33]. This impaired performance coincided with widespread increases in neural activa-tion, possibly reflecting recruitment of additional brain areas to compensate the detrimental effects of diffuse axonal injury on visual integration capacity. The results of current study fur-ther extend these findings by providing evidence supporting that visual integration impair-ments may contribute to intelligence impairimpair-ments in children with TBI. This finding is in line with the earlier reported vulnerability of visuospatial aspects of intelligence to the impact of TBI [13]. However, given the diffuse impact of TBI on white matter integrity, [3] we speculate that integration deficits may not be limited to the visual domain but may also apply to the inte-gration of sensory processes across modalities.
group. Last, the paradigm used had two potentially confounding factors: the visual integra-tion condiintegra-tion differed from the identificaintegra-tion and localizaintegra-tion condiintegra-tions in that (1) visual integration required to comply with two rules instead of one; and (2) visual integration involved shifting between compatible and incompatible responses. Consequently, potential TBI-induced deficits in working memory or set-shifting may have confounded the observed visual integration impairment. However, the TBI group and TC group showed no difference in working memory performance (S3 Table). Moreover, Schmitz & Voss [25] showed that the diffusion model captures set-shifting costs in thenon-decision timeparameter, rather than in thedrift rateparameter. In line with this finding, exploratory analyses revealed that
non-decision timewas larger in the integration condition than in the identification or locali-zation conditions (S4 Table; Ps<.001). Together with the described absence of an effect of
TBI onnon-decision timein the integration condition, these findings indicate that the observed effects of TBI on visual integration were not confounded by deficits in working memory or set-shifting.
In conclusion, the current study indicates that children with mildRF+TBI (even in the absence of intracranial pathology) and children with moderate/severe TBI have impaired effi-ciency of visual integration. These visual integration impairments were found to statistically explain the relation between TBI and impairments in general neurocognitive functioning, as measured by intelligence. We speculate that reduced white matter integrity may underlie the observed visual integration deficits in children with TBI [3] while impaired visual integration may in turn importantly contribute to intelligence impairments [5]. To our best knowledge, this is the first study attempting to isolate the effects of childhood TBI on visual integration in behavior and to explore the role of impaired visual integration in general neurocognitive func-tioning. The results of this study support the clinical importance of visual integration impair-ments after TBI in childhood.
Supporting Information
S1 Table. Replication of reported findings on FSIQ using the SES-matched TBI group.
Note. TBI = traumatic brain injury; TC = trauma control; FSIQ = full-scale intelligence quo-tient; M = mean; SD = standard deviation.
(DOCX)
S2 Table. Replication of reported findings on the mild RF+TBI group, while excluding children with intracranial injury or psychiatric conditions.Note. TBI = traumatic brain injury; TC = trauma control; FSIQ = full-scale intelligence quotient; M = mean; SD = standard deviation.
(DOCX)
S3 Table. Working memory in the TBI and TC groups.Note. TBI = traumatic brain injury; TC = trauma control; M = mean; SD = standard deviation.
aDigit Span score calculated as the number of correct responses multiplied by the maximum
correct span, in the forward and backward conditions separately (n = 2 missing data) according to Verburgh L, Scherder EJ a, van Lange P a M, Oosterlaan J. Executive functioning in highly talented soccer players. PLoS One. 2014;9: e91254.
(DOCX)
S4 Table. Non-decision time during the Visual Integration Test in the whole sample.Note. M = mean; SD = standard deviation.
Acknowledgments
We gratefully thank dr. J.A. van der Sluijs from the department of Pediatric Orthopedics (VU University Medical Centre Amsterdam) and dr. H.A. Heij of the Pediatric Surgical Center Amsterdam (VU University Medical Center and Academic Medical Center) for their assistance in the recruitment of participants for this study.
Author Contributions
Conceived and designed the experiments: MK JO. Performed the experiments: MK. Analyzed the data: MK WDW. Contributed reagents/materials/analysis tools: MK WDW LWEvH RJV JCG JSKL BTPT AB MvdW RJJKK CECB JO. Wrote the paper: MK WDW LWEvH RJV JCG JSKL BTPT AB MvdW RJJKK CECB JO.
References
1. Feigin VL, Theadom A, Barker-Collo S, Starkey NJ, McPherson K, Kahan M, et al. Incidence of trau-matic brain injury in New Zealand: a population-based study. Lancet Neurol. 2013; 12: 53–64. doi:10. 1016/S1474-4422(12)70262-4PMID:23177532
2. Winslade WJ, Brady JS. Confronting traumatic brain injury: Devastation, hope, and healing. Yale Uni-versity Press; 1999.
3. Sharp DJ, Scott G, Leech R. Network dysfunction after traumatic brain injury. Nat Rev Neurol. Nature Publishing Group, a division of Macmillan Publishers Limited. All Rights Reserved.; 2014; 10: 156–66. 4. Alwis DS, Johnstone V, Yan E, Rajan R. Diffuse traumatic brain injury and the sensory brain. Clin Exp
Pharmacol Physiol. 2013; 40: 473–83. doi:10.1111/1440-1681.12100PMID:23611812
5. Deary IJ. Human intelligence differences: towards a combined experimental—differential approach. Trends Cogn Sci. 2001; 5: 164–170. PMID:11287270
6. Bigler ED, Abildskov TJ, Petrie J, Farrer TJ, Dennis M, Simic N, et al. Heterogeneity of brain lesions in pediatric traumatic brain injury. Neuropsychology. 2013; 27: 438–51. doi:10.1037/a0032837PMID: 23876117
7. Roberts R, Mathias J, Rose S. Diffusion Tensor Imaging (DTI) Findings Following Pediatric Non-Pene-trating TBI: A Meta-Analysis. Dev Neuropsychol. 2014; 39: 600–637. doi:10.1080/87565641.2014. 973958PMID:25470224
8. Aoki Y, Inokuchi R, Gunshin M, Yahagi N, Suwa H. Diffusion tensor imaging studies of mild traumatic brain injury: a meta-analysis. J Neurol Neurosurg Psychiatry. 2012; 83: 870–6. doi: 10.1136/jnnp-2012-302742PMID:22797288
9. Park H, Friston K. Structural and functional brain networks: from connections to cognition. Science. 2013; 342: 579–587.
10. Damoiseaux JS, Greicius MD. Greater than the sum of its parts: a review of studies combining struc-tural connectivity and resting-state functional connectivity. Brain Struct Funct. 2009; 213: 525–33. doi: 10.1007/s00429-009-0208-6PMID:19565262
11. Varela F, Lachaux JP, Rodriguez E, Martinerie J. The brainweb: phase synchronization and large-scale integration. Nat Rev Neurosci. 2001; 2: 229–39. PMID:11283746
12. Young M. Objective analysis of the topological organization of the primate cortical visual system. Nature. 1992; 358: 152–155. PMID:1614547
13. Königs M, Engenhorst PJ, Oosterlaan J. Intelligence after traumatic brain injury: meta-analysis of out-comes and prognosis. Eur J Neurol. 2015;
14. Ginstfeldt T, Emanuelson I. An overview of attention deficits after paediatric traumatic brain injury. Brain Inj. 2010; 24: 1123–1134. doi:10.3109/02699052.2010.506853PMID:20715886
15. Catroppa C, Anderson V. Children’s attentional skills 5 years post-TBI. J Pediatr Psychol. 2007; 32: 354–369. PMID:16840790
16. Max J, Koele S, Jr WS. Psychiatric disorders in children and adolescents after severe traumatic brain injury: a controlled study. Child Adolesc Psychiatry. 1998; 37: 932–840.
17. Advanced Trauma Life Support Program for Doctors. American College of Surgeons; 7th edition; 2004.
19. Teasdale G, Jennett B. Assessment and prognosis of coma after head injury. Acta Neurochir (Wien). 1976; 34: 45–55.
20. Statistics Netherlands. Education Categorization Standard [Standaard onderwijsindeling 2006].www. cbs.nl. 2006.
21. Kaufman AS, Kaufman JC, Baijgopal R MJ. Comparison of three WISC-III short forms, weighing psy-chometric, clinical and practical factors. J Clin Child Psychol. 1996; 25: 97–105.
22. Ratcliff R. A theory of memory retrieval. Psychol Rev. 1978; 85: 59.
23. Wagenmakers E. Methodological and empirical developments for the Ratcliff diffusion model of response times and accuracy. Eur J Cogn Psychol. 2009; 21: 641–671.
24. Zeguers M, Snellings P. Specifying theories of developmental dyslexia: a diffusion model analysis of word recognition. Dev Sci. 2011; 14: 1340–1354. doi:10.1111/j.1467-7687.2011.01091.xPMID: 22010894
25. Schmitz F, Voss A. Decomposing task-switching costs with the diffusion model. J Exp Psychol Hum Percept Perform. 2012; 38: 222–250. doi:10.1037/a0026003PMID:22060144
26. Weeda W, Molen M van der. A diffusion model analysis of developmental changes in children’s task switching. J Exp Child Psychol. 2014; 126: 178–197. doi:10.1016/j.jecp.2014.05.001PMID:24945684
27. World Medical Association Declaration of Helsinki: ethical principles for medical research involving human subjects. JAMA. American Medical Association; 2013; 310: 2191–4.
28. Tabachnick BG, Fidell LS. Using Multivariate Statistics: International Edition. Pearson; 2012. 29. Voss A, Voss J. Fast-dm: A free program for efficient diffusion model analysis. Behav Res Methods.
2007; 39: 767–775. PMID:18183889
30. Voss A, Nagler M, Lerche V. Diffusion models in experimental psychology: A practical introduction. Exp Psychol. 2013; 60: 385–402. doi:10.1027/1618-3169/a000218PMID:23895923
31. Preacher KJ, Hayes AF. SPSS and SAS procedures for estimating indirect effects in simple mediation models. Behav Res Methods Instrum Comput. 2004; 36: 717–31. PMID:15641418
32. Kurylo DD, Larkin GB, Waxman R, Bukhari F. Speed of perceptual grouping in acquired brain injury. Exp brain Res. 2014; 232: 2899–905. doi:10.1007/s00221-014-3970-5PMID:24820289