Soil profile, relief features and their relation to structure and distribution of Brazilian
Frederico Augusto Guimarães Guilherme1,2, Tiago Osório Ferreira3, Marco Antonio Assis5, Pablo Vidal Torrado4, Leonor Patrícia Cerdeira Morellato5*
ABSTRACT: In tropical forests, the environmental heterogeneity can provide niche partition-ing at local scales and determine the diversity and plant species distribution. Thus, this study aimed to investigate the variations of tree species structure and distribution in response to relief and soil profile features in a portion of the largest remnant of Brazilian Atlantic rain forest. All trees ≥ 5 cm diameter at breast height were recorded in two 0.99 ha plots. Topographic survey and a soil characterization were accomplished in both plots. Topsoil samples (0-20 cm) were taken from 88 quadrats and analyzed for chemical and particle size properties. Differences for both diversity and tree density were identified among three kinds of soils. A canonical correspondence analysis (CCA) indicated that the specific abun-dance varied among the three kinds of soils mapped: a shallow Udept - Orthent / Aquent gradient, probably due to differences in soil drainage. Nutrient content was less likely to affect tree species composition and distribution than relief, pH, Al3+, and soil texture. Some species were randomly distributed and did not show restriction to relief and soil properties. However, preferences in niche occupation detected in this study, derived from the catenary environments found, rise up as an important explanation for the high tree species diversity in tropical forests.
Keywords: tropical rain forest, catena, tree diversity, niche partitioning, tropical soils
Atlantic rain forest trees
Received March 19, 2010 Accepted January 20, 2011
1UNESP – Programa de Pós-Graduação em Biologia Vegetal, Av. 24A, 1515 – 13506-900 – Rio Claro, SP – Brasil. 2UFG - Depto. de Ciências Biológicas – Campus Jataí, Rod. BR 364, km 192 – 75801-615 – Jataí, GO – Brasil.
3UFC – Depto. de Ciências do Solo, Av. Mister Hull, 2977 – 60021-970 – Fortaleza, CE – Brasil. 4USP/ESALQ – Depto. de Ciência do Solo, C.P. 09 – 13418-900 – Piracicaba, SP – Brasil. 5UNESP – Instituto de Biociências,
Depto. de Botânica, Laboratório de Fenologia, Av. 24A, 1515 – 13506-900 – Rio Claro, SP – Brasil. *Corresponding author <[email protected]>
Edited by: Luís Reynaldo Ferracciú Alleoni
Introduction
Plant species diversity is greatest in tropical forests (Wright, 2002) and increases when environmental contions vary spatially. Therefore, a higher plant species di-versity found on local scales may be a consequence of a remarkable local environmental-temporal heterogeneity. Environmental heterogeneity may be the result of climate variations, moisture gradient, relief and soil profile prop-erties (Svenning, 2001). The distribution of tree species frequently correlates with these environmental variables, and ecological niche differentiation might be important to maintain the diversity of tree species throughout the trop-ics (Valencia et al., 2004; Russo et al., 2005).
Oscillations on landform and slope may modify soil drainage and nutrient availability on local scales (Wright, 2002). This may interfere in the distribution and abundance of tree species in tropical forests (Clark et al., 1999; Russo et al., 2005). At short distances, the heterogeneity along an ecotone of a gallery-slope forest (also called catena) has been reported for other forests in Southeastern of Brazil (Oliveira Filho et al., 1994a; Sanchez et al., 1999; Botrel et al., 2002; Carvalho et al., 2005). Oliveira Filho and Fontes (2000), Scudeller et al. (2001) and Ferraz et al. (2004) have shown that rainfall, temperature and altitude play an important role on both distribution and abundance of the tree species from the Atlantic rain forest. However, studies of the plant species distribution and relief and edaphic properties through-out the Atlantic rain forest are scarce.
The Atlantic forest is a global biodiversity hotspot (Myers et al., 2000), highly endemic and one of the
larg-est biodiversity centers. Only 11 to 16 % of their original area is preserved (Ribeiro et al., 2009). Its remnants are vulnerable to several kinds of human intervention and constantly threatened. This study aimed to investigate tree species distribution and abundance based in en-vironmental heterogeneity along patches of one of the largest remnants of Atlantic rain forest, the Intervales State Park, a highly important conservation unit located on Southeastern Brazil. The Park comprises part of a steep mountainous landscape of the “Serra do Mar and “Serra de Paranapiacaba” mountain chains. We aimed to answer the following questions: (i) how does the tree community composition and structure vary in relation to landscape features and soil physical and chemical properties? and (ii) is there a niche partitioning related to a soil catena at the Atlantic rain forest?
Materials and Methods
the Atlantic mountain chain, in which there are vari-ous mountainvari-ous, erosive features with steep slopes and deep valleys that make up the edge of the Atlantic Crystalline Plateau. The Intervales State Park is located in the Atlantic Domain stricto sensu (Ab’ Saber, 1977) with altitudes ranging from 60 to 1,100 m, including the Lowland Atlantic rain forest (< 300 m), with a 30 m-high canopy, up to the Upper Montane Atlantic rain forest (> 1,100 m), with a 15 m-high canopy.
The Saibadela Base is located between 70-250 m altitude, mostly spread over the Lowland Atlantic rain forest. The most important anthropic interference is the illegal extraction of heart of palms from Euterpe
edulis palm trees. A total of 436 Angiosperm species
was reported in a floristic survey at Saibadela (Zipparro et al., 2005). Considering only tree species, Guilherme et al. (2004a) surveyed 172 species among 3,078 indi-viduals inside the same area sampled in the present study. Myrtaceae showed the greatest number of spe-cies (38) and individuals (745).
Two 0.99 ha (60 × 165 m) sampling plots of 44 contiguous quadrats (15 × 15 m) (Figure 1) were marked in the Lowland Atlantic rain forest (sensu Oliveira Filho and Fontes, 2000) and were kept at an approximate dis-tance of 1,500 m one from the other (Guilherme et al.,
2004a). The average altitude of Plot 1 was 120 m (range of 110-130 m), which was located perpendicularly and at a distance of 25 m away from the Saibadela riverbed. The Saibadela river is a ca. 15 m wide river with fast, shallow rocky water flow. Farther from the riverbed, the terrain becomes slightly steep and there is an increase on the soil drainage, except for a specific spot where there is a permanent groundwater spring at the central area of the plot. Plot 2 was located at a flatter area (86-97 m) with a bumper surface, away from watercourses and on well-drained soils. The plot configuration was adopted to evaluate the occurrence of environmental heterogeneity at short distance along an ecotone of the type gallery-slope forest (Plot 1), and to verify whether such heterogeneity exists far from watercourses (Plot 2). This heterogeneity has been reported for riparian forests within the Brazilian Central Plateau (Oliveira Filho et al., 1994a) and for the Atlantic forest along the riverbanks (Sanchez et al., 1999). All trees with a diameter at breast height ≥ 5 cm were sampled, identified and marked with numbered aluminum tags, and had their estimated total height registered. Vouchers of botanical materials were incorporated to the HRCB Herbarium. The complete list of the 172 species reported within the sample units was reported by Guilherme et al. (2004a).
Relief variations within both sampled plots were analyzed during topographic surveys by using a mea-sure tape and a clinometer. These data were used to generate a tridimensional representation with 1-m level curves for each plot (Figure 1). The slope variable was estimated for each of the 88 quadrats from the differ-ence between the maximum and minimum values that had been reported at the vertices of each quadrat.
Samples for description of the soil morphology were collected at four different depths (0-20, 20-40 cm and 40-60 or 60-80 cm when possible) along those paths, inside plots, where soil color, soil texture and relief were markedly variant. Soil chemical and physical analyses (only for the 0-20 cm samples) were carried out using standard methods (EMBRAPA, 1997). Soil samples were analyzed for pH in water; extractable P, exchangeable bases [K+, Ca2+, Mg2+ and Na+] and sum of bases [SB =
K+ + Na+ + Ca2+ + Mg2+]; base saturation (V%); cation
exchangeable capacity (CEC); organic matter (MO), and content of sand, silt and clay. Soils were tentatively classi-fied according to Soil Taxonomy (Soil Survey Staff, 1999, 2010) as Aquent (poorly drained soil), Orthent (shallow soil) and Udept (moderately developed soil) (Figure 1).
Topsoil variables and their slope, as well as tree density and basal area, were compared among the three kinds of soil taken in each of the 88 quadrats by using ANOVA followed by Tukey-Kramer tests for significant differences (Zar, 1996). Shannon’s diversity index was calculated for each kind of soil and values were com-pared in pairs with Hutcheson’s t test (Zar, 1996). To avoid the problem of different sampling intensities among indexes comparisons, five quadrats for the shal-low and moderately developed soils (Orthent and Udept, Figure 1 – Kinds of soil (Orthent - shallow soil, Aquent - poorly drained
respectively) were randomly chosen. This number cor-responded to the total amount of quadrats found for the poorly drained soil (Aquent). We used χ2 tests to evaluate
the distribution of the species abundance in each kind of soil. By considering that survey in contiguous quadrats do not make up independent samples, the statistical tests applied in the present study were used as a mean of highlighting differences and evidencing patterns.
The canonical correspondence analysis (CCA) was performed to determine correlations between the abundance of species and the environmental variables using PC-ORD package (McCune and Mefford, 1999). The species abundance matrix made up the number of individuals by quadrat of the species that had more than 13 individuals, and generated a matrix with 48 species (28 % of the total) and 88 quadrats. The less abundant species were eliminated when they offered little contri-bution to the ordination and increased the amount of calculation to be done. In a preliminary CCA, the en-vironment matrix included all of the topsoil variables and slope (14 variables cited above). In the analysis, we eliminated self-redundant variables or those that had lit-tle correlation with the first two ordination axes (< 0.4). After that only six variables (clay, pH, V, sand, Al3+ and
slope) remained. A Monte Carlo permutation test was performed to assess the significance of the correlations between the overall species abundance distributions and environmental variables. The three kinds of soil were discriminated on quadrat ordination diagrams to facili-tate interpretation of emergent patterns. Pearson’s cor-relation coefficients were calculated (Zar, 1996) in order to confirm the consistency of the distribution patterns of the species evidenced with the CCA. To normalize the frequencies distribution, environmental variables were modified by arcsin (x½), and the others were log-trans-formed before analyses.
Results
Soil atributes and slope
Three soils were identified in the studied site (Fig-ure 1). The first was tentatively classified as an Orthent, a shallow, moderately-well drained soil with a clay-loam texture, a low base saturation (dystrophic) and a lithic contact within 50 cm depth. Six quadrats under this soil were sampled in Plot 1. This soil had a rela-tively high content of rock fragments and a low vulner-ability to flooding, except when occasional overflow oc-curs, especially at lower areas near the Saibadela river. The second is a poorly drained, clay-loamy, dystrophic, and tentatively classified as an Aquent. These are very poorly drained soils that have dominantly gleyed colors close to the surface and that occur in depressions along five quadrats in Plot 1. The third and predominant soil is a clay loam to clay soil, moderately developed, mod-erately-well drained, shallow, low activity clay, tenta-tively classified as an Udept. This soil was sampled in 33 quadrats in Plot 1 and throughout Plot 2.
In general, the three soils are very acid (pH ∼ 4.0), had a high value of exchangeable Al (aluminum satu-ration > 50 %), and low base satusatu-ration (V < 14 %) due to the low content of exchangeable K+, Ca2+ and
Mg2+ evidencing a dominance of nutrient-poor soils.
However, soils differed for 11 out of the 14 compared attributes (Table 1). Differences were observed mainly between the shallow and moderately developed soils, and less noticeable between the shallow and poorly drained soils. The latter had higher pH values, higher Ca2+ contents, sum of bases and sand content, as well as
lower values of Al3+ and clay content when compared
to moderately developed soil. Contents of exchangeable K+ and Mg2+ were higher in the shallow soil and lower
in the moderately developed soil, whereas base
satu-Table 1 – Topographic and soil variables in 88 quadrats (0-20 cm deep) on the Atlantic rain forest survey, SE Brazil. Values are means ± standard deviation of the N samples of each of the three kinds of soil. Means followed by letters are different (Tukey-Kramer tests, p < 0.05). *p < 0.05; **p < 0.01; ***p < 0.001; ns: non-significant.
Environmental variables
ANOVAS Soils
F(2,85) p
Shallow Poorly Drained Moderately developed
N = 6 N = 5 N = 77
Slope (m) 6.0 ** 3.9 ± 1.3 a 1.6 ± 0.7 b 2.1 ± 1.3 b
pH in H2O 40.8 *** 4.5 ± 0.2 a 4.4 ± 0.3 a 3.9 ± 0.2 b
P (mg kg–1) 3.0 ns 5.5 ± 1.6 6.8 ± 1.6 4.4 ± 2.3
K+ (mmolc kg–1) 8.9 *** 2.1 ± 0.3 a 1.5 ± 0.4 ab 1.4 ± 0.4 b
Ca2+ (mmolc kg–1) 25.7 *** 4.5 ± 3.3 a 3.4 ± 2.9 a 1.3 ± 0.7 b
Mg2+ (mmolc kg–1) 4.2 * 4.0 ± 1.4 a 3.0 ± 1.0 ab 2.9 ± 0.9 b
Sum of bases (mmolc kg–1) 21.7 *** 11.3 ± 4.2 a 8.6 ± 4.0 a 6.0 ± 1.6 b
Al3+ (mmolc kg–1) 25.5 *** 19.0 ± 6.5 b 18.4 ± 5.9 b 30.3 ± 4.9 a
CEC (mmolc kg–1) 6.0 ** 82.6 ± 17.0 b 87.2 ± 12.0 ab 104.7 ± 18.5 a
Base saturation (%) 47.4 *** 13.7 ± 4.9 a 9.8 ± 3.6 b 5.8 ± 1.6 c
Organic matter (g kg–1) 1.1 ns 36.8 ± 10.5 45.4 ± 7.3 46.6 ± 16.6
Sand (%) 39.5 *** 51.2 ± 6.0 a 53.0 ± 8.6 a 39.0 ± 4.1 b
Silt (%) 0.1 ns 22.8 ± 5.4 23.2 ± 3.2 22.5 ± 3.5
ration was different among the three soils, decreasing in the following order shallow – poorly drained- mod-erately developed. CEC was higher in the modmod-erately developed soil and lower in the shallow one.
Tree community diversity and structure
The diversity index was higher in the moderately developed soil than in the shallow one (Table 2). These results may be related to a great species number and a higher tree density in the first than in latter kind of soil (Table 3). The shallow soil had a low value of equabil-ity and concentrated many individuals into few species,
mainly Euterpe edulis, Alsophila sternbergii and Eugenia
cambucarana with 68 % of the grand total of individuals
(Table 4). The tree’s basal area was not different for the tree kind of soils (Table 3).
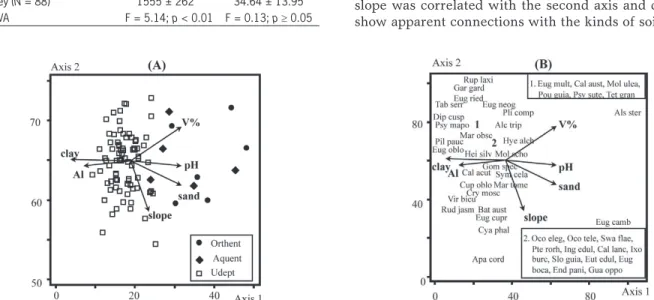
CCA eigenvalues for the first two ordination axes remained below 0.5 (0.23: axis 1; 0.06: axis 2), and point-ed out the existence of short gradients, i.e. most species spread over throughout the gradient. Specific accumu-lated variance values were low, both for axis 1 (10.7 %) and axis 2 (2.8 %), and those determined an accumulated total of 13.5 %. Although results suggests either ‘noise’ or non-explained remaining variance in ordination, the significance of the correlations between species and en-vironmental variables was not affected, once CCA gen-erated high species-environment correlation in the first two axes (0.76: axis 1; 0.73: axis 2). Moreover, the Monte Carlo permutation test suggested a significant correlation between species abundance and environmental variables with p
<
0.05 for both axes. The first axis was positively correlated with pH, base saturation and sand content, and negatively correlated to clay content and Al3+ saturation(Table 5). The second CCA axis was negatively correlated to landscape slope. Variables had strong pondered correla-tions, and it must be highlighted the positive correlations between base saturation and pH, and between sand and pH, and negative correlations between Al3+ and pH, and
between Al3+ and base saturation.
The quadrats ordination in the first axis clearly differentiated two groups (Figure 2a), and revealed a gradient between the moderately developed soil on the left and the shallow and the poorly drained soils on the right of the diagram. Correlations between variables were well defined and the gradient from left to right, showed increasing pH, base saturation and sand con-tents, and a decreasing Al3+ and clay contents. The soil
slope was correlated with the second axis and did not show apparent connections with the kinds of soil. Table 2 – Number of individuals (NI) and species (spp) reported,
Shannon diversity (H’) and Pielou evenness index (J’) for the three soils in the Atlantic rain forest, SE Brazil. Different letters designate differences (t tests for H’, p < 0.05).
Soils NI spp H’ J’
nat. ind–1
Shallow (N = 5) 148 45 2,678 c 0.703
Poorly drained (N = 5) 153 46 3,450 b 0.874 Moderately developed (N = 5) 188 68 3,651 a 0.865
Survey (N = 88) 3078 172 3,850 0.746
Table 3 – Density and tree basal area by hectare within for the three kinds of soil in the Atlantic rain forest, SE Brazil. Values are means ± standard deviation of the N samples of the three kinds of soil and total survey. Means followed by letters are different (Tukey-Kramer tests, p < 0.05) when ANOVA suggested differences.
Soils Density Basal area
trees ha-1 m2 ha–1 Shallow (N = 6) 1304 ± 262 b 33.31 ± 15.60 Poorly drained (N = 5) 1360 ± 247 ab 37.48 ± 17.79 Moderately developed (N = 77) 1587 ± 250 a 34,57 ± 13.76 Survey (N = 88) 1555 ± 262 34.64 ± 13.95 ANOVA F = 5.14; p < 0.01 F = 0.13; p≥ 0.05
Table 4 – Abundance distribution of the 48 species analyzed in CCA for the three kinds of soil in the Atlantic rain forest, SE Brazil, shown in descending order of individual number. χ2 tests the null hypothesis that distribution is independent of the kinds of soil. The values of species with different distribution are written in bold, followed by either positive (+) or negative (-) signs to designate abundance above or below the expected, respectively, regarding the total amount of individuals in the survey. Abbreviated names identify species in Figure 2B.
Species Family Abbreviated names
Number of individuals
Shallow Poorly drained Moderately developed p
Euterpe edulis Arecaceae Eut edul 41 16 - 614 < 0.005
Guapira opposita Nyctaginaceae Gua oppo 1 - 10 161 < 0.01
Garcinia gardneriana Clusiaceae Gar gard 0 - 3 114 < 0.05
Eugenia mosenii Myrtaceae Eug mose 1 6 107 ns
Bathysa australis Rubiaceae Bat aust 5 12 + 83 < 0.025
Psychotria suterella Rubiaceae Psy sute 0 3 92 ns
Marlierea obscura Myrtaceae Mar obsc 2 5 87 ns
Sloanea guianensis Elaeocarpaceae Slo guia 6 1 86 ns
Marlierea tomentosa Myrtaceae Mar tome 2 13 + 63 < 0.001
Mollinedia schottiana Monimiaceae Mol scho 1 3 62 ns
Alsophila sternbergii Cyatheaceae Als ster 51 + 12 + 1 - < 0.001
Cyathea phalerata Cyatheaceae Cya phal 0 12 + 42 < 0.001
Eugenia cuprea Myrtaceae Eug cupr 5 1 45 ns
Ixora burchelliana Rubiaceae Ixo burc 2 4 41 ns
Tetrastilidium grandifolium Olacaceae Tet gran 1 1 44 ns
Eugenia neoglomerata Myrtaceae Eug neog 0 4 41 ns
Eugenia oblongata Myrtaceae Eug oblo 1 0 42 ns
Calycorectes australis Myrtaceae Cal aust 2 1 38 ns
Ocotea teleiandra Lauraceae Oco tele 1 3 35 ns
Eugenia riedeliana Myrtaceae Eug ried 0 0 34 ns
Eugenia bocainensis Myrtaceae Eug boca 0 3 27 ns
Calycorectes acutatus Myrtaceae Cal acut 0 0 29 ns
Aparisthmium cordatum Euphorbiaceae Apa cord 0 1 26 ns
Alchornea triplinervea Euphorbiaceae Alc trip 0 4 21 ns
Virola bicuhyba Myristicaceae Vir bicu 0 0 24 ns
Swartzia flaemingii Fabaceae Swa flae 2 2 19 ns
Heisteria silvianii Olacaceae Hei silv 0 0 22 ns
Pourouma guianensis Urticaceae Pou guia 0 3 19 ns
Mollinedia uleana Monimiaceae Mol ulea 0 0 21 ns
Pterocarpus rorhii Fabaceae Pte rorh 1 1 19 ns
Tabebuia serratifolia Bignoniaceae Tab serr 0 1 20 ns
Calyptranthes lanceolata Myrtaceae Cal lanc 1 2 17 ns
Endlicheria paniculata Lauraceae End pani 0 4 + 16 < 0.05
Gomidesia spectabilis Myrtaceae Gom spec 1 0 19 ns
Ocotea elegans Lauraceae Oco eleg 1 0 17 ns
Psychotria mapoureoides Rubiaceae Psy mapo 0 0 18 ns
Ruprechtia laxiflora Polygonaceae Rup laxi 0 1 17 ns
Hyeronima alchorneoides Phyllanthaceae Hye alch 1 0 16 ns
Pilocarpus pauciflorus Rutaceae Pil pauc 0 0 17 ns
Inga edulis Fabaceae Ing edul 0 1 14 ns
Eugenia multicostata Myrtaceae Eug mult 0 0 14 ns
Rudgea jasminoides Rubiaceae Rud jasm 0 0 14 ns
Symplocos cf. celastrinea Symplocaceae Sym cela 2 0 12 ns
Cryptocaria moschata Lauraceae Cry mosc 2 0 11 ns
Cupania oblongifolia Sapindaceae Cup oblo 0 0 13 ns
Diploon cuspidatum Sapotaceae Dip cusp 0 0 13 ns
Eugenia cambucarana Myrtaceae Eug camb 8 + 0 5 < 0.001
The ordination suggests that most species are more abundant in the moderately developed soil (Figure 2b), whereas few species, such as Alsophila sternbergii and
Eugenia cambucarana, are strictly related to the adjacent
areas of the river and local depressions, as it happens at the shallow and poorly drained soil sites. Aparisthmium cordatum seemed to be associate with the soil slope in the ordination, and it was more abundant along steeper patches (r = 0.24, p < 0.05).
Some species spread under intermediate or indif-ferent conditions along the gradient (Figure 2b), and did not correlate with the environmental variables. From a total of 48 analyzed species, 22 (46 %) have presented sig-nificant correlations with at least one of the six variables. Clay was the variable that most strongly correlated with the first CCA, generating 12 significant correlations fol-lowed by sand and slope within each quadrat (10 each). Four out of the eight species that had an increase on the abundance with higher clay proportions had a decrease in abundance as sand contents increased. On the other hand, four out of the five species that had an increase on the number of individuals with increasing sand contents showed a decrease in abundance with higher clay con-tents. Five species reduced and other five increased their abundance with high declivities.
Marlierea obscura and Garcinia gardneriana (both with r = - 0.22, p < 0.05) were associated with the in-crease of soil acidity, whereas Eugenia bocainensis had an inverse association (r = 0.23, p < 0.05). Eugenia mosenii (r
= 0.27, p < 0.05) was significantly associated with higher Al3+ concentrations. Euterpe edulis and Ixora burchelliana
increased their abundance with an increase in soil acid-ity (r = -0.27, p < 0.05; r = -0.26, p < 0.05, respectively) and Al3+ (r = 0.29, p < 0.01; r = 0.24, p < 0.05,
respec-tively). E. edulis was significantly less abundant at the site of the poorly drained soil (Table 4). Alsophila sternbergii,
Eugenia cambucarana and Marlierea tomentosa showed a
reverse association and occurred mostly at shallow and poorly drained soils. A. sternbergii (r = 0.57, p < 0.001) and E. cambucarana (r = 0.24, p < 0.05) were also more abundant at higher base saturation (shallow soil; Tables 1 and 3). Finally, Guapira opposita and G. gardneriana were less abundant at the shallow soil sites, whereas Bathysa
australis and Endlicheria paniculata had a higher number
of individuals at poorly drained soil sites (Table 4).
Discussion
The irregular relief, with steep edges at Saibadela Base, favors the occurrence of shallow soils, mainly rep-resented by the tentatively classified Orthent and Udept. The high local rainfall (~ 4,000 mm per year) associated with such landscape conditions increase soil erosion vulnerability and also the nutrients loss by both leach-ing and water erosion. The water availability through-out the whole year, however, supports the existence of such exuberant vegetation on poor soils, once most of its nutrients are made available through mineralization of organic matter (Kitayama and Aiba, 2002). The occur-rence of acid and nutrient-poor soils has been system-atically described along the Atlantic rain forest (Leitão Filho, 1993). Well drained soils, such as the moderately developed one, are usually more strongly leached and acid than those less drained, such as the poorly drained soil and the shallow soil under study. However, the high soil acidity and Al3+ saturation were not limiting to the
structural development of vegetation at well drained and moderately developed soil, as previously reported by Leitão Filho (1993).
Close to the margin of Saibadela River, the shallow soils have a coarser texture and are highly vulnerable to flooding. These soils may have been originated dur-ing the periodical deposition of sediments by the river which might also explain the differential distribution of the two species in the present study: Alsophila sternber-gii, an arborescent fern which is frequently found along gallery forests at the Brazilian Central Plateau (Oliveira Filho et al., 1994b) and Eugenia cambucarana. Eugenia
genus is widely spread throughout neotropical forests, but its species are frequently found in wetlands and depressions close to water courses, such as E. inundata
(Ferreira and Stohlgren, 1999) and E. neomyrtifolia (Guil-herme et al., 2004b). This characteristic highlights the high functional groups of plant species richness in terms of specific niche differentiation.
Other species were clearly associated with the poorly drained soil, and may have adaptative features to tolerate flooding conditions. Although reported with only one individual in the phytosociological survey due to its small size (Guilherme et al., 2004a), the shrub species Piper aduncum is very abundant on the poorly Table 5 – Internal correlations (‘intraset’) between the environmental variables and the first two ordination axes, and correlations matrix for the
environmental variables used in CCA. Correlation with absolute values > 0.5 are written in bold.
Environmental variables Intraset Clay pH V Sand Al3+
Axis 1 Axis 2
Clay - 0.84 0.03 __
pH 0.76 - 0.08 - 0.62 __
V 0.74 0.40 - 0.50 0.65 __
Sand 0.71 - 0.34 - 0.85 0.64 0.51 __
Al3+ - 0.70 - 0.05 0.62 - 0.84 - 0.70 - 0.55 __
drained soil, with extensive entangled nets along such soil patches, suggesting vegetative reproduction (F.A.G. Guilherme, pers. obs.). The two arborescent ferns
Cy-athea phalerata and Alsophila sternbergii were also
abun-dant on these hydromorphic soils. According to Brade (1971), A. sternbergii has stolon roots, which favor its vegetative propagation and explain its significantly clus-tered spatial distribution. Thus, soil drainage conditions observed in this study would favor the establishment of species with this reproductive feature. The occurrence of sprouting has been detected as an important charac-teristic of canopy Atlantic rain forest trees on periodic flooded soils (Negrelle, 1995) and also on other tropical forests (Paciorek et al., 2000).
Lower species richness, diversity and tree num-ber were also found at the shallow and poorly drained soil sites. During periodical flooding, individuals should probably be adapted to the higher environmental insta-bility caused by hypoxia (Duivenvoorden, 1996) and sed-iment deposition. The complex fluvial processes favor disturbances and change the tree community structure along forest patches close to water courses (Junk, 1990). Although conditions found in wetlands environments fa-vor a lower diversity, the present study registered some exclusive species in those areas, such as Eugenia cambu-carana, Cyathea phalerata and Alsophila sternbergii. This highlights a selection pressure on the niche occupation and reinforces the importance of preserving such patch-es to maintain the specipatch-es diversity.
Plot 1 was characterized by its proximity to the Saibadela riverbed towards the well drained forest patches associated with both soil profile and relief gra-dients. This suggests a catenary situation with the pres-ence of an ecotone of the type gallery-slope forest, as already detected on other tropical semi deciduous for-ests in Brazil (Botrel et al., 2002; Carvalho et al., 2005). Thus, landscape features are certainly associated with the three kinds of soils which are conditioning changes on physical and chemical soil properties. This also sug-gests a higher environmental heterogeneity when com-pared to Plot 2, which was exclusively dominated by the moderately developed soil. Relief variation has been considered the most important abiotic factor responsible for environmental changes and, consequently, on tree community structure of tropical forests within the At-lantic Domain at local scales (Berg and Oliveira Filho, 1999). The slightly higher number of species in Plot 1 (140) when compared to Plot 2 (134), also reported by Guilherme et al. (2004a), probably reflects an ecotonal feature between valley-back patches and well drained slopes, and suggests that more heterogeneous environ-ments generate an increase on diversity. Previous stud-ies in tropical forests have correlated between plant spe-cies and edaphic parameters (Clark et al., 1999; Valencia et al., 2004), emphasizing the relation of non-randomly specific distribution with environmental conditions.
The CCA ordination diagram separated the specific abundance distribution on the shallow and poorly drained
soils from the moderately developed soil. The similar pat-tern was evidenced in an detrended correspondence anal-ysis (DCA) performed in the same sample units, where some quadrats on the poorly drained soil and mainly on the shallow one were well delimited in relation to the quadrats on the moderately developed soil (Guilherme et al., 2004a). This reinforces the occurrence of environ-mental heterogeneity in Plot 1, even in contiguous survey, where chances to detect ecotones are lower.
Strong correlations with texture, soil acidity and Al3+ saturation were also found in the CCA ordination.
Once soils within the Saibadela Base are nutrient poor, we suggest that the non-randomly distribution of some species occurs predominantly in terms of texture class-es, pH and Al3+, possibly associated with soil drainage,
whereas nutrient requisites would be a less preponder-ant factor over species distribution. Physical properties of soils, especially those related to soil drainage, which is affected by relief, seem to play a more important role in plant species composition than chemical properties (Sol-lins, 1998). Conversely, many important species in this survey showed no relation with relief and soil properties, such Euterpe edulis, Guapira opposita, Garcinia gardneri-ana, Psychotria suterella, Marlierea obscura, Eugenia cu-prea, E. neoglomerata, E. oblongata, Calycorectes autralis
and Alchornea triplinervea, which encompassed 40 % of tree density found in the survey (Guilherme et al., 2004a). Hereafter, there was a restriction by the high acidity and Al3+ saturation, which are common characteristics of
tropical Lowland Forest soils. The above cited species and other 13 abundant ones are reported in a checklist of the 60 tree species more abundant and widespread along the Lowland Atlantic rain forest in Southeastern Brazil (Scudeller et al., 2001). Probably, such species have wide tolerance to various environmental conditions, which was evidenced in our study by the lack of correlation with the analyzed variables. We suggest that other non-evaluated environmental factors, such as soil micronutrients, sto-chastic events and possibly biological features, such as pathogen, herbivore attacks and seed dispersal ecology, are also important to explain the patterns of tree species distribution and abundance. A nonrandom spatial distri-bution is described for many tropical forest tree species related to edaphic features when analyzed at the land-scape scale (Clark et al., 1999).
Acknowledgements
To the Instituto Florestal and Fundação Florestal for the permission to work in the Park and logistic sup-port; to Levi Carina Terribile for help with illustrations; to FAPESP (proc. # 95/9626-0) for the financial support; to UNESP Prope funds for supporting the English ver-sion; to CNPq for the Research Productivity fellowship to F.A.G.G. and L.P.C.M.; CAPES for the doctor’s degree scholarship to F.A.G.G - Programa de Pós-graduação em Biologia Vegetal – UNESP Rio Claro.
References
Ab’ Saber, A.N. 1977. The morphoclimatic domains of South America: first approximation. Geomorfologia 52: 1-21. (in Portuguese, with abstract in English).
Botrel, R.T.; Oliveira Filho, A.T.; Rodrigues, L.A.; Curi, N. 2002. Influence of soils and topography on the variations of species composition and structure of the community of trees and shrubs of a tropical semideciduous forest in Ingaí, southeastern Brazil. Revista Brasileira de Botânica 25: 195-213. (in Portuguese, with abstract in English).
Brade, A.C. 1971. Cyathea sampaioana Brade et Ros. only one ‘form’ of Cyathea sternbergii Pohl. Bradea 1: 73-76. (in Portuguese, with abstract in English).
Carvalho, D.A.; Oliveira Filho, A.T.; Vilela, E.A.; Curi, N; Van Den Berg, E.; Fontes, M.A.L.; Botezelli, L. 2005. Distribution of tree and shrub species along a gradient of soils and topography in a strip of riparian Forest of the São Francisco River in Três Marias, MG, Brazil. Revista Brasileira de Botânica 28: 329-345. (in Portuguese, with abstract in English).
Clark, D.B.; Palmer, M.W.; Clark, D.A. 1999. Edaphic factors and the landscape-scale distributions of tropical rain forest trees. Ecology 80: 2662-75.
Duivenvoorden, J.F. 1996. Patterns of tree species richness in rain forests of the middle Caquetá area, Colombia, NW Amazônia. Biotropica 28: 142-158.
Empresa Brasileira de Pesquisa Agropecuária [EMBRAPA]. 1997. Manual of Methods of Soil Analysis. 2 ed. Embrapa-CNPS, Rio de Janeiro, RJ, Brazil. (in Portuguese)
Ferraz, E.M.N.; Araújo, E.L.; Silva, S.I. 2004. Floristic similarities between lowland and montane areas of Atlantic Coastal Forest in Northeastern Brazil. Plant Ecology 174: 59-70.
Ferreira, L.V.; Stohlgren, T.J. 1999. Effects of river level fluctuation on plant species richness, diversity, and distribution in a floodplain forest in Central Amazonia. Oecologia 120: 582-587.
Guilherme, F.A.G.; Morellato, L.P.C.; Assis, M.A. 2004a. Horizontal and vertical tree community structure in a lowland Atlantic rain forest, Southeastern Brazil. Revista Brasileira de Botânica 27: 725-737.
Guilherme, F.A.G.; Oliveira Filho, A.T.; Appolinário, V.; Bearzoti, E. 2004b. Effects of flooding regimes and woody bamboos on tree community dynamics in a section of tropical semideciduous forest in South-Eastern Brazil. Plant Ecology 174: 19-36.
Kitayama, K.; Aiba, S.I. 2002. Ecosystem structure and productivity of tropical rain forests along altitudinal gradients with contrasting soil phosphorus pools on Mount Kinabalu, Borneo. Journal of Ecology 90: 37-51.
Junk, W.J. 1990. Flood tolerance and tree distribution in central Amazonian floodplains. p. 47-64. In: Holm-Nielsen, L.B.; Nielsen, I.C.; Balslev, H., eds. Tropical Forests: Botanical Dynamics, Speciation and Diversity. Academic Press, London, England.
Leitão Filho, H.F. 1993. Atlantic Rainforest Ecology in Cubatão. Editora UNESP, São Paulo, SP, Brazil. (in Portuguese). McCune, B.; Mefford, M.J. 1999. Multivariate Analysis of
Ecological Data. MjM Software Design, Gleneden Beach, OR, USA.
Morellato, L.P.C.; Talora, D.C.; Takahasi, A.; Bencke, C.C.; Romera, E.C.; Zipparro, V.B. 2000. Phenology of Atlantic rain forest trees: a comparative study. Biotropica 32: 811-823. Myers, N.; Mittermeier, R.A.; Mittermeier, C.G.; Fonseca,
G.A.B.; Kent, J. 2000. Biodiversity hotspots for conservation priorities. Nature 403: 853-858.
Negrelle, R.B. 1995. Sprouting after uprooting of canopy trees in the Atlantic rain forest of Brazil. Biotropica 27: 448-454. Oliveira Filho, A.T.; Fontes, M.A.L. 2000. Patterns of floristic
differentiation among Atlantic Forests in Southeastern Brazil, and the influence of climate. Biotropica 32: 793-810.
Oliveira Filho, A.T.; Vilela, E.A.; Carvalho, D.A.; Gavilanes, M.L. 1994a. Differentiation of streamside and upland vegetation in an area of montane semideciduous forest in Southeastern Brazil. Flora 189: 287-305.
Oliveira Filho, A.T.; Almeida, R.J.; Mello, J.M.; Gavilanes, M.L. 1994b. Phytosociological structure and environmental variables in a section of riparian forest in the Biological Reserve of Poço Bonito, Lavras, Minas Gerais, Brazil. Revista Brasileira de Botânica 17: 67-85. (in Portuguese, with abstract in English).
Paciorek, C.J.; Condit, R.; Hubbell, S.P.; Foster, R.B. 2000. The demographics of resprouting in tree and shrub species of a moist tropical forest. Journal of Ecology 88: 765-777. Ribeiro, M.C.; Metzger, J.P.; Martensen, A.C.; Ponzoni, F.J.;
Hirota, M.M. 2009. The Brazilian Atlantic forest: how much is left, and how is the remaining forest distributed? Implications for conservation. Biological Conservation 142: 1141-1153.
Russo, S.E.; Davies, S.J.; King, D.A.; Tan, S. 2005. Soil-related performance variation and distributions of tree species in a Bornean rain forest. Journal of Ecology 93: 879-889. Sanchez, M.; Pedroni, F.; Leitão Filho, H.F.; César, O. 1999.
Floristic composition of a riverine forest in the Brazilian Atlantic rain forest, Ubatuba, SP. Revista Brasileira de Botânica 22: 31-42. (in Portuguese, with abstract in English).
Scudeller, V.V.; Martins, F.R.; Shepherd, G.J. 2001. Distribution and abundance of arboreal species in the Atlantic ombrophilous dense forest in Southeastern Brazil. Plant Ecology 152: 185-199.
Soil Survey Staff. 1999. Soil Taxonomy. A basic system of soil classification for making and interpreting soil surveys. 2 ed. Handbook 436. USDA-SCS, Washington, DC, USA. Sollins, P. 1998. Factors influencing species composition in
tropical lowland rain forest: does soil matter? Ecology 79: 23-30.
Svenning, J.C. 2001. On the role of microenvironmental heterogeneity in the ecology and diversification of neotropical rain forest palms (Arecaceae). The Botanical Review 67: 1-53.
Valencia, R.; Foster, R.B.; Villa, G.; Condit, R.; Svenning, J.C.; Hernández, C.; Romoleroux, K.; Losos, E.; Magard, E.; Balslev, H. 2004. Tree species distributions and local habitat variation in the Amazon: large forest plot in Eastern Ecuador. Journal of Ecology 92: 214-229.
Berg. van den, E.; Oliveira Filho, A.T. 1999. Spatial partitioning among tree species within an area of tropical montane gallery forest in south-eastern Brazil. Flora 194: 249-266. Wright, S.J. 2002. Plant diversity in tropical forests: a review of
mechanisms of species coexistence. Oecologia 130: 1-14. Zar, J.H. 1996. Biostatistical Analysis. Prentice Hall, Upper
Saddle River, NJ, USA.