www.biogeosciences.net/10/4179/2013/ doi:10.5194/bg-10-4179-2013
© Author(s) 2013. CC Attribution 3.0 License.
Biogeosciences
Geoscientiic
Geoscientiic
Geoscientiic
Geoscientiic
Nitrous oxide emissions from soil of an African rain forest in Ghana
S. Castaldi1,2, T. Bertolini2, A. Valente1, T. Chiti2, and R. Valentini2,3 1DISAFRI, Seconda Universit`a di Napoli, via Vivaldi 43, 81100 Caserta, Italy
2EuroMediterranean Centre for Climate Change, via Augusto Imperatore 16, 73100, Lecce, Italy
3Department for Innovation in Biological, Agro-food and Forest Systems, University of Tuscia, via S. Camillo de Lellis, 01100 Viterbo, Italy
Correspondence to:S. Castaldi (simona.castaldi@unina2.it)
Received: 16 October 2012 – Published in Biogeosciences Discuss.: 20 November 2012 Revised: 2 May 2013 – Accepted: 9 May 2013 – Published: 22 June 2013
Abstract. Recent atmospheric studies have evidenced the imprint of large N2O sources in tropical/subtropical lands. This source might be attributed to agricultural areas as well as to natural humid ecosystems. The uncertainty related to both sources is very high, due to the scarcity of data and low frequency of sampling in tropical studies, especially for the African continent. The principal objective of this work was to quantify the annual budget of N2O emissions in an African tropical rain forest. Soil N2O emissions were measured over 19 months in Ghana, National Park of Ankasa, in uphill and downhill areas, for a total of 119 days of observation. The calculated annual average emission was 2.33 ± 0.20 kg N-N2O ha−1yr−1, taking into account the proportion of uphill vs. downhill areas, the latter being characterized by lower N2O emissions. N2O fluxes peaked between June and Au-gust and were significantly correlated with soil respiration on a daily and monthly basis. No clear correlation was found in the uphill area between N2O fluxes and soil water tent or rain, whereas in the downhill area soil water con-tent concurred with soil respiration in determining N2O flux variability. The N2O source strength calculated in this study is very close to those reported for the other two available studies in African rain forests and to the estimated mean derived from worldwide studies in humid tropical forests (2.81 ± 2.02 kg N-N2O ha−1yr−1).
1 Introduction
Tropical forests are a key ecosystem for terrestrial carbon cy-cling, being the most productive ecosystems on earth (Grace et al., 2001) and accounting for 59 % of the global carbon pool in forests (Dixon et al., 1994). Recent evidence indicates that these ecosystems might have a key role not only in the C cycle but also in the global atmospheric balance of the green-house gas nitrous oxide (N2O). Kort et al.’s (2011) measure-ments of vertical atmospheric profiles (from surface to 14 km altitude) between 67◦S to 85◦N latitude have shown
of a few days of measurements, which make the annual es-timate highly uncertain. Given the wide surface covered by tropical forests, there is a clear need to have a sufficient num-ber of studies to improve our estimates and to help to validate theoretical estimates and downscaling quantifications (Pot-ter et al., 1996; Stehfest and Bouwman, 2006; Werner et al., 2007b). Africa is, in this respect, the least-investigated con-tinent.
The principal objective of this work was to quantify the annual budget of N2O emissions in an African tropical rain forest. N2O fluxes were sampled monthly, with a frequency of 6 days per month, for 19 months. To better understand the dynamics of N2O production, soil CO2 emissions, soil temperature and soil water content were also monitored and their variability related to N2O flux variability.
2 Materials and methods
2.1 The study sites
The study site (05◦16′11′′N, 02◦41′41′′W), located in
Ankasa Wildlife Protected Area, is an ancient rainforest with the highest biodiversity in Ghana. The forest has an area of about 500 km2 and in 1976 became a wildlife protected area, to preserve the forests from cutting, slashing and burn-ing, and conversion to agro-ecosystems. A core area of about 343 km2represents the only protected rain forest area, in an almost pristine state, in Ghana. The mean annual temperature is about 25◦C and the mean annual precipitation is between
1500–2000 mm, depending on the year, mainly concentrated from March to mid-July and from September to November, with a relative humidity ranging from 75 % to 90 %. A rel-atively dry period generally occurs between December and February (Hall and Swaine, 1981). The landscape is charac-terized by the presence of hills with an average elevation of 90 m a.s.l., alternating with steep valleys. Soils are deeply weathered and highly acidic and are classified as Oxisols (Ahn, 1961). Soil, developed on coherent biotite-rich gran-ites of the Cape Coast complex, forms the Ankasa associa-tion, consisting of “Abenia” series, the most widespread ries on top of the hills, which alternates to the “Ankasa” se-ries, along the slopes. Alluvial soils occupy the bottom of the fluvial valleys. The main characteristics of the soil sampled in uphill and downhill study areas are presented in Table 1. Surface litter C in the hill top area is 15 ± 9 Mg C ha−1, and a preliminary estimate of the aboveground biomass, includ-ing live and dead wood, is 138–170 Mg C ha−1(Chiti et al., 2010).
2.2 Experimental set up
Soil N2O and CO2flux measurements were carried out dur-ing year 2009 and 2010. Sampldur-ing started in 2009 in an up-hill area where a tower for eddy covariance measurements is located. The micrometeorological station was identified
as the center of 4 quadrants (North-east, East-south, South-west, West-north) and 2 chambers were positioned at a mini-mum distance of 50 m from the tower, in each quadrant (8 replicates in all). A second plot of about one hectare was set up in 2010 at the bottom of the valley, where soil con-ditions are expected to change significantly, in particular soil humidity. Also in this case 8 replicates were used. Cham-ber position was changed every day to improve the coverage of spatial variability, taking care to insert the chamber base in the ground about 3 h before starting the measurements so as to avoid false fluxes caused by soil pressure changes and to avoid effects of root mortality and decomposition which might occur in the first weeks following collar insertion into the soil (Keller et al. 2000). Replicates were placed at a mini-mum distance of 10 m apart. Within each plot, monthly cam-paigns of soil-atmosphere gas exchange were carried out, over six consecutive days. Sampling in the uphill area started in April 2009 while in the downhill area sampling started in May 2010, data are reported up to November 2010. The initial experimental set-up included soil temperature and wa-ter content measurements undertaken by local micrometeo-rological station. However, a failure of sensors due to light-ning hampered the quality of data. Therefore, from May 2010, soil temperature (HI93510 thermometer, Hanna Instru-ments Canada Inc., Laval, Quebec) and volumetric soil water content (ThetaProbe ML2, Delta-T Device Ltd, Cambridge, UK) were hand-measured adjacent to each chamber (0–5 cm depth), 5 cm from the chamber edge, at each sampling date. Gas sampling was generally done between 10 and 12 a.m. Soil temperature has an annual average maximal daily varia-tion of about 0.5◦C at 5 cm depth and 0.1◦C at 10 cm depth
(meteorological station at site, 2008–2009 data). Soil water content was expressed as water-filled pore space % (WFPS) equal to 100×θv)/ε, where θv is the volumetric water con-tent andεis the total porosity (ε=1 – bulk density/particle density).
2.3 Gas flux determination
Table 1.Main chemico-physical characteristics (± 1 st dev,n=6) of the soil sampled in the study areas.
Site Depth Horizon Sanda Silta Claya BDb pHc Cd Nd
cm g kg−1 g kg−1 g kg−1 Mg m−3 g kg−1 g kg−1
Uphill 0–5 A 665 ± 21 185 ± 12 150 ± 15 1.32 ± 0.12 3.6 ± 0.3 9.8 ± 1.12 0.66 ± 0.21 5–15 Bo1 580 ± 20 191 ± 12 229 ± 31 1.36 ± 0.04 4.2 ± 0.2 1.15 ± 0.51 0.13 ± 0.07 15–30 Bo1 574 ± 63 171 ± 20 255 ± 78 1.35 ± 0.09 4.5 ± 0.2 0.86 ± 0.22 0.11 ± 0.05 30–50 Bo2 572 ± 21 170 ± 26 258 ± 27 1.36 ± 0.13 4.2 ± 0.2 0.78 ± 0.19 0.09 ± 0.04 Downhill 0–5 A 734 ± 19 152 ± 15 114 ± 19 1.3 ± 0.09 4.3 ± 0.2 2.74 ± 0.65 0.22 ± 0.01 5–15 A1 725 ± 32 170 ± 32 105 ± 23 1.34 ± 0.11 4.3 ± 0.2 2.44 ± 0.09 0.22 ± 0.02 15–30 Bo1 668 ± 25 190 ± 17 142 ± 34 1.32 ± 0.15 4.8 ± 0.3 2.32 ± 0.12 0.18 ± 0.01 30–50 Bo2 598 ± 17 186 ± 21 216 ± 26 1.38 ± 0.18 5.0 ± 0.2 1.10 ± 0.05 0.10 ± 0.02
aDetermined using the pipette method after destruction of the organic cement using sodium hypochlorite at pH 9 (Mikutta et al., 2005).bBulk density
determined with the core method (Blake and Hartge 1986).cMeasured in deionised water with a sure-flow electrode, using a ratio soil-solution of 1:2.5 (w/w).
dMeasured by dry combustion (ThermoFinnigan Flash EA112 CHN).
mean error. The analytical set up (Loftfield et al., 1997) al-lowed both N2O and CO2 fluxes to be measured from the same chamber. Gas was loaded on a 2 ml loop connected to a 10-port valve (Valco Europe, Switzerland). A pre-column of 1 m (O.D. 1/8′′, 0.08′′I.D.), filled with Porapak 80-100 Q
and maintained at 60◦C, was connected to the 10-port valve
in order to operate front-flush and back-flush. From the pre-column, the gas passed into the main column (T Porapak 80-100 Q, O.D. 1/8′′, 0.08′′I.D., 2 m length), also held at 60◦C
and was then directed to an electron capture detector (ECD) held at 280◦C for the determination of CO
2and N2O con-centration. Pure nitrogen was used as carrier gas at a flow rate of 40 cm3min−1. A test was made to evidence possible interference of CO2with N2O concentration determination (Wang et al., 2010), by using two N2O standards (320 ppb and 5000 ppb) which were mixed with CO2at different con-centrations (range 1000–10000 ppm), no significant effect of CO2concentration on the peak area of N2O was found. Four concentrations of calibrated standards were used and were injected in duplicate every 20 samples to allow for monitor-ing instrument drift. The CO2 fluxes determined using this approach can be used for comparative analysis between sites and to identify trends in soil respiration (Yan et al., 2009; Ma-panda et al., 2010; Liu et al., 2011) but are not suitable for precisely quantifying soil CO2efflux and site budgets, due to the length of incubation time which might bring to flux un-derestimation. For this latter goal CO2efflux are usually de-termined by an infrared gas analyzer (IRGA) using dynamic closed or open chambers (Rayment and Jarvis, 1997; Heine-meyer and McNamara, 2010). For this reason no attempt was made in this study to quantify the annual budget of soil CO2 emissions.
2.4 Statistics
A two-way analysis of variance was used to compare gas fluxes, soil temperature and water-filled pore space mea-sured in the downhill and uphill plots. A normality test
(Kolmogorov–Smirnov, with Lilliefors correction, Sigma Stat, Jandel Scientific) was performed before running para-metric tests (Sigma Stat, Jandel Scientific). When the dif-ference was significant (P <0.05) an “all pairwise” compari-son was carried out using the “Student Newman–Keuls test”. When normality tests failed, a Kruskal–Wallis ANOVA on ranks was performed. Simple linear regressions, multiple lin-ear regression and non-linlin-ear regression analysis were per-formed to find the relationship between independent and de-pendent variables (Sigma Stat, Jandel Scientific). Significant differences were at theP <0.05 level.
3 Results
3.1 Spatial and temporal variability of N2O fluxes
A M J J A S O N D J F M A M J J A S O N
2009 2010
Daily
mean
soil
CO
2
f
lux
(g
m
-2
d -1 )
0 2 4 6 8 10
Upland Lowland
Daily
mean
N2
O
f
lux
(mg m
-2 d -1)
0 2 4 6 8 10
Upland Lowland
a
b
Fig. 1.Daily mean values (± one st dev) of N2O fluxes(a)and soil
respiration(b)measured in the uphill and downhill areas in 2009 and 2010.
uphill area fluxes were measured from April 2009 to Novem-ber 2010, so we calculated the cumulative flux for two pe-riods of twelve months, April 2009–March 2010 and Oc-tober 2009–November 2010. The calculated annual fluxes were 2.54 and 2.72 kg N-N2O ha−1yr−1, respectively, and the average was 2.63 ±0.23 kg N-N2O ha−1yr−1. The error associated to the total annual emission was calculated using the error propagation formula and was equal to√σ2
·365, where the daily average standard deviation is derived from all the analyzed days of sampling (0.012 kg N-N2O ha−1d−1). Comparing the downhill and uphill N2O cumulative fluxes over the same period of observation (May to November 2010), the total downhill N2O emission was only 44 % of the emission measured in the uphill area. The downhill sur-face was estimated to be about 20 % of the total sursur-face area of the Ankasa National Park, derived by SRTM DEM at 90 m resolution (CGIAR – CSI free source). The calculated weighted annual emission per hectare, taking into account the uphill/downhill ratio, was 2.33 ± 0.20 N-N2O ha−1yr−1, a value which is within the error estimate of the calculated flux for uphill areas.
Fig. 2.N2O daily average fluxes plotted versus daily average CO2
fluxes measured in the uphill and downhill sites. Plain line is a linear fit of data (R2=0.57,P <0.0001, DF = 58).
3.2 Relationship between environmental drivers and N2O fluxes
The potential drivers of N2O fluxes measured at site were soil temperature, soil water content, expressed as soil water-filled pore space, soil CO2fluxes, monthly air temperature and monthly rainfall, calculated as the average of data from the two weather stations closest to the Ankasa site (TRMM database). The seasonal trend of N2O emissions was simi-lar to that of soil respiration (Fig. 1a, b). On a daily basis, higher fluxes of N2O emissions corresponded to higher soil respiration rates (Fig. 2). On a monthly basis, the match be-tween temporal trends of the two gases was particularly clear (Fig. 3a, b). The wider seasonal variations of N2O emissions, compared with soil respiration, most probably reflected the complex interplay of environmental factors which concurred in N2O production and emission. Mean monthly trend values of N2O and CO2emissions did not strictly correspond with trends of average air temperature and total rainfall (Fig. 3c). On a daily basis, variability of N2O and CO2 fluxes were related to variations of soil water-filled pore space and soil temperature. For the uphill area, a lognormal relationship was found between both average daily N2O emissions and soil respiration and WFPS (Fig. 4a), with a gas flux peak be-tween 30 % and 35 % WFPS, slightly shifted towards higher WFPS values for N2O compared to CO2 fluxes (Fig. 4a, b). In the downhill area no significant trend was found be-tween N2O or CO2fluxes and WFPS, although both gases showed a tendency to increase for WFPS values above 50 %. However, a significant relationship was found between N2O and a linear combination of CO2 fluxes and WFPS ([N2O flux (mg m−2d−1)
Fig. 3.Monthly mean N2O flux (bars) and soil CO2flux (black
dots) calculated for the uphill(a)and downhill(b)areas; mean air temperature and total monthly rainfall(c).
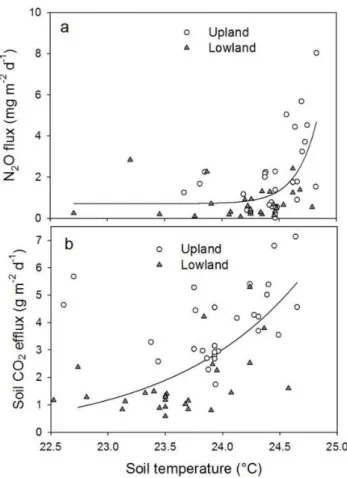
daily N2O and CO2fluxes significantly increased in a range of soil temperatures comprised between 22.5 and 25◦C, the
increase being less marked for CO2fluxes (Fig. 5). The nar-row range of temperatures in which a sharp increase of N2O flux was observed corresponded to intermediate values of soil WFPS (Fig. 4a). Multilinear regression analysis did not evidence any other significant relationship between analyzed variables and N2O emissions.
Fig. 4.N2O and CO2daily average fluxes plotted versus values of soil WFPS. The regression lines are lognormal fits of uphill data set of N2O ((a)R2=0.31,P=0.007, DF = 29) and CO2((b)R2=
0.26,P=0.02, DF = 29) fluxes.
4 Discussion
Fig. 5.N2O and CO2daily average fluxes plotted versus soil
tem-perature. The regression lines are exponential fit of both uphill and downhill data sets. N2O(a)R2=0.35,P <0.0001, DF = 57 and
CO2(b)R2=0.46,P <0.0001, DF = 51.
hand, the comparable annual N2O fluxes in the three African sites indicate that key driving mechanisms of N2O produc-tion are similar in the three tropical rain forests. Both Serca et al. (1994) and Werner et al. (2007a) have evidenced the link between magnitude of N2O emissions and the magni-tude of N mineralization activity, indicating the high rates of the latter in rain forests, in spite of acid soil pH, as one of the key factors which supports high N2O emission rates. Werner et al. (2007a) also pointed out that while short-term variations of N2O might be associated to significant changes in soil moisture, hence to isolated rain events, seasonal N2O emission patterns and the annual budget mainly depend on decomposition rates which control N availability. These ob-servations are in accordance with our results, which indicated a very similar pattern of N2O emissions and soil respiration on a monthly average basis and a good correlation between the two variables at daily time step. In the well-drained up-hill site, where WFPS never exceeded 50 %, soil respiration was the independent factor, the variability of which best pre-dicted the variability of N2O emissions. Soil CO2emission, namely soil respiration, is the result of combined rates of au-totrophic and heterotrophic respiration. The partitioning of
these two components in the overall CO2soil efflux is vari-able depending on site characteristics, time of the year and of the day (Sotta et al., 2004). Both these components tend to increase with increasing soil temperature and moisture, al-though in tropical soil CO2 efflux has been reported to be depressed by strong rain events due to both the limiting of gas diffusion and the decrease of soil temperature (Sotta et al., 2004). Although we could not distinguish between au-totrophic and heterotropic sources of soil CO2 emissions, we might expect that both processes would have influenced N2O production positively. High respiration rates, no mat-ter which organism is involved, tend to decrease soil oxy-gen content and favor the development of anaerobic hotspots of N2O production within aerobic soils (Smith et al., 1990). Higher heterotrophic respiration rates can be expected to co-incide with peaks of fresh organic matter input (litterfall), which also represent a source of N for microbes. In rain forests, peaks of litterfall have been reported to occur mostly at the onset of the rainy season (Muoghalu et al. 1993; De Moraes et al., 1999). Considering that air humidity inside the close and shaded canopy of a rain forest is always quite high, humidity and temperature conditions can generally be con-sidered not limiting for decomposition in the humid tropics, compared with temperate and boreal forest ecosystems, so that a flow of N which supports nitrification and denitrifica-tion processes and N2O emissions (Firestone and Davidson, 1989) is assured during the whole year. An increase of de-composition rates and mineralization can be expected to co-incide with peaks of litter fall and in the first weeks follow-ing the onset of heavy precipitation events if they are close to peaks of litter fall (Werner et al., 2007a). The lower fluxes measured in the downhill area, which coincided with much higher WFPS (37–78 %) compared with uphill, might in part be explained by lower soil respiration rates but also by a pre-dominance of reducing conditions during part of the year, leading to further reduction of produced N2O to N2in soil hotspots where WFPS is close to saturation. The occurrence of such hotspots of anaerobic microbial activity is also con-firmed by measured CH4fluxes which showed high emission rates only in the downhill area (Castaldi et al., 2013).
Table 2.Annual or seasonal rates (italic) of N2O emission (kg N ha−1yr−1)as reported by authors or calculated (where indicated) from
literature studies in humid tropical forests. Reported campaigns occurred only in dry (D) or wet (W) seasons; over a whole year (Y); during periods longer than one year (months are indicated). Arbitrary uncertainty levels are given (explained in Table notes) not as an absolute level of uncertainty but as a comparative indication among studies.
Reference Country Site Sampling N2O emission N◦chambers/ Uncertainty spatial/
period kg N ha−1yr−1 days of sampling temporale
Breuer et al., 2000 Australia Kauri Creek W-D 5.36 5/2084 M/L Breuer et al., 2000 Australia Lake Eacham W 1.15 5/1137 M/L Breuer et al., 2000 Australia Massey Creek D-W 3.75 5/1637 M/L Castaldi et al., 2013 Ghana Ankasa National Park 19 months 2.33 8-16/114 M-L/L Davidson et al., 2004 Brasil Tapajos National Forest D-W, 5ys 1.4 18/20 M/H Keller and Rainers 1994 Costa Rica La Selva, prim for. Y 5.86d 8/12 M/M Kellers and Reiners 1994 Costa Rica La Selva, second. for. Y 3.74d 8/12 M/M
Keller et al., 1983 Brazil Terra firme W 1.90d 2/6 H/H
Keller et al., 1993 Costa Rica La Selva Y 6 8/12 M/M
Keller et al., 2005 Brasil Tapajos Forest Ultisol 2Ys 1.4 8/31 M/M Keller et al., 2005 Brasil Tapajos Forest Oxisol 2Ys 6.5 8/31 M/M Kiese, Butterbach-Ball, 2002 Australia Kauri Creek D-W 4.36 5/400 M/L Kiese, Butterbach-Ball, 2002 Australia Bellender Ker D-W 7.45 5/351 M/L Kiese, Butterbach-Ball 2002 Australia Pin Gin Hill D-W 6.89 5/451 M/L Kiese et al., 2003 Australia Bellender Ker Y 0.97 5/52 M/L Koehler et al., 2009 Panama Gigante lowland 2Ys 1.16 16/34 L/M Livingston et al. 1988 Brazil Manaus, clay D 0.48d 4/2 H/H Livingston et al., 1988 Brazil Manaus, sandy D 0.43d 4/2 H/H
Luizao et al., 1989 Brazil Terra Firme Y 1.9c 8/11 M/H
Maddock et al., 2001 Brasil Tingu`a biol. Res Y 3.14c 5/21 M/M Matson et al., 1990 Brazil Manaus, Oxisol W 0.86c 8/10 M/M Matson et al., 1990 Brazil Manaus, Ultisol W 0.19c 8/4 M/H Matson et al., 1990 Brazil Manaus, Spodsol W 0.07c 8/2 M/H Matson and Vitousek 1987 Costa Rica La Selva W 1.2c 8/2 M/H Matson and Vitousek 1987 Costa Rica La Selva W 1.66c 8/2 M/H Matson and Vitousek 1987 Costa Rica Turialba W 1.14c 10/1 M/H
Melillo et al., 2001 Brazil Rondonia Y 1.94 3/11 H/H
Nepstad et al., 2002a Brasil Tapajos National Forest 34 months 2.3 18/13 L/H
Neto et al., 2010 Brasil Picinguaba Y 2.2 4/12 H/M
Neto et al., 2010 Brasil Santa Virginia Y 0.9c 4/12 H/M
Neto et al., 2010 Brasil Serra do Mar Y 0.7c 4/12 H/M
Serca et al., 1994 Congo Mayombe region W-D 2.9 6-8/15 M/M Verchot et al., 1999 Brazil East Amazon, primary Y 2.43 8/16 M/M Verchot et al., 1999 Brazil East Amazon, secondary Y 0.94 8/16 M/M
Verchot et al., 1999 Brazil Par`a D 0.09d 8/1 M/H
Verchot et al., 2006 Indonesia Sumatra, forest 9 months 1.2 8/4 M/H Verchot et al., 2006 Indonesia Sumatra, wet forest 9 months 1.3 8/4 M/H
Yan et al., 2008 China Xishuangbanna Y 2.7 3/50 H/L
Weitz et al., 1998 Costa Rica La Selva, sec for,dystrop 13 months 1.42b 8/20 M/M Weitz et al., 1998 Costa Rica La Selva, sec for, eutrop 14 months 1.28b 8/22 M/M Werner et al., 2007 Kenya Kakamega forest D-W 2.6 6/347 M/L
asame site of Davidson et al 2004;bcalculated from annual average;cextrapolated from monthly measurements;dextrapolated from mean estimates for the sampling period;
espatial uncertainty classified as high (H) when no chambers<5, medium (M) when 5<no. ch<10, low (L) when no. ch>10; temporal uncertainty classified as high (H) when
only one season is sampled or when over the year we have less than 1 measurement per month, medium (M) when sampling frequency is between 1 and 4 days per month, low (L) when sampling frequency is higher than 4 days per month.
the range of observed fluxes varies from 0.94 to 7.45 kg N-N2O ha−1yr−1. All the sites which show fluxes higher than 3 kg N-N2O ha−1yr−1are characterized by annual total rain-fall higher than 2000 mm, with the sole exception of Kauri Creek site in Australia (Table 2), hence higher than rainfall at Ankasa site. Rainfall represents both a proximal and dis-tal factor which exert a positive control (stimulation) on N2O emission, because it influences soil water-filled pore space,
5 Conclusions
Results showed that the rain forest in Ghana has annual emis-sion rates very close to other rain forest sites of Central Africa characterized by similar rainfall conditions. Fluxes were characterized by high temporal variability, which sup-ported the extreme importance of adequate sampling fre-quency in this natural environment. Moreover, the study also showed the importance of spatial coverage, with valley areas having statistically different fluxes from uphill areas. This is a common feature of many tropical landscapes which need to be taken into account when scaling up.
Acknowledgements. The present work was support by the Car-boAfrica project and ERC grant GHG Africa no. 247349, we thanks Justice John Mensah for gas sampling, Michele Riondino for support with gas analysis and Mary Claire Barber and David Whitworth for English revision.
Edited by: X. Wang
References
Ahn, P. M.: Soils of the lower Tano basin, south-western Ghana, Ministry of Food and Agriculture, Scientific Services Division, Soil and Land-use Survey Branch, Kumasi, 266, 1961.
Blake, G. R. and Hartge, K. H.: Bulk Density, in: Methods of Soil Analysis, Part I. Physical and Mineralogical Methods, edited by: Klute, A., Agronomy Monograph no. 9, 2 Edn., 363–375, 1986. Breuer, L., Kiese, R., and Butterbach-Bahl, K.: N2O emissions from tropical forest soils of Australia, J. Geophys. Res., 105, 26353– 26367, 2000.
Castaldi, S., Bertolini, T., Santini, M., Thongo M’Bou, A., De Grandcourt, A., Nicolini, G., and Valentini, R.: Hotspots of N2O
and CH4emissions in tropical ecosystems, Geophys. Res. Abs.,
15, EGU2013-3170-1, 2013.
Chiti, T., Certini, G., Grieco, E., and Valentini, R.: The role of soil in storing carbon in tropical rainforests: the case of Ankasa Park, Ghana, Plant Soil, 331, 453–461 ,2010.
Davidson, E. A., Nepstad, D. C., Ishida, F. Y., and Bando, P. M.: Ef-fects of an experimental drought and recovery on soil emissions of carbon dioxide, methane, nitrous oxide, and nitric oxide in a moist tropical forest, Glob. Change Biol., 14, 2582–2590, 2004. De Moraes, R. M., Carvalho, W.,B., and Struffaldi-DeVuono, Y.: Litterfall and litter nutrient content in two Brazilian Tropical Forests, Rev. Brasil. Botanica, 22, 9–16, 1999.
Dixon, R. K., Brown, S., Houghton, R. A., Solomon, A. M., Trexler, M. C., and Wisniewski, J.: Carbon pools and flux of global forest ecosystems, Science, 263, 185–190, 1994.
Firestone, M. K. and Davidson, E. A.: Microbiological basis of NO and N2O production and consumption in soil, in: “Trace
Gas Exchange between Terrestrial Ecosystems and the Atmo-sphere”, edited by: Andreae, M. D. and Schimel, D. S., 7–22, Wiley, Berlin, 1989.
Grace, J., Malhi, Y., Higuchi, N., and Meir, P.: Productivity and carbon fluxes of tropical rain forests, in: Terrestrial Global
Pro-ductivity: Past, Present and Future, edited by: Mooney, H. and Saugier, B., 401–426, Academic Press, 2001.
Hall, J. B. and Swaine, M. D.: What is forest, in: Distribution and ecology of vascular plants in a tropical rain forest, Forest veg-etation in Ghana, edited by: Junk, W., 3–29, The Hague, The Netherlands, 1981.
Heinemeyer, A. and McNamara, N. P.: Comparing the closed static versus the closed dynamic chamber flux methodology: Implica-tions for soil respiration studies, Plant Soil, 346, 145–151, 2011. Hutchinson, G. L. and Mosier, A. R.: Improved soil cover method for field measurements of nitrous oxide fluxes, Soil Sci. Soc. Am. J., 45, 311–316, 1981.
Keller, M. and Reiners, W. A.: Soil-atmosphere exchange of nitrous oxide, nitric oxide and methane under secondary succession of pasture to forest in the Atlantic downhill of Costa Rica, Global Biogeochem. Cy., 8, 399–409, 1994.
Keller, M., Goreau, T. J., Wofsy, S. C., Kaplan, W. A., and McElroy, M. B.: Production of nitrous oxide and consumption of methane by forest soils, Geophys. Res. Lett., 10, 1156–1159, 1983. Keller, M., Veldkamp, E., Weitz, A. M., and Reiners, W. A.: Effect
of pasture age on soil trace-gas emissions from a deforested area of Costa Rica, Nature, 365, 244–246, 1993.
Keller, M., Weitz, A. M., Bryan, B., Rivera, M. M., and Silver, W. L.: Soil-atmosphere nitrogen oxide fluxes: effects of roots distur-bance, J. Geophys. Res., 105, 17693–17698, 2000.
Keller, M., Varner, R., Dias, J. D., Silva, H., Crill, P., and de Oliveira, R. C.: Soil-atmosphere exchange of nitrous oxide, nitric oxide, methane, and carbon dioxide in logged and undisturbed forest in the Tapajos National Forest, Brazil, Earth Interact., 9, 1–28, 2005.
Kiese, R. and Butterbach-Bahl, K.: N2O and CO2emissions from
three different tropical forest sites in the wet tropics of Queens-land, Australia, Soil Biol. Biochem., 34, 975–987, 2002. Kiese, R., Hewett, B., Graham, A., and Butterbach-Bahl, K.:
Sea-sonal variability of N2O emissions and CH4uptake in tropical rainforest soils of Queensland, Australia, Global Biogeochem. Cy., 17, 1043, doi:10.1029/2002GB002014, 2003.
Kiese, R., Li, C., Hilbert, D., Papen, H., and Butterbach-Bahl, K.: Regional application of PnET-N-DNDC for estimating the N2O
source strength of tropical rainforests in the Wet Tropics of Aus-tralia, Glob. Change Biol., 11, 128–144, 2005.
Koehler, B., Corre, M. D., Veldkamp, E., Wullaert, H. S., and Wright, J.: Immediate and long-term nitrogen oxide emissions from tropical forest soils exposed to elevated nitrogen input. Global Change Biol., 15, 2049–2066, 2009.
Kort, E. A., Patra, P. K., Ishijima, K., Daube, B. C., Jim´enez, R., Elkins, J., Hurst, D., Moore, F. L., Sweeney, C., and Wofsy, S. C.: Tropospheric distribution and variability of N2O: evidence
for strong tropical emissions, Geophys. Res. Lett., 38, L15806, doi:10.1029/2011GL047612, 2011.
Liu, J., Jiang, P., Wang, H., Zhou, G., Wua, J., Yang, F., and Qian, X.: Seasonal soil CO2 efflux dynamics after land use
change from a natural forest to Moso bamboo plantations in sub-tropical China, Forest Ecol. Manag., 262, 1131–1137, 2011. Livingston, G. P., Vitousek, P. M., and Matson, P. A.: Nitrous oxide
fluxes and nitrogen transformations across a landscape gradient in Amazonia, J. Geophys. Res., 93, 1593–1599, 1988.
trace gases methane, carbon dioxide and nitrous oxide, J. Env-iron. Qual., 26, 560–564, 1997.
Luizao, F., Matson, P. A., Livingston, G., Luizao, R., and Vi-tousek, P. M.: Nitrous oxide flux following tropical land clearing, Global Biogeochem. Cy. 3, 281–85, 1989.
Maddock, J. E. L., Bernadete, M., dos Santos, P., and Prata, K. R.: Nitrous oxide emission from soil of the Mata Atlantica, Rio de Jeneiro State, Brasil, J. Geophys. Res., 106, 23055–23060, 2001. Mapanda, F., Mupinib, J., Wutab, M., Nyamangara, J., and Rees, R. M.: A cross-ecosystem assessment of the effects of land cover and land use on soil emission of selected greenhouse gases and related soil properties in Zimbabwe, Eur. J. Soil Sci., 61, 72– 733, 2010.
Matson, P. A. and Vitousek, P. M.: Cross-system comparison of soil nitrogen transformations and nitrous oxide fluxes in tropi-cal forests, Global Biogeochem. Cy., 1, 163–170, 1987. Melillo, J. M., Steudler, P. A., Feigl, B. J., Neill, C., Garcia, D.,
Piccolo, M. C., Cerri, C. C., and Tian, H.: Nitrous oxide emis-sions from forests and pastures of various ages in the Brazilian Amazon, J. Geophys. Res., 106, 34179–34188, 2001.
Mikutta, R., Kleber, M., Kaiser, K., and Jahn, R.: Review: or-ganic matter removal from soils using hydrogen peroxide, sodium hypochlorite, and disodium peroxodisulfate, Soil Sci. Soc. Am. J., 6, 120–135, 2005.
Muoghalu, J. I., Akanni, S. O., and Eretan, O. O.: Litter fall and nutrient dynamics in a Nigerian rain forest seven years after a ground fire, J. Veg. Sci., 4, 323–328, 1993.
Nepstad, D. C., Moutinho, P., Dias-Filho M. B., Davidson, E., Cardinot, G., Markewitz, D., Figueiredo, R., Vianna, N., Cham-bers, J., Ray, D., Guerreiros, J. B., Lefebvre, P., Sternberg, L., Moreira, M., Barros, L., Ishida, F. Y., Tohlver, I., Belk, E., Kalif, K., and Schwalbe, K.: The effects of partial throughfall exclu-sion on canopy processes, aboveground production, and biogeo-chemistry of an Amazon forest, J. Geophys. Res., 107, 8085, doi:10.1029/2001JD000360, 2002.
Sousa Neto, E., Carmo, J. B., Keller, M., Martins, S. C., Alves, L. F., Vieira, S. A., Piccolo, M. C., Camargo, P., Couto, H. T. Z., Joly, C. A., and Martinelli, L. A.: Soil-atmosphere exchange of nitrous oxide, methane and carbon dioxide in a gradient of ele-vation in the coastal Brazilian Atlantic forest, Biogeosciences, 8, 733–742, doi:10.5194/bg-8-733-2011, 2011.
Potter, C. S., Matson, P. A., Vitousek, P. M., and Davidson, E. A.: Process modelling of controls on nitrogen trace gas emissions from soils world-wide, J. Geophys. Res., 101, 1361–1377, 1996. Rayment, M. B. and Jarvis, P. G.: An improved open chamber sys-tem for measuring soil CO2 effluxes in the field, J. Geophys.
Res.-Atmos., 102, 28779–28784, 1997.
Serca, D., Delmas, R., Jamnert, C., and Labroue, L.: Emissions of nitrogen oxides from equatorial rain forest in Central Africa: ori-gin and regulation of NO emission from soils, Tellus B, 46, 243– 254, 1994.
Smith, K. A.: Anaerobic zones and denitrification in soil: mod-elling and measurements, in: Denitrification in Soil and Sed-iment, edited by: Revsboech, N. P. and Sørensen, J., Plenum Press, New York, 228–240, 1990.
Smith, K. A., Clayton, H., McTaggart, I. P., Thomson, P. E., Arah, J. R. M., and Scott, A.: The measurement of nitrous oxide emissions from soil by using chambers, Philos. T. Roy. Soc. B., 51, 327–338, 1995.
Sotta, E. D., Meir, P., Mahli, Y., Nobrez, A. D., Hodnett, M., and Grace, J.: Soil CO2efflux in a tropical forest in the Central Ama-zon, Glob. Change Biol., 10, 601–617, 2004.
Stehfest, E. and Bouwman, L.: N2O and NO emission from
agricul-tural fields and soils under naagricul-tural vegetation: summarizing avail-able measurement data and modeling of global annual emissions, Nutr. Cycl. Agroecosys., 74, 207–228, 2006
Verchot, L. V., Davidson, E. A., Cattˆanio, J. H., Ackerman, I. L., Er-ickson, H. E., and Keller, M.: Land use change and biogeochem-ical controls of nitrogen oxide emissions from soils in eastern Amazonia, Global Biogeochem. Cy., 13, 31–46, 1999.
Verchot, L. V., Hutabarat, L., Hairiah, K., and van Noordwijk, M.: Nitrogen availability and soil N2O emissions following
con-version of forests to coffee in Southern Sumatra, Global Bio-geochem. Cy, 20, GB4008, doi:10.1029/2005GB002469, 2006. Wang, Y., Wang, Y., and Ling, H.: A new carrier gas type fro
ac-curate measurement of N2O by GC-ECD, Adv. Atmos. Sci., 27,
1322–1330, 2010.
Weitz, A. M., Veldkamp, E., Keller, M., Neff, J., and Crill, P. M.: Nitrous oxide, nitric oxide and methane fluxes from soils follow-ing clearfollow-ing and burnfollow-ing of tropical secondary forest, J. Geophys. Res., 103, 28047–28058, 1998.
Werner, C., Kiese, R., and Butterbach-Bahl, K.: Soil-atmosphere exchange of N2O, CH4, and CO2and controlling environmental
factors for tropical rain forest sites in western Kenya, J. Geophys. Res., 112, D03308, doi:10.1029/2006JD007388, 2007a.. Werner, C., Butterbach-Bahl, K., Haas, E., Hickler, T., and Kiese,
R.: A global inventory of N2O emissions from tropical
rainfor-est soils using a detailed biogeochemical model, Global Bio-geochem. Cy., 21, GB3010, doi:10.1029/2006GB002909, 2007b. Werner, C., Zheng, X., Tang, J., Xie, B., Liu, C., Kiese, R., and Butterbach-Bahl, K.: N2O, CH4and CO2emissions from
sea-sonal tropical rainforests and a rubber plantation in South West China, Plant Soil, 289, 335–353, 2006.
Yan, Y., Sha, L., Cao, M., Zheng, Z., Tang, J., Wang, Y., Zhang, Y., Wang, R., Liu, G., Wang, Y., and Sun, Y.:: Fluxes of CH4and N2O from soil under a tropical seasonal rain forest in
Xishuang-banna, Southwest China, J. Environ. Sci., 20, 207–215, 2008. Yan, J., Zhang, D., Zhou, G., and Liu, J.: Soil respiration