ABSTRACT: Periodic assessment of the genetic progress made in recurrent selection programs is essential for assessing the evolution of the programs and identifying the main factors that have contributed to this progress. This study aimed to estimate genetic progress in grain yield, plant height and days-to-flowering achieved in the CNA6 population of upland rice (Oryza sativa L.), after four cycles of recurrent selection; and evaluate the genetic potential of this population to generate superior inbred lines after each selection cycle. The experimental data were obtained from progeny yield trials of each recurrent selection cycle. These trials were carried out in two or three locations per cycle, and consisted of S0:2 progenies and at least three checks. Feder-er’s augmented block design, with one replication on location (the environment), was adopted. Results revealed genetic progress for grain yield and plant height, with total genetic gains of 375.87 kg ha−1 and -3.90 cm, respectively, during the four selection cycles. The annual relative gain observed for grain yield was 1.54 %. The genetic potential of the population was analysed by the expected proportion of superior inbred lines. The standard adopted as the limit for obtain-ing superior inbred lines was the average of the checks for each trait. The genetic potential for grain yield and plant height increased during the study period. For days-to-flowering, no genetic gain occurred; however, the genetic potential of the population to generate superior inbred lines for this trait was maintained after the selection cycles.
Keywords: BLUE, BLUP, mixed model, population breeding
Abbreviations:BLUP - Best linear unbiased predictor, BLUE - Best linear unbiased estimator, REML - Restricted maximum likelihood, GY - Grain yield, PH - Plant height
DF - Days-to-flowering, PS - Proportion of superior inbred lines.
Introduction
In Brazil, upland rice (Oryza sativa L.) occupies more than one million hectares in the savannah region (Pinheiro et al., 2006). In breeding programs, most of the traits of economic importance are quantitative, con-trolled by many genes and highly influenced by the envi-ronment. Thus, one strategy is to concentrate favorable alleles gradually through a recurrent selection method with the intent of maintaining genetic variability and increasing the average value of the population to pro-vide feasible gains in subsequent cycles (Morais, 2005; Hallauer et al., 2010). This method is widely used in outcrossing species, but it is limited to autogamous spe-cies, because it is difficult to achieve crossing through recombination of the population in each selection cycle. However, with the discovery of genetic male sterility in rice, the use of the recurrent selection method has be-come feasible (Fujimaki, 1979).
An important parameter for measuring the success of breeding programs is the monitoring of their efficien-cy over time by estimating the genetic progress achieved (Hallauer et al., 2010). In irrigated rice, successful re-sults from the efficiency of recurrent selection have been published (Rangel et al., 2002; Rangel et al., 2007), as for other crops, such as common bean (Phaseolus vulgaris
L.) (Silva et al., 2010), oats (Avena sativa L.) (Holland et al., 2000), soybean (Glycine max (L.) (Uphoff et al., 1997) and wheat (Triticum aestivum L.) (Niu et al., 2010). On
upland rice, however, few studies have been conducted. Breseghello et al. (2009) estimated that about three times more genetic gains were observed using recurrent selec-tion than pedigree breeding (Soares et al., 1999; Souza et al., 2007).
One of the challenges of breeding programs in-volves the early evaluation of the potential of a popu-lation to generate superior inbred lines. The method of Jinks and Pooni (1976) allows for estimating the po-tential, given the mean and genetic variance of early generations, with examples in rice (Santos et al., 2002), common bean (Abreu et al., 2002), maize (Toledo and Miranda Filho, 1985), soybean (Toledo, 1987; Triller and Toledo, 1996) and wheat (Snape, 1982).
This study aimed to estimate the genetic progress in grain yield, plant height and days-to-flowering in the CNA6 population of upland rice after four cycles of re-current selection, and to evaluate the genetic potential of this population to generate superior inbred lines in each cycle.
Materials and Methods
Genetic material
The genetic material consisted of S0:2 progenies of the CNA6 population of upland rice developed by recur-rent selection by the Brazilian Agricultural Research Cor-poration (Embrapa). This population was synthesized in the 1993/94 crop year by incorporating the alleles from 1Federal University of Goias − Dept. of Genetics and Plant
Breeding and Food Engineering − Campus Samambaia, Rod. GO-462, km 0, C.P. 131 − 74001-970 − Goiânia, GO − Brazil.
2Embrapa Rice and Beans, Rod. GO-462, km 12, C.P. 179 − 75375-000 − Santo Antonio de Goiás, GO − Brazil. 3Embrapa Rondonia, Rod. BR-364, km 5.5, C.P. 127 − 76815-800 − Porto Velho, RO − Brazil.
4Embrapa Mid-North – Av. Duque de Caxias, 5650, C.P. 001 – 64006-220 – Teresina, PI – Brazil.
*Corresponding author <[email protected]>
Edited by: Antonio Augusto Franco Garcia
Genetic progress after cycles of upland rice recurrent selection
Odilon Peixoto de Morais Júnior1, Patrícia Guimarães Santos Melo1, Orlando Peixoto de Morais2, Adriano Pereira de Castro2,
Flávio Breseghello2, Marley Marico Utumi3, José Almeida Pereira4, Flávio Jesus Wruck2, José Manoel Colombari Filho2*
27 parents into the CNA-IRAT 5/2/1 population (Table 1). The CNA-IRAT 5 population was a product of the partnership between Embrapa and the Institute for Re-search in Tropical Agriculture (IRAT) in France, current-ly known as the French Center for International Coop-eration in Development-oriented Agricultural Research (CIRAD). This population was synthesized in 1984 by intercrossing 26 lines of the subspecies japonica and one line of indica originated from the mutation of IR 36 bred by Singh and Ikehashi (1981). This mutant possesses the recessive gene that affects genetic male sterility, which makes possible the recombination of progenies (Fujima-ki, 1979).
The CNA6 population was initially subjected to two cycles of mass selection in S0 generation followed by recombination. The sample size used in these cycles was highly conservative (about 100 individual plants) to min-imize the occurrence of genetic drift. These two cycles occured in the 1994/95 and 1995/96 crop years in order
to standardize the maturity cycle and eliminate geno-types with excessive plant height. In the 1997/98 crop year, the first evaluation for grain yield was carried out based on S0:1 progenies. The remaining seeds from the selected progenies were recombined in the 1998/99 crop year in a synthesis of the population of the third cycle.
After this cycle was complete, the population was subjected to four more selection cycles, each taking three years, comprising the following steps: selection of individual plants within each crossing in S0 generation in the first year; observation and selection of the best S0:1 progenies (harvested in bulk) and selection of the top five panicles from fertile plants (S1:2 progenies) within each selected S0:1 progeny to be used as units of recom-bination in the second year; evaluation and selection of S0:2 progenies in yield trials in different locations; and field recombination of the selected progenies with the use of the genetic male sterility in of the seeds from S1:2 progenies (msms genotype) in the third year (Figure 1).
Individual plants were selected based on plant architecture, disease resistance and dimensions of the grain (long and thin), and the quality requirements of the Brazilian consumer market. The selection of S0:1 progenies focused on traits of high heritability, including plant height, days-to-flowering, lodging resistance, dis-ease resistance (mainly to blast caused by Magnaphorte
grisea) and grain quality. The selection of S0:2 progenies
from yield trials, in different locations, prioritized the grain yield trait, which is quantitative, and highly influ-enced by environmental conditions. These target traits for the upland rice breeding program in Brazil are bet-ter described in Breseghello et al. (2011) and Colombari Filho et al. (2013).
Experimental data
This study used data on trait grain yield (GY, kg ha−1), plant height (PH, cm) and days-to-flowering (DF,
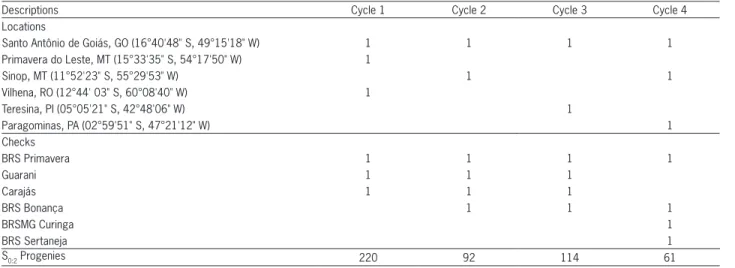
days) collected from yield trials of S0:2 progenies. The tri-als were conducted during the 2000/01, 2003/04, 2006/07 and 2009/10 crop years, which corresponded to cycles 1, 2, 3 and 4, respectively. For each cycle, the trials were carried out in different locations (Table 2).
The data set was unbalanced because in each cycle, the trials consisted of S0:2 progenies from the re-spective cycle with at least three checks. As check culti-vars (commercial) change over time, a number of checks were substituted across the cycles; however, at least two common check cultivars were maintained between cy-cles (Table 2).
Federer’s augmented block design with one repli-cation within the lorepli-cation (the environment) was used (Federer, 1956). Plots consisted of four 5-m-long rows, spaced 0.30 m, with sixty seeds per meter sowed either manually or by machine. To evaluate GY, two central rows were harvested, and the first and last 0.50 m of each row were not used. For PH, an average of three readings for the distance from the base of the plant to the end of the panicle was recorded. For DF, the interval between
Table 1 − Percentages of participation of each parent in the CNA6 population of upland rice.
Parents (%)
CNA-IRAT 5/2/1a 62.60
IAC 25Rb 3.47
IRAT 112Rc 3.47
Bico Ganga (CNA 0420) 1.93
Precoce Branco (780029) 1.93
Muruim Ligeiro (780299) 0.56
IAC 84-198 0.55
Três Meses Branco (780353) 1.93
Rio Verde 1.93
Guaíra (CNA 1240) 1.93
Campininho (780191) 1.93
Arroz de Revenda (CNA 5584) 1.93
Japonês Claro (780169) 1.93
Nº 392 Gervex 1.68
CNA 6710 1.38
Puteca-GO (780217) 1.38
Rio Paraguai 1.38
IREM 238 (IREM 293-B) 0.83
Agulha Branco (CNA 6524) 0.61
Japonês (780135) 0.61
Cem Dias (780177) 0.56
Cana Roxa Ligeiro (780279) 0.56
Pratão Goiano (780336) 0.56
Vermelho (790044) 0.56
Cuttack 4 0.55
RikutoNorin 0.56
IRAT 10 0.55
CNA 6186 0.55
Figure 1 − Scheme of recurrent selection using male sterility gene (msms) and schedule of development of the CNA6 population of upland rice in recurrent selection program.
Year* Step Population**
1993/94 Synthesis CNA6
Nov/1994 S0 CNA6
May/1995 Rec CNA6/1/1
Nov/1995 S0 ...
May/1996 Rec CNA6/2/1
1996/97 S0 ...
1997/98 S0:1 ...
Aug/1998 Rec CNA6/3/1
Jan/1999 S0 ...
1999/00 S0:1 ...
2000/01 S0:2 ...
Aug/2001 Rec CNA6/4/1
Jan/2002 S0 ...
2002/03 S0:1 ...
2003/04 S0:2 ...
Aug/2004 Rec CNA6/5/1
Jan/2005 S0 ...
2005/06 S0:1 ...
2006/07 S0:2 ...
Aug/2007 Rec CNA6/6/1
Jan/2008 S0 ...
2008/09 S0:1 ...
2009/10 S0:2 ...
*Crop year, or Month and Year of sowing; and **CNA6/C/R, where C is the number of the selection cycle and R is of the number recombination to start the next cycle.
sowing and heading of 50 % of the plants was evalu-ated. The yield trials of S0:2 progenies were performed similarly to those in commercial production; however, fungal diseases were not chemically controlled to allow for selection of progenies with genetic resistance.
Statistical analyses
Statistical analysis was performed based on the mixed linear model yijkm = µ + lk + bj/k + tm + gi/m+ glik + εijkm, where: yijkm is the observation of genotype i in block j in environment k belonging to type m, µ the over-all mean, lkthe fixed effect of environment k (k = 1, 2, …, K), bj/k the fixed effect of block j within environment k (j = 1, 2, …, J), tm the fixed effect of type m (M = 5), with four groups of progenies and one group of checks), gi/m the random effect of genotype i within type m (i = 1, 2, …, Pm, Pm +1, Pm + 2, Pm + C), where Pmis the number of progenies within cycle m, m = 1, 2, …, 4, and C the number of checks) assuming gi/m ~ NID(0, ). glik is the random effect of the genotype-environment interaction assuming glik ~ NID (0, ), and εijkmthe random effect
of the experimental error associated with the ijk-th plot, assuming NID (0, σ2) (Duarte et al., 2001).
Locations and years (cycles) were treated as envi-ronments for the following reasons: (i) only two cycles with two locations were common to all periods (Table 2) and (ii) there was no intention to analyze the effect of the interactions between genotype and environment partitioned into locations and years (cycles).
To obtain the relationship between traits in the four cycles of recurrent selection were calculated the genetic (rG), phenotypic (rF) and environment (rE) coefficients of correlation were calculated. The estimate of correlation coefficient ( ) was based on the ratio of the estimate of the covariance of x and y (Cov(x,y)) to the estimates of stan-dard deviation of the two traits (σx and σy), i.e.,
The relative mean genetic gain (G) per cycle was estimated as the ratio of the estimated angular regres-sion coefficient ( ) to the mean value estimated for cycle 1 ( ) as a percentage according to the equation
.
To obtain the genetic gain given from the cumulative gains, the equation
was used to estimate the annual relative G (GA), where y corresponds to the number of years in each cycle. To estimate the total relative G (GT) of the four cycles of recurrent selection, given the cumulative gains, the equation
was adopted, where c corresponds to the number of selection cycles in the period during which the genetic progress was estimated.
To obtain the weighted coefficient of determina-tion using the method of Breseghello et al. (1998), the general equation of the sum of the squares from the hypothesis of linear models was adopted (Searle, 1971) for each component of variation, as described by Pereira et al. (2008). The gains between cycles were also esti-mated by generalized linear regression analysis and by contrasting the observed mean values for each cycle and the total gain and mean values of the first and last cycles estimated by the method of adjusted means described by Breseghello et al. (1998). For the significance of each gain, the t-test was applied.
The mixed linear model adopted in its matrix form was represented by the generalized linear mixed model y = Xβ + Zλ + ε, where y is the vector of the observed means, X and Z are the respective incidence matrices of the fixed and random effects, β and λ are vectors of the fixed and random effects, respectively, and ε is the vector of random errors (Henderson, 1959). The matrix equation was calculated by restricted maximum likelihood (REML) to obtain the best linear unbiased estimate (BLUEs) of the fixed effect of type m (four groups of S0:2 progenies and one group of checks) with the corresponding covariance matrices and the best linear unbiased prediction (BLUPs) of the random effect of the genotypes (S0:2 progenies).
Analyses of the average weighted genetic gain were implemented according to the method of adjusted means described by Breseghello et al. (1998). In the adapted version, the common treatments between different cy-cles were used as checks. The average genetic gain and the associated genetic covariance matrix were calculated for four cycles using generalized linear regression for the BLUE averages of the type (i.e., the four groups of S0:2 progenies) in accordance with the equations
, and ,
where: β is the vector of the generalized linear regres-sion solutions, X is the incidence matrix formed by a row of 1’s and one column indicating the type in the se-ries of progeny groups, V is the covariance matrix of the BLUEs of the type, Y is the vector of the BLUEs of the type (i.e., the four groups of progenies), the covari-ance matrix of , the estimate of the intercept and the estimate of the slope. For the significance of the slope ( ) a t-test was applied. Details on the method by which was determined were presented by Breseghello et al. (1998).
Table 2 − Locations, cultivars used as checks and number of S0:2 progenies of the CNA6 population, that comprised the yield trials of each recurrent selection cycle.
Descriptions Cycle 1 Cycle 2 Cycle 3 Cycle 4
Locations
Santo Antônio de Goiás, GO (16°40'48" S, 49°15'18" W) 1 1 1 1
Primavera do Leste, MT (15°33'35" S, 54°17'50" W) 1
Sinop, MT (11°52'23" S, 55°29'53" W) 1 1
Vilhena, RO (12°44' 03" S, 60°08'40" W) 1
Teresina, PI (05°05'21" S, 42°48'06" W) 1
Paragominas, PA (02°59'51" S, 47°21'12" W) 1
Checks
BRS Primavera 1 1 1 1
Guarani 1 1 1
Carajás 1 1 1
BRS Bonança 1 1 1
BRSMG Curinga 1
BRS Sertaneja 1
The proportion of superior inbred lines (PS) of the population in each cycle was obtained from the meth-od described by Toledo (1987), from the procedure de-scribed by Jinks and Pooni (1976), which estimates the probability of a population to generate lines that exceed a certain standard in generation F∞. This probability cor-responds to the area to the right or left of a given value on the abscissa of the normal distribution. To determine this area considering the standard normal distribution, the ordinate Z was estimated by the equation
,
where Z is the value of the abscissa of the standard nor-mal distribution Z(0, 1), is the standard adopted as the limit for obtaining superior inbred lines (in the pres-ent study, the average of the checks for each trait was considered), is the average of the S0:2 progenies and is considered equal to the average of the population after reaching homozygosity, and is the estimate of the ad-ditive genetic variance of S0:2 progenies. The value of was obtained by assuming that the estimate genetic vari-ance among S0:2 progeny ( ) is equivalent to generation F2:4, i.e.,
(Cockerham, 1963), and estimated by REML (Searle et al., 1992).
To calculate PS, two assumptions for the average degree of dominance (add) were considered according to the equation add = : (i) add = 0, with the esti-mate of considered equal to the estimate of the genetic variance among S0:2 progenies, ( ), i.e., ≅ ; (ii) add = 1, with the genetic variance of dominance ( ) equal to ( ) of . Thus, the estimate of equals ( ) of the estimate of , i.e., ≅ ( ) (Cockerham, 1963). It is important to consider that because this population was derived from recurrent selection, it is most likely not in Hardy-Weinberg equilibrium and allele frequency is dif-ferent by 0.50. Furthermore, in addition to the additive genetic variance and dominance, other variance compo-nents were considered null for the purpose of estimating PS values (Cockerham, 1983).
All statistical analyses were performed using the
glm, varcomp, mixed and iml procedures of the SAS®
(Sta-tistical Analysis System, version 9.2).
Results and Discussion
Average GY values were lower in progenies than in the checks in all cycles of recurrent selection (Figure 2). The average is an important parameter in population breeding because a low average indicates that a longer period is required to achieve the desired level of prog-ress (Hallauer et al., 2010). Lower average values were found in the progenies of the CNA6 population than in
the checks. According to Rangel et al. (2002), this may be due to the presence of the gene for genetic male sterility in the progenies and the reduced number of selection cycles.
There was average reduction in GY in the S0:2 prog-enies (BLUE) and the range of variation of mean values (BLUPs) in cycle 2 (Figure 2). This reduction might have occurred because there was strong selection pressure for traits such as modern plant architecture, grain
mensions (long and thin) and lodging resistance in the previous generation (S0:1 progenies). The gains observed in the S0:2 progenies also resulted from gains achieved in the selection of traits with high heritability in previ-ous generations for the same cycle (S0 and S0:1). In cycle 3, after recombination, the average BLUE returned to a level similar to that observed in cycle 1; however, the amplitude of the variation in BLUPs remained lower in the subsequent cycles than in cycle 1, with the begin-nings of restoration in cycle 4.
The reduction in amplitude of the BLUP for GY most likely occurred due to the strong selection pres-sure applied during cycle 2 (S0:1 progenies), the effects of which appeared in the subsequent cycle. After cycle 2, clear genetic progress in GY attributable to the increase in the average GY of the S0:2 progenies was observed (Figure 2).
The results of the generalized linear regression ad-justed for the average values of the S0:2 progenies (BLUE) in the four cycles suggest that linear genetic progress in GY (p < 0.05) occurred during the cycles of recurrent selection (Figure 2 and Table 3). The average gain per cycle was 125.29 kg ha−1, which corresponded to a gain
of 4.71 % per cycle. It should be emphasized that the information on relative gains for specific phases cannot be obtained by simple operations that consider only the number of phases and the intervals between them, be-cause the gains are cumulatives (i.e., compounds). Thus, the annual and total relative gains were also estimated and found to be equal to 1.54 % and 14.80 %, respec-tively, of the initial average (Table 3).
Estimates of genetic gains in GY in rice recurrent selection programs have been reported; however, the methods employed in these studies are generally differ-ent, which makes comparisons difficult. In studies that used similar methods, such as that of Breseghello et al. (2009), an annual genetic gain of 3.60 % was estimated in the CG3 population of upland rice after three cycles
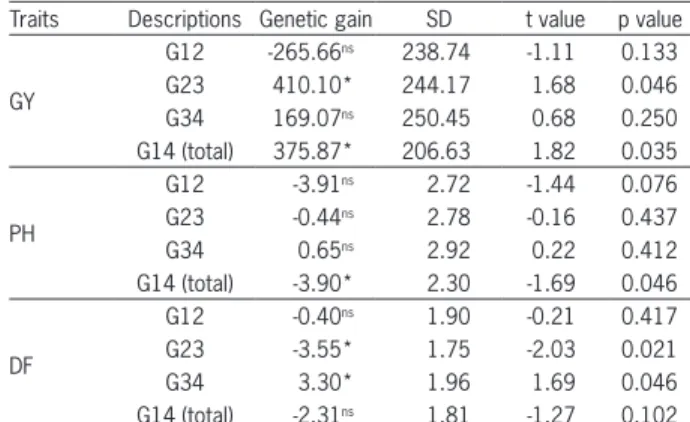
of recurrent selection. Rangel et al. (2002) estimated an average genetic gain of 1.56 % in the CNA-IRAT 4 population of irrigated rice subjected to three cycles of recurrent selection, a result similar to that observed in this study. When gains between cycles were compared, gains (p< 0.05) of 410.10 kg ha−1 between cycles 2 and
3 and of 375.87 kg ha−1 between the first and last cycle
(p < 0.05) were detected, considered satisfactory for the period (Table 4).
The average PH of the S0:2 progenies (BLUE) was higher than the overall average PH of checks in all selec-tion cycles but similar to the average PH of the Guarani check in cycle 1 and the average PH of the BRS Sertaneja check in the last cycle. After the strong selection pres-sure in cycle 2 to reduce the plant height, the BLUEs remained constant and the amplitudes of variation re-turned to baseline levels (Figure 2).
According to the generalized linear regression anal-ysis adjusted for the averages of S0:2 progenies (BLUE), no genetic gain (p > 0.05) in PH was observed (Figure 2 and Table 3). Breseghello et al. (2009) also observed no genetic gain (p > 0.05) in PH in upland rice. However, when comparing the gains between cycles, a total gain of -3.90 cm was detected (p <0.05) (Table 4). The low gains in PH may have resulted from the use of genetic male sterility, controlled by a recessive gene (ms), in the recombination, because the taller male fertile plants are favored by better dispersion of pollen grains than shorter male fertile plants. Thus, a rouging of the tall-est plants during the recombination of each cycle of the CNA6 population is recommended.
The average DF was higher in S0:2 progenies (BLUE) than in the checks only in cycle 1, with similar magnitudes in the other cycles (Figure 2). In cycle 3, a marked reduction was observed in the average DF of S0:2 progenies, possibly due to the strong selection for earli-ness in the previous generation (S0:1 progenies). Howev-er, in cycle 4, the average BLUE of the S0:2 progenies
re-Table 4 − Estimates of genetic gains between cycles, first-second cycle (G12), second-third cycle (G23), third-fourth cycle (G34) and first-fourth (G14), with the respective standard deviations (SD), for grain yield (GY, kg ha−1), plant height (PH, cm) and
days-to-flowering (DF, days).
Traits Descriptions Genetic gain SD t value p value
GY
G12 -265.66ns 238.74 -1.11 0.133
G23 410.10* 244.17 1.68 0.046
G34 169.07ns 250.45 0.68 0.250
G14 (total) 375.87* 206.63 1.82 0.035
PH
G12 -3.91ns 2.72 -1.44 0.076
G23 -0.44ns 2.78 -0.16 0.437
G34 0.65ns 2.92 0.22 0.412
G14 (total) -3.90* 2.30 -1.69 0.046
DF
G12 -0.40ns 1.90 -0.21 0.417
G23 -3.55* 1.75 -2.03 0.021
G34 3.30* 1.96 1.69 0.046
G14 (total) -2.31ns 1.81 -1.27 0.102 ns and *not significant and significant at 5 % level by t-test, respectively.
Table 3 − Estimates of linear regression parameters, with first cycle mean ( ), angular coefficient ( ), standard deviation (SD), coefficient of experimental variation (CV %) and respective annual average genetic gains (GA%), per cycle (G%) and total (GT%), for grain yield (GY, kg ha−1), plant height (PH, cm) and
days-to-flowering (DF, days).
Parameters Traits
GY PH DF
2,661.37 108.63 78.27
(gain per cycle) 125.29* -1.30ns-0.77ns
SD 75.85 91.86 66.55
t value 1.65 -1.41 -1.15
p value (Ho:b1=0) 0.050 0.079 0.124
CV % 16.31 4.95 1.01
GA % 1.54 -0.40 -0.33
G % (3 years) 4.71 -1.20 -0.98
GT %(9 years) 14.80 -3.55 -2.92
turned to the levels observed in cycle 2. The restoration of the average DF in cycle 4 may have occurred because male sterile plants occurred with a frequency of during the recombination phase and because earliness was not favored in field recombination.
Taking the linear regression analysis into account, no genetic gains (p > 0.05) in DF were detected (Figure 2 and Table 3). However, a reduction of 3.55 days (p < 0.05) was detected between cycles 2 and 3 and an in-crease of 3.30 days was detected between cycles 3 and 4 (Table 4). Between cycles 1 and 2, no selection for DF was performed, which explains the absence of genetic gain. The oscillations in gains between cycles and the coefficient of determination of only 11 % explain the absence of detected total gain in DF (Figure 2). The use of alternative selection criteria, such as the selection index, might have contributed to simultaneous gains in the different traits (Smith et al., 1981; Berilli et al., 2013).
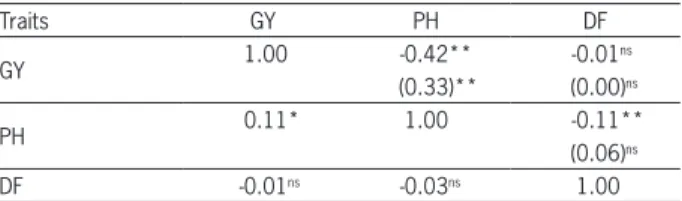
The estimates of genetic correlation coefficients corroborate results from genetic gains observed for the three traits (Table 5). The genetic correlation between GY and PH was negative ( =–0.42) and significant (p≤ 0.01), which was similar to the results verified by Breseghello et al. (2011). No genetic correlation was de-tected between GY and DF ( =–0.01) and a weak nega-tive genetic correlation ( =–0.11, p ≤ 0.01) was verified between PH and DF. Thus, these estimates of genetic correlation explain the possibility of obtaining genetic progress simultaneously for increasing grain yield and reducing plant height, but with some difficulty for earli-ness, because the progenies with lower plant height tend to have a longer cycle in the CNA6 population.
Based on estimates of the expected proportion of superior inbred lines (PS) as a function of the average values of checks in each selection cycle calculated for traits GY, PH and DF (Table 6), there were no differ-ences (p > 0.05) in PS between two assumptions consid-ered (average degree of dominance, add, equal to zero or 1). Thus, the dominance variance ( ) was confirmed as having a negligible influence compared to the addi-tive variance ( ). This result corroborated with Santos et al. (2002), who similarly argued that the dominance variance had a minimal impact on trait because the mag-nitude of the coefficient associated with this parameter was low, i.e., equal to (Cockerham, 1963).
Among the cycles, there was considerable varia-tion in PS in traits under the two assumpvaria-tions. Differ-ences (p < 0.05) in PS between cycles were found for GY, being strongly reduced in cycle 2 (with an estimate of zero), doubled in cycle 3 and 4.5 times higher in cycle 4 than in the first cycle. For PH, the largest PS values were detected in cycles 2 and 3, with values approxi-mately three times higher than those observed in the first cycle. For DF, the PS remained constant in all cycles except cycle 3, where the estimate was twice as high as that of the first cycle, mainly due to the strong selection for earliness in the S0:1 progenies in cycle 3.
Table 5 − Estimates of genetic correlation coefficient (above the diagonal), environment correlation (in parenthesis) and phenotypic correlation (below the diagonal) between grain yield (GY, kg ha−1),
plant height (PH, cm) and days-to-flowering (DF, days), obtained from S0:2 progenies during the four cycles of recurrent selection.
Traits GY PH DF
GY 1.00 -0.42** -0.01
ns
(0.33)** (0.00)ns
PH 0.11* 1.00 -0.11**
(0.06)ns
DF -0.01ns -0.03ns 1.00
ns, * and **not significant, significant at 5 and 1 % levels by t-test, respectively.
Table 6 − Estimates of the proportion of superior inbred lines (PS) that are expected from each cycle of recurrent selection, considering two suppositions: average degree of dominance (add) equal to zero [PS (add=0)] and add equal to 1 [PS (add=1)], for grain yield (GY, kg ha−1), plant height (PH, cm) and
days-to-flowering (DF, days).
Traits‡ Parameters Cycle 1 Cycle 2 Cycle 3 Cycle 4
GY [PS (add = 0)] 0.064 0.000 0.118 0.286
[PS (add = 1)] 0.057 0.000 0.111 0.280
PH [PS (add = 0)] 0.100 0.345 0.388 0.240
[PS (add = 1)] 0.094 0.341 0.385 0.233
DF [PS (add = 0)] 0.437 0.426 0.883 0.394
[PS (add = 1)] 0.435 0.424 0.890 0.391 ‡The standard values equal to check means ( ), being 3,401.17 kg ha−1, 103.11 cm and 76.76 days, for GY, PH and DF, respectively.
An association between the average trait value of a cycle (Figure 2) and the estimated PS (Table 6) was observed for the three traits, i.e., cycles with more fa-vorable average values of a given trait expressed greater potential to generate superior inbred lines as the magni-tude of genetic variability among S0:2 progenies did not narrow across the cycles. Similar results were found in other studies with rice (Santos et al., 2002). These re-searchers, however, did not apply the method of Jinks and Pooni (1976) in populations under recurrent selec-tion, so that the results of these studies could not be compared with the estimates of the present study.
Superior populations have higher average and de-sired genetic variability for a given trait. However, in certain cases, a negative association exists between high average values and genetic variability, i.e., high average values coincide with low genetic variance (Santos et al., 2002). In this case, predictive methods, such as that of Jinks and Pooni (1976), are very useful for identifying the most promising populations that can generate the genotypes desired.
average values of these traits improved during selection. Although no genetic gain was observed for DF, the genetic potential for this trait was nearly constant in the popula-tion during the first and last selecpopula-tion cycles (Table 6).
The contrasts in PS between cycles in the CNA6 population were alternately positive and negative; how-ever, the magnitude and direction of the changes were not constant during the recurrent selection cycles for any of the traits (Table 6). This reinforces the importance of efficiency in the selection of the S0:2 progenies for re-combination and the need to simultaneously consider all traits of interest to the program during selection. Indeed, during this process, important alleles can be lost, which precludes significant and equivalent genetic gains for all traits considered in the selection. This hypothesis may explain the reduced genetic gains in PH and DF and the gains in GY, as the selection intensity applied for a given trait and between traits changes with cycles.
The results of this study confirm the success of the recurrent selection method for obtaining genetic gains for quantitative traits in autogamous species. After three cycles of recurrent selection, Breseghello et al. (2009) and Rangel et al. (2002) reported average genetic gains per cycle of 3.6 % and 4.6 % for grain yield, respectively, in upland and lowland rice, using S0:2 progenies. In soybean, Rose et al. (1992) observed that the average genetic gain per cycle was 5.4 % for grain yield of S0:2 progenies, after five cycles of recurrent selection. In oats, Holland et al. (2000) obtained average genetic gain of 2.6 % during three cycles of recurrent selection for grain yield of S0:1 prog-enies. Niu et al. (2010) evaluated S0:1 progenies of wheat in two cycles of recurrent selection and observed that the average genetic gain per cycle was 2.4 % for grain yield. Silva et al. (2010) reported the average genetic gain per cycle of 3.3 % for grain yield of S0:2 progenies of common bean, after eight cycles of recurrent selection. Therefore, several studies allowed for inferring that the use of re-current selection method in autogamous crops enables continuous population improvement through progressive cycles, resulting in new superior populations.
These results were achieved because each cycle of recurrent selection resulted in increased frequency of favorable alleles of the quantitative trait under selec-tion and progressive populaselec-tion improvement. However, care must be taken for the genetic variability not to be eroded, mainly through knowledge of the effective size (Ne) of the unit of recombination to use adequate sam-ple sizes, so that amplitude is maintained to allow for improvement by selection and recombination in subse-quent cycles.
In this study, genetic progress in grain yield and plant height was achieved after four cycles of recurrent selection of the CNA6 population of upland rice, con-ducted over a period of 17 years. Selection cycles effec-tively increased the genetic potential of the population to generate superior inbred lines for grain yield and height plant while maintaining the genetic potential for days-to-flowering.
Acknowledgements
The authors would like to thank the entire rice breeding team of Embrapa, especially the research as-sistants and field workers who performed the field trials and collected the data used in our study. We also wish to thank the supporting agency, Coordination for the Improvement of Higher Level Personnel (CAPES), for granting a scholarship to the first author.
References
Abreu, A.F.B.; Ramalho, M.A.P.; Santos, J.B. 2002. Prediction of seed-yield potential of common bean populations. Genetics and Molecular Biology 25: 323-327.
Berilli, A.P.C.G.; Pereira, M.G.; Trindade, R.D.S.; Costa, F.R.D.; Cunha, K.S.D. 2013. Response to the selection in the 11th cycle of reciprocal recurrent selection among full-sib families of maize. Acta Scientiarum, Agronomy 35: 435-441.
Breseghello, F.; Morais, O.P.; Rangel, P.H.N. 1998. A new method to estimate genetic gain in annual crops. Genetics and Molecular Biology 21: 551-555.
Breseghello, F.; Morais, O.P.; Castro, E.M.; Prabhu, S.A.; Bassinello, P.Z.; Pereira, J.P.; Utumi, M.M.; Ferreira, M.E.; Soares, A.A. 2009. Recurrent selection resulted in rapid genetic gain for upland rice in Brazil. International Rice Research Notes 34: 1-4.
Breseghello, F.; Morais, O.P.; Pinheiro, P.V.; Silva, A.C.S.; Castro, E.M.; Guimarães, E.P.; Castro, A.P.; Pereira, J.A.; Lopes, A.M.; Utumid, M.M.; Oliveira, J.P. 2011. Results of 25 years of upland rice breeding in Brazil. Crop Science 51: 914-923.
Cockerham, C.C. 1963. Estimation of genetic variances. p. 53-94. In: Hanson, W.D.; Robinson, H.F., eds. Statistical genetics and plant breeding. National Academy of Science, Washington, DC, USA.
Cockerham, C.C. 1983. Covariances of relatives from self-fertilization. Crop Science 23: 1177-1180.
Colombari Filho, J.M.; Resende, M.D.V.; Morais, O.P.; Castro, A.P.; Guimarães, E.P.; Pereira, J.A.; Utumi, M.M.; Breseghello, F. 2013. Upland rice breeding in Brazil: a simultaneous genotypic evaluation of stability, adaptability and grain yield. Euphytica 192: 117-129.
Duarte, J.B.; Vencovsky, R.; Dias, C.T.S. 2001. Estimators of variance components in the augmented block design with new treatments of one or more populations. Pesquisa Agropecuária Brasileira 36: 1155-1167 (in Portuguese, with abstract in English).
Federer, W.T. 1956. Augmented (or hoonuiaku) designs. Hawaiian Planter’s Record 55: 191-208.
Fujimaki, H. 1979. Recurrent selection by using genetic male sterility for rice improvement. Japan Agricultural Research Quarterly 13: 153-l56.
Hallauer, A.R.; Miranda Filho, J.B.; Carena, M.J. 2010. Quantitative Genetics in Maize Breeding. Iowa State University, Ames, IA, USA.
Holland, J.B.; Bjørnstad, Å.; Frey, K.J.; Gullord, M.; Wesenberg, D.M.; Buraas, T. 2000. Recurrent selection in oat for adaptation to diverse environments. Euphytica 113: 195-205.
Jinks, J.L.; Pooni, H.S. 1976. Predicting the properties of recombinant inbreed lines derived by single seed descent. Heredity 36: 243-266.
Morais, O.P. 2005. Genetic mean and variability in recurrent selection. p. 19-35. In: Guimarães, E.P., ed. Population improvement: a way of exploiting the rice genetic resources of Latin America. Food and Agriculture Organization, Rome, Italy.
Niu, N.; Arief, V.N.; Delacy, I.H.; Lush, D.; Sheppard, J.; Zhang, G.; Dieters, M.J. 2010. Genetic gain in yield and protein over two cycles of a wheat recurrent selection program. Breeding Science 60: 181-186.
Pereira, J.A.; Morais, O.P.; Breseghello, F. 2008. Analysis of heterosis in crosses between varieties of red rice. Pesquisa Agropecuária Brasileira 43: 1135-1142 (in Portuguese, with abstract in English).
Pinheiro, B.S.; Castro, E.M.; Guimarães, C.M. 2006. Sustainability and profitability of aerobic rice production in Brazil. Field Crops Research 97: 34-42.
Rangel, P.H.N.; Morais, O.P.; Zimmermann, F.J.P. 2002. Grain yield gains in three recurrent selection cycles in the CNA-IRAT 4 irrigated rice population. Crop Breeding and applied Biotechnology 2: 369-374.
Rangel, P.H.N.; Brondani, C.; Morais, O.P.; Schiocchet, M.A.; Borba, T.C.O.; Rangel, P.N.; Brondani, R.P.V.; Yokoyama, S.; Bacha, R.E.; Ishiy, T. 2007. Establishment of the irrigated rice cultivar SCSBRS Tio Taka by recurrent selection. Crop Breeding and Applied Biotechnology 7: 103-110.
Rose, J.L.; Butler, D.G.; Ryley, M.J. 1992. Yield improvement in soybeans using recurrent selection. Australian Journal of Agricultural Research 43: 135-144.
Santos, P.G.; Soares, A.A.; Ramalho, M.A.P. 2002. Performance of upland rice families selected from segregant populations. Crop Breeding and Applied Biotechnology 2: 237-246.
Searle, S.R. 1971. Linear Models. John Wiley, New York, NY, USA.
Searle, S.R.; Casella, G.; McCulloch, C.E. 1992. Variance Components. John Wiley, New York, NY, USA.
Singh, R.J.; Ikehashi, H.I. 1981. Monogenic male-sterility in rice: introduction, identification and inheritance. Crop Science 21: 286-289.
Silva, G.S.; Ramalho, M.A.P.; Abreu, A.F.B.; Nunes, J.A.R. 2010. Estimation of genetic progress after eight cycles of recurrent selection for common bean grain yield. Crop Breeding and Applied Biotechnology 10: 351-356.
Smith, O.; Hallauer, A.; Russell, W. 1981. Use of index selection in recurrent selection programs in maize. Euphytica 30: 611-618. Snape, J.W. 1982. Predicting the frequencies of transgressive
segregants for yield and yield components in wheat. Theoretical and Applied Genetics 62: 127-134.
Soares, A.A.; Santos, P.G.; Morais, O.P.; Soares, P.C.; Reis, M.D.S.; Souza, M.A. 1999. Genetic progress obtained by upland rice breeding in twenty one years of research in the state of Minas Gerais, Brazil. Pesquisa Agropecuária Brasileira 34: 415-424 (in Portuguese, with abstract in English).
Souza, M.A.; Morais, O.P.; Herán, R.E.C.; Cargnin, A.; Pimentel, A.J.B. 2007. Genetic progress in improving upland rice in the period 1950-2001. Pesquisa Agropecuária Brasileira 42: 371-376 (in Portuguese, with abstract in English).
Steel, R.G.D.; Torrie, J.L. 1960. Principles and Procedures of Statistics. McGraw-Hill, New York, NY, USA.
Toledo, J.F.F.; Miranda Filho, J.B. 1985. Prediction of open pollinating populations for the production of superior hybrids. Theoretical and Applied Genetics 71: 563-569.
Toledo, J.F.F. 1987. Predicting the inbreeding and the outcrossing potential of soybean (Glycine max L.) varieties. Brazilian Journal of Genetics 10: 543-558.
Triller, C.; Toledo, J.F.F. 1996. Using the F3 generation for predicting the breeding potential of soybean crosses. Brazilian Journal of Genetics 19: 289-294.