CPD
4, 761–789, 2008Glacial terminations in the EPICA Dome C
ice core record
R. R ¨othlisberger et al.
Title Page
Abstract Introduction
Conclusions References
Tables Figures
◭ ◮
◭ ◮
Back Close
Full Screen / Esc
Printer-friendly Version
Interactive Discussion
Clim. Past Discuss., 4, 761–789, 2008 www.clim-past-discuss.net/4/761/2008/
© Author(s) 2008. This work is distributed under the Creative Commons Attribution 3.0 License.
Climate of the Past Discussions
Climate of the Past Discussionsis the access reviewed discussion forum ofClimate of the Past
The southern hemisphere at glacial
terminations: insights from the Dome C
ice core
R. R ¨othlisberger1, M. Mudelsee1,2, M. Bigler3, M. de Angelis4, H. Fischer5,6, M. Hansson7, F. Lambert6, V. Masson-Delmotte8, L. Sime1, R. Udisti9, and E. W. Wolff1
1
British Antarctic Survey, Natural Environment Research Council, Cambridge, UK
2
Climate Risk Analysis, Hannover, Germany
3
Niels Bohr Institute, University of Copenhagen, Denmark
4
Laboratoire de Glaciologie et G ´eophysique de l’Environnement, Grenoble, France
5
Alfred Wegener Institut, Bremerhaven, Germany
6
Climate and Environmental Physics, University of Bern, Switzerland
7
Department of Physical Geography and Quaternary Geology, Stockholm University, Sweden
8
Laboratoire des Sciences du Climat et de l’Environnement, Gif-sur-Yvette, France
9
Department of Chemistry, University of Florence, Italy
Received: 21 May 2008 – Accepted: 23 May 2008 – Published: 19 June 2008 Correspondence to: R. R ¨othlisberger ([email protected])
CPD
4, 761–789, 2008Glacial terminations in the EPICA Dome C
ice core record
R. R ¨othlisberger et al.
Title Page
Abstract Introduction
Conclusions References
Tables Figures
◭ ◮
◭ ◮
Back Close
Full Screen / Esc
Printer-friendly Version
Interactive Discussion
Abstract
The many different proxy records from the European Project for Ice Coring in Antarctica (EPICA) Dome C ice core allow for the first time a comparison of nine glacial termina-tions in great detail. Despite the fact that all terminatermina-tions cover the transition from a glacial maximum into an interglacial, there are large differences between single
ter-5
minations. For some terminations, Antarctic temperature increased only moderately, while for others, the amplitude of change at the termination was much larger. For the different terminations, the rate of change in temperature is more similar than the mag-nitude or duration of change. These temperature changes were accompanied by vast changes in dust and sea salt deposition all over Antarctica.
10
Here we investigate the phasing between a South American dust proxy (non-sea-salt calcium flux, nssCa), a sea ice proxy (sea (non-sea-salt sodium flux, ssNa) and a proxy for Antarctic temperature (deuterium, δD). In particular, we look into whether a similar sequence of events applies to all terminations, despite their different characteristics. All proxies are derived from the EPICA Dome C ice core, resulting in a relative dating
15
uncertainty between the proxies of less than 20 years.
At the start of the terminations, the temperature (δD) increase and dust (nssCa flux) decrease start synchronously. The sea ice proxy (ssNa flux), however, only changes once the temperature has reached a particular threshold, approximately 5◦C below present day temperatures (corresponding to aδD value of –420‰). This reflects to a
20
large extent the limited sensitivity of the sea ice proxy during very cold periods with large sea ice extent. At terminations where this threshold is not reached (TVI, TVIII), ssNa flux shows no changes. Above this threshold, the sea ice proxy is closely coupled to the Antarctic temperature, and interglacial levels are reached at the same time for both ssNa andδD.
25
On the other hand, once another threshold at approximately 2◦C below present
CPD
4, 761–789, 2008Glacial terminations in the EPICA Dome C
ice core record
R. R ¨othlisberger et al.
Title Page
Abstract Introduction
Conclusions References
Tables Figures
◭ ◮
◭ ◮
Back Close
Full Screen / Esc
Printer-friendly Version
Interactive Discussion
This threshold behaviour most likely results from a combination of changes to the threshold friction velocity for dust entrainment and to the distribution of surface wind speeds in the dust source region.
1 Introduction
The climate of the late Quaternary has been marked by repeated changes between
5
glacial and interglacial periods. The reasons for such changes are still not entirely understood, although it seems clear that orbital forcing and internal feedback mecha-nisms involving greenhouse gases play a vital role (Huybers, 2006; K ¨ohler and Fischer, 2006 and references therein). There are various processes that are influenced by and that exert an influence on the evolution of temperature and atmospheric CO2. In high 10
southern latitudes, the impact of sea ice extent and its connection to southern hemi-sphere winds and other factors that may contribute to ocean upwelling are of particular interest (Le Quere et al., 2007; Toggweiler et al., 2006).
The ice core from Dome C, Antarctica, that has been drilled in the framework of the European Project for Ice Coring in Antarctica (EPICA), provides a record of the last
15
nine glacial – interglacial terminations in terms of changes in high latitude temperature (Jouzel et al., 2007), changes in greenhouse gases (Siegenthaler et al., 2005; Spahni et al., 2005) and various aerosols (Lambert et al., 2008; Wolffet al., 2006). Here we look into the pattern and phasing at terminations in different parameters, namelyδD representing Antarctic temperature, nssCa flux, a proxy for aspects of South American
20
climate (R ¨othlisberger et al., 2002; Wolffet al., 2006), and ssNa flux, which is related to the sea ice extent around Antarctica (Wagenbach et al., 1998; Wolff et al., 2003). The aim is to identify robust pattern and phase-relationships at glacial terminations between Antarctic temperature, South American conditions and the sea ice based on the ice core record from Dome C.
25
param-CPD
4, 761–789, 2008Glacial terminations in the EPICA Dome C
ice core record
R. R ¨othlisberger et al.
Title Page
Abstract Introduction
Conclusions References
Tables Figures
◭ ◮
◭ ◮
Back Close
Full Screen / Esc
Printer-friendly Version
Interactive Discussion
eters is always much smaller than the resolution of δD. Therefore, the data offers excellent control of the relative timing between the proxies. However, the uncertainty of the absolute age is estimated 3 ka at 100 ka BP and approximately 6 ka for older sections of the ice core. In terms of event durations, the accuracy of the chronology is estimated to be 20% back to 410 ka BP and possibly 40% for older sections (Parrenin
5
et al., 2007).
2 Methods
2.1 Data
The ice core was drilled from 1996 to 2004 and has been analysed for stable water isotopes (δD, Jouzel et al., 2007) at 55 cm resolution. The analysis of the soluble
im-10
purities (e.g. sodium (Na+) and calcium (Ca2+)) has been done by seven European laboratories with different methods (R ¨othlisberger et al., 20081), and low-resolution data along most of the core, using a previous age-scale, have already been published (Wolffet al., 2006). In this study, we used the data obtained by continuous flow anal-ysis (CFA), (R ¨othlisberger et al., 2000), which resulted in a high-resolution record (of
15
the order of 1 cm, corresponding to less than a year in the Holocene, approximately 3 years at 410 ka BP during marine isotope stage (MIS) 11, and 20 years at 800 ka BP during MIS 20). In the top part (0 to 450 ka BP), these data were downsampled to 20 years resolution by using the median of the data in each 20-a interval in order to reduce the computing time. Below that, computing time was within reasonable limits
20
for the high-resolution data, so that 1 cm data were used for further analysis. Fluxes,
1
CPD
4, 761–789, 2008Glacial terminations in the EPICA Dome C
ice core record
R. R ¨othlisberger et al.
Title Page
Abstract Introduction
Conclusions References
Tables Figures
◭ ◮
◭ ◮
Back Close
Full Screen / Esc
Printer-friendly Version
Interactive Discussion
being representative of atmospheric concentrations at sites where dry deposition is assumed to dominate, were calculated using the accumulation rates derived from the EDC3 timescale (Parrenin et al., 2007) (Fig. 1). The change points in accumulation rate are different from the change points in nssCa and ssNa flux, thus the uncertainty in reconstructing accumulation rate will translate into the ssNa and nssCa fluxes.
How-5
ever, in view of flux changes of the order of a factor of 2 to 4 in ssNa fluxes and 7 to 30 in nssCa fluxes over the nine glacial-interglacial terminations, the 30% uncertainty in accumulation rate is relatively small.
Both Ca and Na in the ice core originate from sea salt aerosol and terrestrial dust. However, Ca is predominantly of terrestrial origin, while Na derives mainly from sea
10
salt. We calculated the non-sea-salt fraction of Ca of terrestrial origin (nssCa) and the sea-salt fraction of Na (ssNa) as in (R ¨othlisberger et al., 2002), using a Ca/Na weight ratio of 1.78 for terrestrial material (Rt), and 0.038 for sea water (Rm). The contribution from crustal material to total Na depends on the composition of the dust source material, and higher ratios Rt of the terrestrial source material could be used
15
(Bigler et al., 2006), resulting in lower ssNa concentrations during glacial periods, but hardly any changes for interglacial periods. The effect of choosing different values for Rt on nssCa is negligible. For the aim of this study, the exact amplitude of glacial-interglacial changes in ssNa does not affect the timing of the changes, and the results remain within error bars regardless of which values are used to calculate ssNa and
20
nssCa.
The data presented here are on the EDC3 timescale (Parrenin et al., 2007). The uncertainty in absolute ages is of the order of 6000 a for ice older than 130 ka. How-ever, since all three records have been analysed on the same ice core, the uncertainty between nssCa flux, ssNa flux andδDis of the order of a few centimetres, i.e. always
25
CPD
4, 761–789, 2008Glacial terminations in the EPICA Dome C
ice core record
R. R ¨othlisberger et al.
Title Page
Abstract Introduction
Conclusions References
Tables Figures
◭ ◮
◭ ◮
Back Close
Full Screen / Esc
Printer-friendly Version
Interactive Discussion
2.2 RAMPFIT
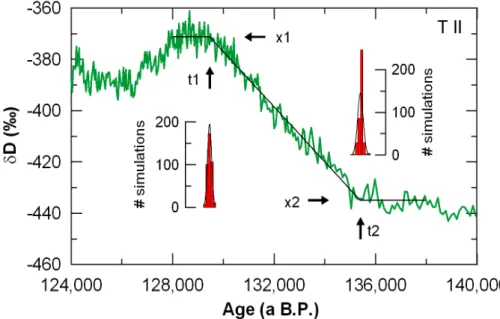
In order to estimate the exact timing of a glacial termination in an objective way, we used a regression approach (RAMPFIT, Mudelsee, 2000). RAMPFIT is a weighted least-squares method that fits a ramp to the data. It estimates the level of a parameter for glacial (x2) and interglacial (x1) conditions and a linear change between the change
5
points t1 and t2 (Fig. 2). A measure of the uncertainty of these estimated change points is based on a set of 400 bootstrap simulations for each parameter and each termination (Mudelsee, 2000;Politis and Romano, 1994).
A simulated time series is generated by adding a sequence of successive residuals to the fitted ramp. The length of the sequence of residuals is defined by the
persis-10
tence of the data (four times the persistence time), thus preserving the autoregressive properties of the original data in the simulated time series. The ramp fitting is then repeated on the simulated data, giving a set of simulated ramp parameters, t1∗, x1∗,
t2∗and x2∗. This procedure is repeated 400 times, and the standard deviation of these 400 t1∗ values is used as bootstrap standard error for t1 (see histograms in Fig. 2).
15
The bootstrap standard errors for x1, t2 and x2 were calculated analogously.
While the algorithm of RAMPFIT provides an objective estimate for the change points in a given data set, there are nevertheless some parameters that need to be chosen subjectively in the fitting procedure (e.g. the selection of the fit interval) that influence the result. For this study, we normally chose 2 ka beyond either end of the termination.
20
In some instances, we chose shorter intervals in order to exclude sections of the data that had large deviations from a constant level and would thus distort the ramp. The parameters used for each termination are listed in the supplementary material http:
//www.clim-past-discuss.net/4/761/2008/cpd-4-761-2008-supplement.pdf (Table S1). RAMPFIT minimizes the systematic deviations from constant glacial and interglacial
25
CPD
4, 761–789, 2008Glacial terminations in the EPICA Dome C
ice core record
R. R ¨othlisberger et al.
Title Page
Abstract Introduction
Conclusions References
Tables Figures
◭ ◮
◭ ◮
Back Close
Full Screen / Esc
Printer-friendly Version
Interactive Discussion
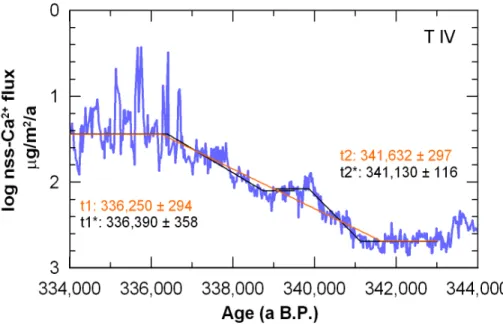
linearly, but may change slope over time. This is illustrated in Fig. 3, where the Termi-nation IV in nssCa flux is shown. Assuming a linear change over the entire termina-tion results in change points that deviate from the change points that result from the assumed two-step termination. Alternatively, the glacial or interglacial levels are not constant, as for example the interglacial levels inδD in Termination III and IV, which
5
reach high values early in the interglacial, but drop after a few thousand years (Fig. 4). This impacts the resulting levels and thus change points that RAMPFIT estimates. In other words, the choice of the fit interval used for RAMPFIT had some influence on the resulting change point estimates.
While we are aware of the limitations of the ramp model, we still think it provides
10
valuable insights into the phasing at glacial terminations. A model is supposed to bring out the major properties of a system rather than reflecting the full complexity of the data. Additional parameters in a model that would lead to a better fit between model and data do not necessarily improve the understanding of the system. In the case of quantifying phasing at glacial terminations as presented in this paper, we decided that
15
a ramp, and in some cases a two-step ramp, provides a sufficiently complex description of the data, especially for the main purpose of defining change points.
3 Results and discussion
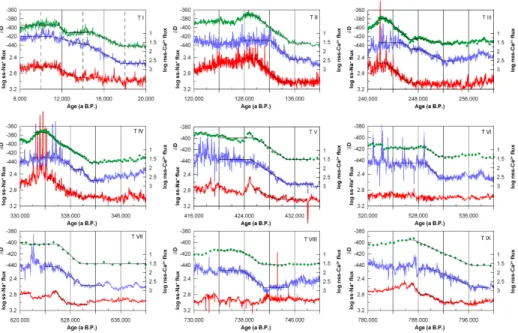
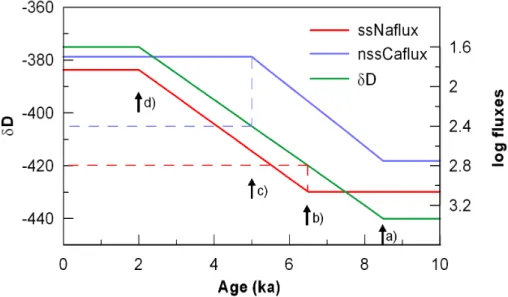
The final ramps as calculated using RAMPFIT are shown in Fig. 4 and the estimated change points and error estimates are given in Table 1. A schematic of a termination
20
is shown in Fig. 5. Across all terminations, δD and nssCa flux start to change syn-chronously (within error estimate, indicated by arrow a in Fig. 5), while ssNa flux shows a delayed onset of the glacial termination by a few thousand years (arrow b in Fig. 5). On the other hand, the end of the termination is normally synchronous between ssNa flux andδD(arrow d in Fig. 5). Interglacial levels of nssCa flux are either reached at
25
CPD
4, 761–789, 2008Glacial terminations in the EPICA Dome C
ice core record
R. R ¨othlisberger et al.
Title Page
Abstract Introduction
Conclusions References
Tables Figures
◭ ◮
◭ ◮
Back Close
Full Screen / Esc
Printer-friendly Version
Interactive Discussion
the amplitude of the temperature change was relatively small. In these terminations, ssNa flux did not change significantly.
TheδDin the ice core record is used primarily as a proxy for Antarctic temperature. However, especially at glacial terminations, other factors that have an influence onδD such as isotopic composition of seawater, moisture source region and local topography
5
changes potentially changed quite significantly too. Therefore, the timing of the change in temperature compared to the changes inδDmay be different. However, the change point estimates with RAMPFIT were also done on the reconstructed Dome C temper-ature Tsite (not shown), which takes changes in moisture source region into account
(Stenni et al., 2003). Estimates for the beginning of interglacial periods (t1) tend to be
10
a few hundred years later in Tsite than inδD, however, considering the uncertainty in the estimates, the change points were not significantly different from the change points estimated based onδD.
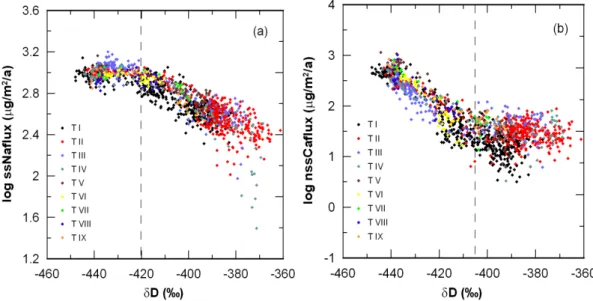
While the time difference between the start of the deglaciation inδDand the change point in ssNa flux tends to vary between 1 and 5 ka, the level of δD (–420±5‰) at
15
the beginning of the termination in ssNa flux (t2) seems to be nearly constant over all terminations (Table 2). Similarly, the timing of the end of the termination in nssCa flux (t1) andδD varies considerably (0 to 2.5 ka), but the level of δD (–402±8‰) is more or less constant (Table 2). In other words, there are threshold levels inδD that correspond to the onset of changes in ssNa flux and to the end of changes in nssCa
20
flux. These thresholds give rise to the apparent phase lags at the start or end of terminations. At glacial inceptions, the same threshold value seems to hold for ssNa flux (not shown). However, nssCa flux tends to build up more gradually at glacial inceptions. Nevertheless, the threshold found for glacial terminations defines the level below which the millennial-scale variability in nssCa flux correlates withδD.
25
CPD
4, 761–789, 2008Glacial terminations in the EPICA Dome C
ice core record
R. R ¨othlisberger et al.
Title Page
Abstract Introduction
Conclusions References
Tables Figures
◭ ◮
◭ ◮
Back Close
Full Screen / Esc
Printer-friendly Version
Interactive Discussion
than approx. –420‰ however, below that, the ssNa flux seems to stay more or less constant.
3.1 Coupling of South America and Antarctica
The generally close coupling between South American dust flux and Antarctic climate during cold glacial conditions has been discussed recently based on the dust particle
5
numbers in the Dome C ice core compared toδD(Lambert et al., 2008), and similar threshold levels below which the coupling manifests itself are derived. The factors that could influence the dust deposition in Antarctica are various parameters at the source (size of source area; conditions at the source, i.e. soil moisture, surface wind speed, vegetation, snow cover), atmospheric long-range transport (i.e. wind systems and wind
10
speed) as well as the atmospheric lifetime of the dust particles. The implication of the threshold is that there is a point in the evolution of the climate system (represented by Antarctic temperature) beyond which one or more of these factors either ceases to change or ceases to influence dust.
Based on various transport models, changes in long-range transport (e.g. shorter
15
transport times due to stronger winds) are unlikely to account for a large proportion of the observed changes (Krinner and Genthon, 2003; Lunt and Valdes, 2001), in line with evidence based on the size distribution of the dust particles (Lambert et al., 2008). Based on the comparison of the dust records from the two EPICA ice cores, Fischer et al. (2007) conclude that transport and lifetime effects have changed dust fluxes in
20
Antarctica by less than a factor of 2, while Lambert et al. (2008) suggest that approx-imately a factor 5 of the glacial-interglacial change in dust flux might be explained by changes to the atmospheric lifetime while another factor of 5 is due to changes at the source. However, the change in atmospheric lifetime due to a reduced hydrological cycle is difficult to quantify. Results from a dust tracer model forced by a GCM showed
25
CPD
4, 761–789, 2008Glacial terminations in the EPICA Dome C
ice core record
R. R ¨othlisberger et al.
Title Page
Abstract Introduction
Conclusions References
Tables Figures
◭ ◮
◭ ◮
Back Close
Full Screen / Esc
Printer-friendly Version
Interactive Discussion
soil moisture, with some contribution of decreased vegetation and increased land area during periods of low sea level.
Based on results from an atmospheric general circulation model (HadAM3), we looked into the relationship between changes in temperature at Dome C and various parameters of South American climate. It has been shown that the model provides
5
a good representation of the present-day westerlies (Sime et al., 20082) and modern Antarctic climatology (Connolley and Bracegirdle, 2007). In order to study the sensitiv-ity of the South American climate to changing conditions, several model experiments were run with the present-day setup but with imposed sea surface temperature (SST) anomalies (Sime et al., 20082). A robust result from all model experiments was the
10
weakening and southward shift of the westerly wind belt associated with a warming at Dome C (Fig. 7). The change in latitude is related to the SST gradient in the southern hemisphere. The sensitivity of this change may be slightly higher for colder Dome C temperatures. Dust entrainment is related to surface wind speed by a power law, so that a modest decrease in surface wind speed at the most relevant latitudes could lead
15
to a strong change in dust entrainment. This could therefore provide a link between the dust entrainment and the temperature at Dome C. The effect of changes in SST on dust entrainment may also be influenced by associated changes in precipitation. Increasing southern hemisphere SST leads to increased precipitation over Patagonia, therefore reducing the potential dust uplift due to raised soil moisture. Increased
pre-20
cipitation also promotes vegetation cover, as the major limiting factor for vegetation growth in Patagonia is precipitation (Markgraf et al., 2002), which further reduces dust uplift. Additionally, changes in South American topography due to ice cap disintegra-tion at glacial terminadisintegra-tions may have had an influence on wind pattern over the South American dust source.
25
From this analysis it is difficult to distinguish between the possible impacts of wind
2
CPD
4, 761–789, 2008Glacial terminations in the EPICA Dome C
ice core record
R. R ¨othlisberger et al.
Title Page
Abstract Introduction
Conclusions References
Tables Figures
◭ ◮
◭ ◮
Back Close
Full Screen / Esc
Printer-friendly Version
Interactive Discussion
shifts over dust source regions and of non-linear processes involved in dust entrain-ment. It is likely that the threshold velocity for dust entrainment was reduced during glacial periods due to less precipitation and therefore less vegetation cover. Addition-ally, the average wind speed was increased during glacial periods, and potentially also the gustiness (i.e. the likelihood of substantially higher than average wind speeds over
5
short periods of time). Due to the non-linear relationship between dust entrainment and wind speed, especially near an entrainment threshold, even small increases in average wind speeds and gustiness could have a significant impact on dust entrain-ment. The combination of the changes in wind speed distribution and threshold veloc-ity could qualitatively explain the observed threshold behaviour in the Dome C nssCa
10
flux record. However, from the rather low resolution model analysis it is difficult to dis-count the possibility that changes in the pattern of the South American winds relative to dust entrainment regions, related to ice-sheet changes or more general changes in the position of the westerlies, may have significantly affected the threshold behaviour we observe in the records.
15
3.2 Sea salt – sea ice relationship
In Antarctica, a large proportion of sea salt aerosol originates from sea ice surfaces rather than open water (Rankin et al., 2000; Wagenbach et al., 1998;Jourdain et al., 2008). Therefore, sea salt fluxes at Dome C have been used to infer past changes in sea ice extent in the Southern Ocean sector close to Dome C (Wolff et al., 2006;
20
Wolffet al., 2003). As a first order approximation, one would expect to see a coupling between Antarctic temperature and sea ice extent. This should manifest in a general agreement in theδD and ssNa flux records from Dome C. While there indeed seems to be a strong correlation betweenδD and ssNa during mild stages (r=–0.80, signif-icant at the 95% confidence level (Mudelsee, 2003), using 55 cm averages for ssNa
25
CPD
4, 761–789, 2008Glacial terminations in the EPICA Dome C
ice core record
R. R ¨othlisberger et al.
Title Page
Abstract Introduction
Conclusions References
Tables Figures
◭ ◮
◭ ◮
Back Close
Full Screen / Esc
Printer-friendly Version
Interactive Discussion
around Antarctica, extending to over a thousand kilometres from the coast into the Southern Ocean (Gersonde et al., 2005). Sea salt aerosol produced at the distant margin of the sea ice cover will need to be transported over such long distances before reaching Dome C. However, it has been shown that the atmospheric sea salt aerosol concentration rapidly decreases with increasing transport distance, with only a small
5
percentage of the original amount remaining after 500 km of transport (Minikin et al., 1994). Increasingly colder conditions will likely be accompanied by additional sea ice at the outer edge, at a distance of several hundred kilometres. But despite adding a considerable sea salt source area, the transport distance is so large that only a small fraction of this extra sea salt aerosol makes it to the East Antarctic plateau (Fischer
10
et al., 2007). Although this requires confirmation, it appears likely that eventually, the effect of additional sea ice cannot be discriminated any more in the sea salt records. In other words, sea salt flux as a proxy for sea ice reaches some sort of saturation.
In view of this, the delayed onset of changes in ssNa flux with respect to the start of the warming at glacial terminations can be seen as the time when the sea ice proxy
15
starts to respond to changes in sea ice again, i.e. when sea ice has retreated far enough so that further changes leave an imprint in the sea salt aerosol flux at Dome C. The end of the termination is synchronous inδDand ssNa, reflecting the expected relationship between Antarctic temperature and sea ice.
3.3 Rate of change
20
The results from RAMPFIT can also be used to calculate the rate of change over each glacial termination. The glacial – interglacial amplitude is estimated as the difference between x1 and x2, while the duration of a termination and its uncertainty were cal-culated directly by RAMPFIT. The uncertainty in duration, as well as in t1 and t2 for δD(see Table 1), is likely underestimated by RAMPFIT for Terminations VI, VII, VIII,
25
CPD
4, 761–789, 2008Glacial terminations in the EPICA Dome C
ice core record
R. R ¨othlisberger et al.
Title Page
Abstract Introduction
Conclusions References
Tables Figures
◭ ◮
◭ ◮
Back Close
Full Screen / Esc
Printer-friendly Version
Interactive Discussion
true uncertainty.
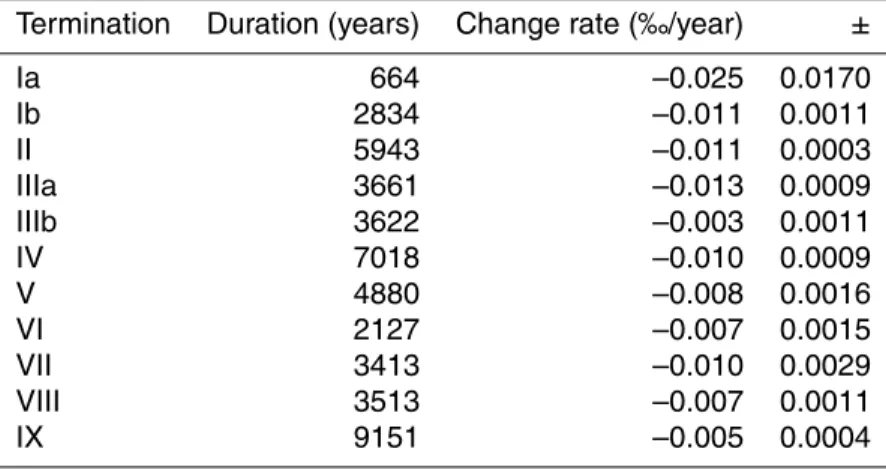
As seen in Fig. 8, the rate of change inδD was rather similar for all terminations, of the order of 0.01‰/year, which is equivalent to approximately 2◦C/ka. Only for the early part of Termination III and for Termination IX the temperature seemed to rise at a slower rate (see Table 3). This was also observed in the rate of change in nssCa
5
flux (not shown). The second warming step in Termination I, on the other hand, may have been exceptionally fast, as previously identified by (Masson-Delmotte et al., 2006) based on an independent analysis of the same data set. However, the uncertainty of this large rate of change is substantial, and the average rate of change observed during the other terminations lies well within the error bar. Generally, rates of change
10
for ssNa and nssCa flux over the corresponding intervals were also rather similar for all terminations. The first step in nssCa flux change at Termination IV was faster than average, however, it was followed by a period of rather constant nssCa flux (which was not seen inδD), before resuming the change into full interglacial conditions (see Fig. 4). Averaged over the entire Termination IV, the rate of change in nssCa flux was
15
very similar to the one observed at other terminations.
This implies that regardless of the final amplitude of the glacial – interglacial tem-perature change, the climate system keeps changing at a steady pace. The duration of the termination is therefore shorter in the case where the interglacial temperatures were cool compared to the cases where rather warm interglacial temperatures were
20
reached. This could be viewed as an external trigger (orbital forcing) timing the start of a glacial termination, but internal amplifiers and feedbacks governing the rate of change; the factors that determine at what point (in time or climate) the termination ends remain uncertain.
4 Conclusions
25
con-CPD
4, 761–789, 2008Glacial terminations in the EPICA Dome C
ice core record
R. R ¨othlisberger et al.
Title Page
Abstract Introduction
Conclusions References
Tables Figures
◭ ◮
◭ ◮
Back Close
Full Screen / Esc
Printer-friendly Version
Interactive Discussion
sistent pattern emerged, involving threshold values beyond which a coupling between Antarctic temperature and Patagonian dust proxy (nssCa flux) on the one hand and the response of the sea ice proxy (ssNa flux) on the other hand manifested itself.
Changes in South American dust emissions and Antarctic temperature are syn-chronous during cold glacial conditions but the dust response fades for conditions
5
warmer than approximately 2◦C below the present-day temperature at Dome C. The close link between dust and Antarctic temperature may be caused by the changes in wind pattern and precipitation over Patagonia that co-evolve with changes in tempera-ture at Dome C.
Sea salt aerosol is closely linked to Antarctic temperature for interglacial conditions
10
and conditions down to approximately 5◦C cooler than present day. For these con-ditions, sea salt aerosol at Dome C can be used as a first-order proxy of sea ice in the Indian Ocean sector around Antarctica. For colder climate, the proxy is reaching some sort of saturation and fails to respond to likely further increases in sea ice extent. One result of this analysis is that we are no longer safe in suggesting that sea ice
re-15
sponded late in terminations and using this to apportion causes of CO2 change; this
conclusion was probably an artefact of the apparent threshold in response to sea ice change (R ¨othlisberger et al., 2004; Wolffet al., 2006).
The rate of change over glacial terminations as determined from the duration and the amplitude of the changes inδD seems to be rather similar over all glacial
termi-20
nations. This suggests that once a glacial termination is triggered, the climate system progresses at its own pace. An exception with regard to this is a 3000 a period early on in Termination III where the rate of change seemed to be reduced significantly com-pared to the other terminations. It remains to be seen what caused this period to progress more slowly.
25
CPD
4, 761–789, 2008Glacial terminations in the EPICA Dome C
ice core record
R. R ¨othlisberger et al.
Title Page
Abstract Introduction
Conclusions References
Tables Figures
◭ ◮
◭ ◮
Back Close
Full Screen / Esc
Printer-friendly Version
Interactive Discussion
logistical support at Dome C was provided by IPEV and PNRA.
References
Bigler, M., R ¨othlisberger, R., Lambert, F., Stocker, T. F., and Wagenbach, D.: Aerosol deposited in East Antarctica over the last glacial cycle: Detailed apportionment of continental and sea-salt contributions, J. Geophys. Res., 111, D08205, doi:08210.01029/02005JD006469, 2006.
5
Connolley, W. M. and Bracegirdle, T. J.: An Antarctic assessment of IPCC AR4 coupled models, Geophys. Res. Lett., 34, L22505, doi:22510.21029/22007GL031648, 2007.
Fischer, H., Fundel, F., Ruth, U., Twarloh, B., Wegener, A., Udisti, R., Becagli, S., Castellano, E., Morganti, A., Severi, M., Wolff, E. W., Littot, G. C., R ¨othlisberger, R., Mulvaney, R., Hutterli, M. A., Kaufmann, P., Federer, U., Lambert, F., Bigler, M., Hansson, M., Jonsell,
10
U., De Angelis, M., Boutron, C., Siggaard-Andersen, M.-L., Steffensen, J. P., Barbante, C., Gaspari, V., Gabrielli, P., and Wagenbach, D.: Reconstruction of millennial changes in dust emission, transport and regional sea ice coverage using the deep EPICA ice cores from the Atlantic and Indian Ocean sector of Antarctica, Earth Planet. Sci. Lett., 260, 340–354, 2007. Gersonde, R., Crosta, X., Abelmann, A., and Armand, L.: Sea-surface temperature and sea ice
15
distribution of the Southern Ocean at the EPILOG Last Glacial Maximum–a circum-Antarctic view based on siliceous microfossil records, Quat. Sci. Rev., 24, 869–896, 2005.
Huybers, P.: Early Pleistocene glacial cycles and the integrated summer insolation forcing, Science, 313, 508–511, 2006.
Jourdain, B., Preunkert, S., Cerri, O., Castebrunet, H., Udisti, R., and Legrand, M. R.: Year
20
round record of size-segregated aerosol composition in central Antarctica (Concordia sta-tion): Implications for the degree of fractionation of sea-salt particles, J. Geophys. Res., doi:10.1029/2007JD009584, in press, 2008.
Jouzel, J., Masson-Delmotte, V., Cattani, O., Dreyfus, G., Falourd, S., Hoffmann, G., Minster, B., Nouet, J., Barnola, J. M., Chappellaz, J., Fischer, H., Gallet, J. C., Johnsen, S., Leuenberger,
25
M., Loulergue, L., Luethi, D., Oerter, H., Parrenin, F., Raisbeck, G., Raynaud, D., Schilt, A., Schwander, J., Selmo, E., Souchez, R., Spahni, R., Stauffer, B., Steffensen, J. P., Stenni, B., Stocker, T. F., Tison, J. L., Werner, M., and Wolff, E. W.: Orbital and Millennial Antarctic Climate Variability over the Past 800 000 Years, Science, 317, 793–796, 2007.
K ¨ohler, P. and Fischer, H.: Simulating low frequency changes in atmospheric CO2 during the
CPD
4, 761–789, 2008Glacial terminations in the EPICA Dome C
ice core record
R. R ¨othlisberger et al.
Title Page
Abstract Introduction
Conclusions References
Tables Figures
◭ ◮
◭ ◮
Back Close
Full Screen / Esc
Printer-friendly Version
Interactive Discussion
last 740 000 years, Clim. Past, 2, 57–78, 2006,
http://www.clim-past.net/2/57/2006/.
Krinner, G. and Genthon, C.: Tropospheric transport of continental tracers towards Antarctica under varying climatic conditions, Tellus, 55B, 54–70, 2003.
Lambert, F., Delmonte, B., Petit, J.-R., Bigler, M., Kaufmann, P., Hutterli, M. A., Stocker, T.
5
F., Ruth, U., Steffensen, J. P., and Maggi, V.: Dust-climate couplings over the past 800,000 years from the EPICA Dome C ice core, Nature, 452, 616–619, 2008.
Le Quere, C., Rodenbeck, C., Buitenhuis, E. T., Conway, T. J., Langenfelds, R., Gomez, A., Labuschagne, C., Ramonet, M., Nakazawa, T., Metzl, N., Gillett, N., and Heimann, M.: Sat-uration of the Southern Ocean CO2 Sink Due to Recent Climate Change, Science, 316,
10
1735–1738, 2007.
Lunt, D. J. and Valdes, P. J.: Dust transport to Dome C, Antarctica at the Last Glacial Maximum and present day, Geophys. Res. Lett., 28, 295–298, 2001.
Lunt, D. J. and Valdes, P. J.: Dust deposition and provenance at the Last Glacial Maximum and present day, Geophys. Res. Lett., 29, 2085, doi:2010.1029/2002GL015656, 2002.
15
Markgraf, V., Webb, R. S., Anderson, K. H., and Anderson, L.: Modern pollen/climate calibration for southern South America, Palaeogeography, Palaeoclimatology, Palaeoecology, 181, 375– 397, 2002.
Masson-Delmotte, V., Dreyfus, G., Braconnot, P., Johnsen, S., Jouzel, J., Kageyama, M., Landais, A., Loutre, M.-F., Nouet, J., Parrenin, F., Raynaud, D., Stenni, B., and Tuenter, E.:
20
Past temperature reconstructions from deep ice cores: relevance for future climate change, Clim. Past, 2, 145–165, 2006,
http://www.clim-past.net/2/145/2006/.
Minikin, A., Wagenbach, D., Graf, W., and Kipfstuhl, J.: Spatial and seasonal variations of the snow chemistry at the central Filchner-Ronne Ice Shelf, Antarctica, Ann. Glaciol., 20,
25
283–290, 1994.
Mudelsee, M.: Ramp function regression: a tool for quantifying climate transitions, Computers and Geosciences, 26, 293–307, 2000.
Mudelsee, M.: Estimating Pearson’s Correlation Coefficient With Bootstrap Confidence Interval From Serially Dependent Time Series, Mathematical Geology, 35, 651–665, 2003.
30
CPD
4, 761–789, 2008Glacial terminations in the EPICA Dome C
ice core record
R. R ¨othlisberger et al.
Title Page
Abstract Introduction
Conclusions References
Tables Figures
◭ ◮
◭ ◮
Back Close
Full Screen / Esc
Printer-friendly Version
Interactive Discussion
Severi, M., Spahni, R., Steffensen, J. P., Svensson, A., Udisti, R., Waelbroeck, C., and Wolff, E.: The EDC3 chronology for the EPICA dome C ice core, Climate of the Past, 3, 485–497, 2007.
Politis, D. N. and Romano, J. P.: The stationary bootstrap, J. Am. Stat. Assoc., 89, 1303–1313, 1994.
5
Rankin, A. M., Auld, V., and Wolff, E. W.: Frost flowers as a source of fractionated sea salt aerosol in the polar regions, Geophys. Res. Lett., 27, 3469–3472, 2000.
R ¨othlisberger, R., Bigler, M., Hutterli, M., Sommer, S., Stauffer, B., Junghans, H. G., and Wa-genbach, D.: Technique for continuous high-resolution analysis of trace substances in firn and ice cores, Environ. Sci. Technol., 34, 338–342, 2000.
10
R ¨othlisberger, R., Mulvaney, R., Wolff, E. W., Hutterli, M. A., Bigler, M., Sommer, S., and Jouzel, J.: Dust and sea-salt variability in central East Antarctica (Dome C) over the last 45 kyrs and its implications for southern high-latitude climate, Geophys. Res. Lett., 29, 1963, doi:1910.1029/2002GL015186, 2002.
R ¨othlisberger, R., Bigler, M., Wolff, E. W., Joos, F., Monnin, E., and Hutterli, M. A.: Ice core
15
evidence for the extent of past atmospheric CO2 change due to iron fertilisation, Geophys. Res. Lett., 31, L16207, doi:16210.11029/12004GL020338, 2004.
Siegenthaler, U., Stocker, T. F., Monnin, E., L ¨uthi, D., Schwander, J., Stauffer, B., Raynaud, D., Barnola, J.-M., Fischer, H., Masson-Delmotte, V., and Jouzel, J.: Stable carbon cycle-climate relationship during the late pleistocene, Science, 310, 1313–1317, 2005.
20
Spahni, R., Chappellaz, J., Stocker, T. F., Loulergue, L., Hausammann, G., Kawamura, K., Fl ¨uckiger, J., Schwander, J., Raynaud, D., Masson-Delmotte, V., and Jouzel, J.: Atmospheric methane and nitrous oxide of the late pleistocene from Antarctic ice cores, Science, 310, 1317–1321, 2005.
Stenni, B., Jouzel, J., Masson-Delmotte, V., R ¨othlisberger, R., Castellano, E., Cattani, O.,
25
Falourd, S., Johnsen, S. J., Longinelli, A., Sachs, J. P., Selmo, E., Souchez, R., Steffensen, J. P., and Udisti, R.: A late-glacial high resolution site and source temperature record derived from the EPICA Dome C isotope records (East Antarctica), Earth Planet. Sci. Lett., 217, 183–195, doi:110.1016/S0012-1821X(1003)00574-00570, 2003.
Toggweiler, J. R., Russell, J. L., and Carson, S. R.: Midlatitude westerlies, atmospheric CO2,
30
and climate change during the ice ages, Paleoceanography, 21, 2006.
CPD
4, 761–789, 2008Glacial terminations in the EPICA Dome C
ice core record
R. R ¨othlisberger et al.
Title Page
Abstract Introduction
Conclusions References
Tables Figures
◭ ◮
◭ ◮
Back Close
Full Screen / Esc
Printer-friendly Version
Interactive Discussion
910 974, 1998.
Wolff, E. W., Rankin, A. M., and R ¨othlisberger, R.: An ice core indicator of Antarctic sea ice production?, Geophys. Res. Lett., 30, 2158, doi:2110.1029/2003GL018454, 2003.
Wolff, E. W., Fischer, H., Fundel, F., Ruth, U., Twarloh, B., Littot, G. C., Mulvaney, R., R ¨othlisberger, R., De Angelis, M., Boutron, C. F., Hansson, M., Jonsell, U., Hutterli, M. A.,
5
Lambert, F., Kaufmann, P., Stauffer, B., Stocker, T., Steffensen, J. P., Bigler, M., Siggaard-Andersen, M.-L., Udisti, R., Becagli, S., Castellano, E., Severi, M., Wagenbach, D., Barbante, C., Gabrielli, P., and Gaspari, V.: Southern ocean sea-ice extent, productivity and iron flux over the past eight glacial cycles, Nature, 440, 491–496, 2006.
CPD
4, 761–789, 2008Glacial terminations in the EPICA Dome C
ice core record
R. R ¨othlisberger et al.
Title Page
Abstract Introduction
Conclusions References
Tables Figures
◭ ◮
◭ ◮
Back Close
Full Screen / Esc
Printer-friendly Version
Interactive Discussion
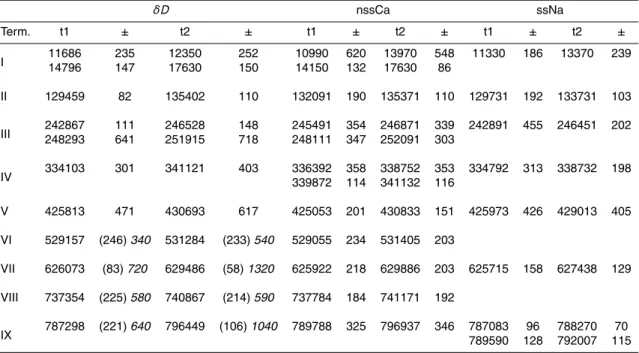
Table 1.The timing of glacial terminations inδD, log(nssCa flux) and log(ssNa flux). t1 corre-sponds to the time when interglacial levels are reached, t2 to the time when the first deviation from glacial levels is observed. In some instances the analysis with RAMPFIT was done over two subsections in order to take account of a two-step shape of the termination. See methods for details regarding RAMPFIT. The uncertainty in t1 and t2 forδDis likely underestimated by RAMPFIT for Terminations VI, VII, VIII, IX due to the coarse temporal resolution of the data. For these terminations, the values in brackets are derived by RAMPFIT. The values in italic correspond to the average spacing of the data at that age, which is used as an estimate of the uncertainty.
δD nssCa ssNa
Term. t1 ± t2 ± t1 ± t2 ± t1 ± t2 ±
I 1168614796 235147 1235017630 150252 1099014150 620132 1397017630 54886 11330 186 13370 239
II 129459 82 135402 110 132091 190 135371 110 129731 192 133731 103
III 242867248293 111641 251915246528 148718 245491248111 354347 246871252091 303339 242891 455 246451 202
IV 334103 301 341121 403 339872336392 358114 338752341132 353116 334792 313 338732 198
V 425813 471 430693 617 425053 201 430833 151 425973 426 429013 405
VI 529157 (246)340 531284 (233)540 529055 234 531405 203
VII 626073 (83)720 629486 (58)1320 625922 218 629886 203 625715 158 627438 129
VIII 737354 (225)580 740867 (214)590 737784 184 741171 192
CPD
4, 761–789, 2008Glacial terminations in the EPICA Dome C
ice core record
R. R ¨othlisberger et al.
Title Page
Abstract Introduction
Conclusions References
Tables Figures
◭ ◮
◭ ◮
Back Close
Full Screen / Esc
Printer-friendly Version
Interactive Discussion
Table 2. Levels ofδDat the change points of glacial sea salt (t2ssNaflux) and interglacial dust (t1nssCaflux). Missing values in t2ssNafluxand values in parentheses in t1nssCafluxrepresent termi-nations where the thresholds for ssNa flux and nssCa flux were not reached.
CPD
4, 761–789, 2008Glacial terminations in the EPICA Dome C
ice core record
R. R ¨othlisberger et al.
Title Page
Abstract Introduction
Conclusions References
Tables Figures
◭ ◮
◭ ◮
Back Close
Full Screen / Esc
Printer-friendly Version
Interactive Discussion
Table 3.Rate of change inδDover terminations.
Termination Duration (years) Change rate (‰/year) ±
CPD
4, 761–789, 2008Glacial terminations in the EPICA Dome C
ice core record
R. R ¨othlisberger et al.
Title Page
Abstract Introduction
Conclusions References
Tables Figures
◭ ◮
◭ ◮
Back Close
Full Screen / Esc
Printer-friendly Version
Interactive Discussion
CPD
4, 761–789, 2008Glacial terminations in the EPICA Dome C
ice core record
R. R ¨othlisberger et al.
Title Page
Abstract Introduction
Conclusions References
Tables Figures
◭ ◮
◭ ◮
Back Close
Full Screen / Esc
Printer-friendly Version
Interactive Discussion
CPD
4, 761–789, 2008Glacial terminations in the EPICA Dome C
ice core record
R. R ¨othlisberger et al.
Title Page
Abstract Introduction
Conclusions References
Tables Figures
◭ ◮
◭ ◮
Back Close
Full Screen / Esc
Printer-friendly Version
Interactive Discussion
CPD
4, 761–789, 2008Glacial terminations in the EPICA Dome C
ice core record
R. R ¨othlisberger et al.
Title Page
Abstract Introduction
Conclusions References
Tables Figures
◭ ◮
◭ ◮
Back Close
Full Screen / Esc
Printer-friendly Version
Interactive Discussion
CPD
4, 761–789, 2008Glacial terminations in the EPICA Dome C
ice core record
R. R ¨othlisberger et al.
Title Page
Abstract Introduction
Conclusions References
Tables Figures
◭ ◮
◭ ◮
Back Close
Full Screen / Esc
Printer-friendly Version
Interactive Discussion
CPD
4, 761–789, 2008Glacial terminations in the EPICA Dome C
ice core record
R. R ¨othlisberger et al.
Title Page
Abstract Introduction
Conclusions References
Tables Figures
◭ ◮
◭ ◮
Back Close
Full Screen / Esc
Printer-friendly Version
Interactive Discussion
CPD
4, 761–789, 2008Glacial terminations in the EPICA Dome C
ice core record
R. R ¨othlisberger et al.
Title Page
Abstract Introduction
Conclusions References
Tables Figures
◭ ◮
◭ ◮
Back Close
Full Screen / Esc
Printer-friendly Version
Interactive Discussion
−632 −62 −61 −60 −59 −58 −57 −56 −55
2.1 2.2 2.3 2.4 2.5 2.6 2.7 2.8
Present day LGM
Dome C temperature [oC]
S. America wind speed [m s
−1
] Idealised SST sensitivity experiments
CPD
4, 761–789, 2008Glacial terminations in the EPICA Dome C
ice core record
R. R ¨othlisberger et al.
Title Page
Abstract Introduction
Conclusions References
Tables Figures
◭ ◮
◭ ◮
Back Close
Full Screen / Esc
Printer-friendly Version
Interactive Discussion