J. Turán
,
Ľ
. Ovseník
and T. Harasthy
* Technical University of Košice/Department of Electronic and Multimedia Communications, Košice, Slovakia E-mail: [email protected] [email protected], [email protected]
Abstract— Paper presents basic information about
application of Optical Correlator (OC), specifically Cambridge Correlator, in system to recognize of traffic sign. Traffic Sign Recognition System consists of three main blocks, Preprocessing, Optical Correlator and Traffic Sign Identification. The Region of Interest (ROI) is defined and chosen in preprocessing block and then goes to Optical Correlator, where is compared with database of Traffic Sign. Output of Optical Correlation is correlation plane, which consist of highly localized intensities, know as correlation peaks. The intensity of spots provides a measure of similarity and position of spots, how images (traffic signs) are relatively aligned in the input scene. Several experiments have been done with proposed system and results and conclusion are discussed.
I. INTRODUCTION
Video – based object recognition has many applications in different fields. There are many types of recognition systems because each of application has its own specific requirements for input data [7]. It`s too hard or maybe impossible design system for all applications, because each application need input data with specific parameters and in specific form [10,15].
Driver Assistance System (DAS) consists of many types of systems which help to driver keep driver and crew save [10,14]. Nowadays are DAS very popular and many car designers use this system in new cars in the form of Park Assistance Systems, Traffic Sign Recognition System, etc. [5,6,9]
In this paper we will focus to Traffic Signs Recognition System. Video processing considers very high speed of processing. Most of designed Traffic Sign Recognition Systems are based on Shape detection and Color segmentation [13], Automatic Detection and Classification of Traffic Signs, Real Time Road Signs Recognition [8].
This paper is concentrated to Traffic Sign Recognition System as a one part of DAS. Our system is based on Optical Correlator, particularly Cambridge Correlator is used [3,6]. Optical Correlator is device which can compare two images in very high speed. This fast comparing can be very helpful in recognition part of the proposed system. Using Cambridge Correlator, we can reduce process time of traffic signs recognition. Cambridge correlator belongs to family of Joint Transform Correlators (JTC). Correlator use Optical Fourier Transform (OFT) to produce Joint Power Spectrum and then Optical Cross – Correlation between
input images. Cross – correlation is produced in real time, so all restrictions are in preprocessing of input data and identification of traffic sign [1,3,4].
The paper is organized as follows. Chapter II explains some important details of Optical Fourier Transform implementation. Chapter III is devoted to detail description of Cambridge Correlator (main parts and principle are described). In Chapter IV Traffic Sign Recognition System is described. This chapter is devoted to Hardware Scheme of proposed system. Experiments and Results are in Chapter V. Experiments were done with static images captured in real traffic scenes in Slovakia. Results of recognition are recorded in tables. Conclusions are covered in Chapter VI.
II. OPTICAL FOURIER TRANSFORM
A. 2D Fourier Transform
The Fourier transform (also called Fourier spectrum or frequency spectrum) of function (in general complex-valued) g of two independent variables x and y will be represented here by F{g} and is defined by [1,2]
∫ ∫
∞∞ −
+
−
=
(
,
)
exp[
2
(
)]
.
}
{
g
g
x
y
j
f
x
f
y
dxdy
F
π
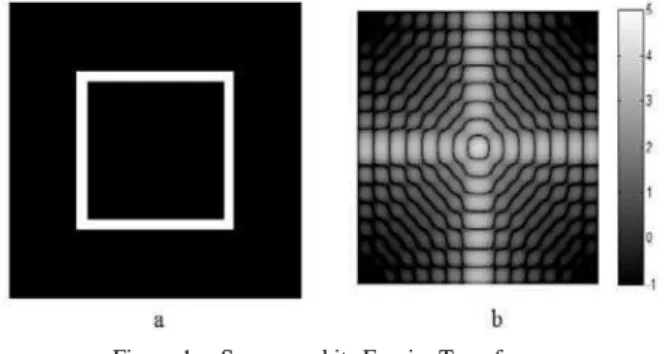
x y (1)On Figure 1 is showed 2D function g(x,y) (square) and its Fourier Transform, F(g). These examples were produced using MATLAB simulation software.
Figure 1. Square and its Fourier Transform.
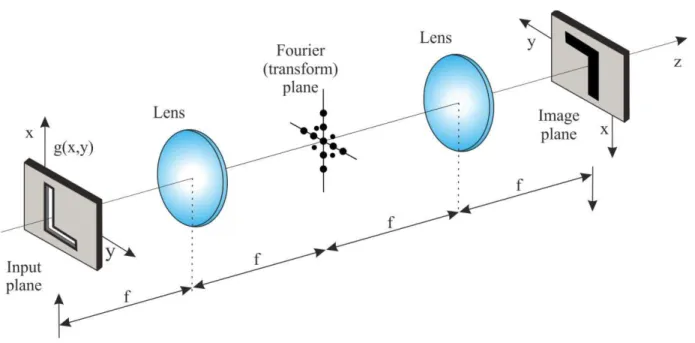
Figure 2. Optical Fourier Transform.
B. Optical Fourier Transform Implementation
Fourier Transform of 2D data or image as is defined above can be realized by mathematical operations or using optical lens [1,2,12]. Optical lens makes in focus of the lens the Fourier Transform of image.
In Figure 2 is shown 4–f optical system (distance between input plane and image plane is 4 times focus of one lens, 4*f). In this Figure 2 we can see that, in focus of first lens Fourier Transform occurs. Using another optical lens we get inverse Fourier Transform and finely we get original image (as it is shown on Figure 2).
Using masking filter in Transform Plane of 4–f system we can make masking filter (frequency filtering), which can remove some lines, shapes or contours from original image and so obtain new modified images [12]. Principle of masking of Fourier Transform in 4–f system is used in one type of Optical Correlators, the Match Filter Correlators [1]. In these types of Optical Correlators is reference image Fourier transformed “off line”, using mathematical operations, and Fourier Transformed reference image is used as masking filter in 4–f system. Output of this system is correlation peak if match was detected.
Optical processing (Fourier transform and filtering) is a truly parallel method of calculation, using the fastest medium – the light. Because of the process is parallel in nature, the process time does not scale with image resolution. This allows very large images to be Fourier transformed at the speed of the light [3,4,6].
All advantages of Optical Fourier Transform, mostly real time processing with images, are implemented in Optical processors to compare two or more images, for example, Optical Correlators. There are two main types of Optical Correlator, the Matched Filter (MF) and Joint Transform Correlator (JTC). Both types achieve largely the same results, but process the information in different ways [1,3,6].
III. OPTICAL CORRELATOR
Optical Correlator is device to compare two images in very high speed. Image data that enter to the optical
system is compared during correlation process in terms of two criteria, similarity and relative position. Comparing is done between reference and input image. Reference image could be some image from database and input is image captured by external camera.
There are two types of correlator, Matched Filter and Joint transform Correlator.
A. Matched Filter
This type of correlator is based on Vanderlugt Filter, invented by A. Vanderlugt in 1964. It is very sensitive to build, owning to its strict alignment criteria and long optical train, but still is commonly used type of Optical Correlators. The process involves obtaining two Fourier Transforms, of “input” and “reference” and the results of these transforms is optically multiplied and Fourier Transformed again as it shown in Figure 3. Usually, the reference image is transformed off-line, using electronics (FFT) to obtaining filter, Match Filter. This Matched Filter is than shown on Spatial Light Modulator, (SLM) as a masking filter mentioned above. These two Fourier Transforms are optically multiplied to obtain Optical Correlation. The most advantages of this method are high space – bandwidth product and extremely fast process time, but disadvantage is the need to create reference filter, Matched filter from reference image, so also need reference image before correlation process [3,4].
Figure 3. Matched Filter Correlator.
B. Joint Transform Correlator
or photodiode array) then captures the intensity distribution of transform to produce Joint Power Spectrum, (JPS) [4].
Figure 4. Joint Transform Correlator.
JPS is then binary or threshold processed and this processed image enters to transform process as input image of second Fourier Transform. Output of this transform is correlation plane include correlations peaks per match. This found match is shown as highly localized intensities and the intensity of peaks provides a measure of similarity of the images being compared whilst position of spots denote how the images are relative aligned in the input scene.[3]
The most advantages of this method of correlation are the simplified optical train (and therefore much cheaper to produce) and no strict alignment criteria.
To this family of correlators belongs also Cambridge Correlator [3,4], which is used in our system to recognize traffic signs.
C. Cambridge Correlator
Cambridge Correlator (CC) [3,4] is developed by Cambridge Correlators Ltd. and it belongs to group Joint Transform Correlators.
1) Optical system
Optical system of CC is based on Fourier Transform Engine© - a compact, yet hugely powerful processing system, built on the diffraction principles of the Optical Fourier Transform. Its new “W” design allows the electro – optical components to operate at their full potential.
In Figure 5 are shown main parts of CC [3].
Figure 5. Basic components of Cambridge Correlator.
The Spatial Light modulator is driven from the DVI port of the PC via its own drive board. In TABLE I. are shown main parameters of used SLM.
Response Time 10 ms ± 5 ms
SLM frame refresh 120 Hz
Images displayed on the SLM are illuminated with a collimated low power laser beam, launched through an optical fiber. The light is modulated by the images displayed on the SLM and then projected through the lens system.
The camera used in the kit is Leutron PicSight camera, with Gigabit Ethernet interface. Frame rate of camera is up to 200 Hz and the resolution is VGA resolution, 640 x 480 pixels [4].
2) Fourier Optics Experimenter
Cambridge Correlator described above is coupled with simulation software, “Fourier Optics Experimenter (FOE)” to learning and easy understanding Fourier Optics, especially Optical Correlation. FOE allows make Optical Correlation based on Cambridge Correlator between two or more images (videos), (Figure 6).
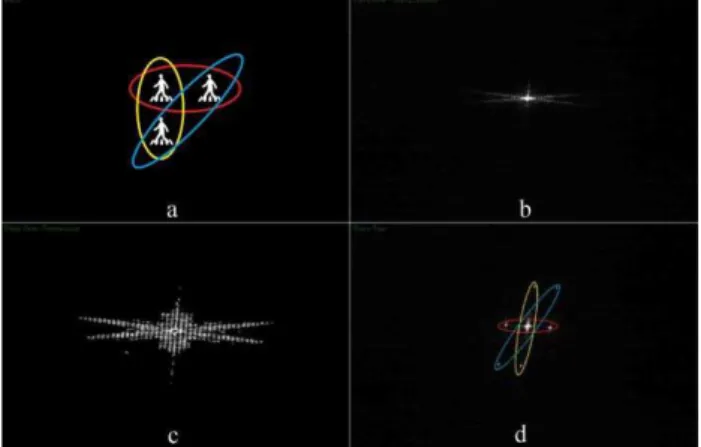
Figure 6. Correlation between three same symbols.
In Figure 6 we can see correlation between symbols of “CROSSWALK”. In Figure 6a is input plane shown where three symbols were added. In Figure 6b of image we can see Joint Power Spectrum (JPS) of whole image (three symbols). This JPS is binary or threshold processed (Figure 6c.) and transformed again. Output of this correlation is showed in Figure 6d.
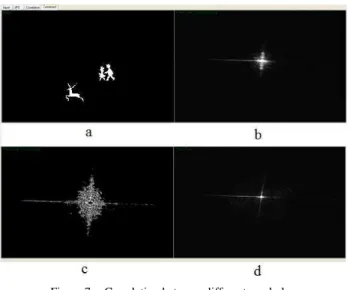
Figure 7. Correlation between different symbols.
For two different images no correlations peaks are showed in correlation plane. In Figure 7 we compared symbol of “children” with symbol of “animals”. Joint Power Spectrum looks very similar but in Correlation plane no correlations peaks were detected. Correlation plane consist of just DC noise (Figure 7d).
IV. TRAFFIC SIGN RECOGNITION SYSTEM USING CAMBRIDGE CORRELATOR
Traffic Sign Recognition System is one of most important part of DAS mentioned in Introduction. Nowadays are these systems very popular. Many designers of cars use these systems in new cars to produce more comfortable and more security for drive and crew.
The Traffic Sign Recognition Systems offer information of the road signs on the way and guide the driver. In DAS, it helps the driver to identify the traffic signs earlier and precisely. In ideal light conditions this system could avoid false recognition (or misleading recognition) of traffic signs caused by various human factors (inattention, tiredness, sleepiness or micro-sleep). Thus, the traffic sign recognition system makes the driving safer and easier.
Traffic sign recognition system is generally an intelligent vision system used for traffic signs recognition in the traffic scene. The traffic sign recognition in outdoor traffic scene, due to illumination changes (day, night, haze, snow, fog, rain, etc.), shadows, partial occlusions, sign rotation and damage becomes a very challenging and difficult task [7,10].
Fast process time is very important aspirations for real time recognizing. The proposed system to recognize traffic sign use Cambridge Correlator to compare reference and input image in real time, so there is more short processing time.
A. Hardware scheme
Hardware scheme of proposed system is shown in Figure 8. System consists of four main parts: 1.Color Camera (CMOS sensor), 2.Computer Unit, 3.Optical Correlator (Cambridge Correlator is used), 4.Display. Traffic Scene is captured by color camera, preprocessed in computer, compared in Optical Correlator and correlation is evaluated in same computer, which was used to preprocessing. Output is shown in Display.
Figure 8. Traffic Sign Recognition System.
B. Recognition Proces
1) Capture of Traffic Scene
Traffic scene is captured by the color camera (CMOS). Key frames are extracted from captured video sequence. These frames are preprocessed to minimize of DC noise in correlations process.
2) Preprocessing
Preprocessing consists of detection Region of Interest - ROI (detecting potential Traffic Sign). ROI is obtained by filtering of relevant colors of traffic signs (red, blue, yellow and green). After color filtering, irrelevant color clusters are removed. After this preprocessing just relevant objects are available. These potential ROIs are defined and they are marked as input to optical correlator.
3) Optical Correlation
Detected ROIs are compared in Optical Correlator with database of reference Traffic Signs. In correlation plane the position of correlation peaks define recognized Traffic Sign. Position of correlations peaks is represented by position of Traffic Signs (detected Traffic Sign in traffic scene relative to reference traffic signs). This information may be used in Traffic Sign Inventory Systems.
4) Identification and Display
Output of Optical Correlator, correlation peaks, goes back to computer unit to detecting of position of correlation peaks. Then Computer unit is used to Identification traffic sign in input plane of Optical Correlator.
The developed system was tested on traffic scenes captured on road of Slovakia. Traffic scenes were obtained in daylight conditions.
V. EXPERIMENTS AND RESULTS
A. Experiments
1) First experiment
In this experiment with traffic sign recognition of four Traffic Signs: CROSSWALK, MAIN ROAD, STOP and YIELD was tested (Figure 9).
Figure 9. Tested Traffic Signs in first experiment.
Figure 10. Captured Traffic Scenes.
After background removing of captured traffic scenes just relevant ROI left. These ROIs are normalized for input plane of Cambridge Correlator. Some ROIs examples are shown in Figure 11.
Figure 11. Detected Traffic Signs.
Reference and detected (input) Traffic Signs enter to input plane of correlation process. In this plane the Roberts Cross operators are used to detection of shape of these images. Roberts cross operator minimize DC noise of Joint Power Spectrum and Correlation peaks are simpler detectable. If input plane obtain too much of information, the correlation obtain a big DC noise and correlation peaks are hardly detectable.
Position of reference and recognized traffic signs in input plane can be variable, but position of these traffic signs will represent position of correlation peaks in correlation plane. Identification of traffic signs could be now performed. High intensity peaks are found in before defined area with exactly defined tolerance, so we can determine which traffic sign was recognized.
2) Second experiment
Next experiment with designed Traffic Sign Recognition was done with the same types of Traffic Signs, but they were captured with worse light conditions. Target of next experiment is test designed system in traffic scene with low visibility. In this experiment the same method of traffic sign recognition was used.
Figure 12. Example of Traffic Scene with low visibility.
B. Results
Results of experiments with low visibility are summarized in TABLE II. Traffic Signs CROSSWALK are named CW1 – CW6, MAIN ROAD MR1 – MR6, STOP S1 – S6 and YIELD Y1 – Y6.
TABLE II.
RESULTS OF TRAFFIC SIGN RECOGNITION
Traffic Sign
Intensity of 1. peak
Intensity of 2. peak
Average Success of Traffic Signs Recognition [%]
Ideal visibility
Low visibility
CR1 206 218
81 73
CR2 233 212
CR3 218 193
CR4 227 186
CR5 143 162
CR6 224 249
MR1 247 239
70 64
MR2 124 122
MR3 150 145
MR4 233 239
MR5 234 239
MR6 87 109
S1 176 201
82 73
S2 192 197
S3 180 238
S4 199 208
S5 244 240
S6 221 212
Y1 176 159
68 60
Y2 200 208
Y3 158 158
Y4 205 245
Y5 118 130
Y6 170 141
VI. CONCLUSION
Paper presents the Traffic Signs Recognition system based on Cambridge Correlator. The main information of Optical Fourier Transform and Optical Correlators is also presented.
Traffic Scenes in proposed system were captured by color CMOS camera and key frame was extracted. The key frame was preprocessed and converted to HSV color model. Color filters were designed and used to detected relevant colors of traffic signs. Using these filters ROIs obtain in traffic signs was detected. Correlation between tested traffic signs was determined using intensity value of correlation peaks in JTC correlation plane.
Experimental results demonstrate the main advantage of this system is that using optical correlator, it operates at very high speed compared to other pure software implementations running on PC.
In future we want to focus to preprocessing methods of input information and use preprocessed video as input of Optical Correlator. Another target is using this system for recognition of all types of Traffic Signs. Our focus will be also on implementation of some preprocessing algorithms in hardware using FPGA.
Using this method of preprocessing the process time of whole recognition system would by much reduced. Thanks these improvements could Traffic Signs Recognition System based on principle of Optical Correlator happened very attractive to practical use.
ACKNOWLEDGMENT
We support research activities in Slovakia / Project is co-financed from EU funds. This paper was developed within the Project "Centrum excelentnosti integrovaného výskumu a využitia progresívnych materiálov a technológií v oblasti automobilovej elektroniky", ITMS 26220120055 (50%). This work was partially supported from the project COST IC0802 (50%).
REFERENCES
[1] J. W. Goodman, Introduction to Fourier Optics, Colorado: Roberts & Company, Publishers, 186 s. ISBN 0-9747077-2-4, 2005.
[2] T. Naughton, M. Klima, J.Toth, Improved Joint Transform Correlation Performance Through Spectral Domain Thresholding
[online]. Maynooth, Ireland, 1998,
http://www.cs.nuim.ie/~tnaughton/pubs/varasto/tjn199809oesijtc. pdf
[3] Cambridge Correlators, Fourier Optics Experimenter, User Guide. [4] Cambridge Correlators, http://www.cambridgecorrelators.com,
March 2012.
[5] M. Fifík, J. Turán, Ľ. Ovseník and K. Fazekas, “Experiments with a Transform based Traffic Sign Recognition System”, Proc. Of 17th International Conference on System, Signals and Image Processing IWSSIP 2010, Rio de Janeiro, Brazil, June 17-19, 2010, 227-230.
[6] T. Harasthy, J. Turan, L. Ovsenik, K. Fazekas, “Traffic Signs Recognition with Using Optical Correlator”, Proc. IWSSIP 2011, Sarajevo, Bosnia and Herzegovina,16-18 June 2011,
239-242.ISBN: 978-9958-9966-1-0,IEEE Catalog number: CFP1155E-PRT.
[7] S. E. Umbauch, Computer Vision and Image Processing and A Practical Approach Using CVIPtools, Prentice Hall PTR, Upper Saddle River, NJ 07458, June 1999.
[8] A. Broggi, P. Cerri, P. Medici and P.P. Porta, “Real Time Road Signs Recognition,” Intelligent Vehicles Symposium, 2007 IEEE Volume, Issue, 13-15, 981 – 986, june 2007.
[9] M. Fifik, J. Turán and Ľ. Ovseník, “Traffic Signs Recognition Experiments with Transform based Traffic Sign Recognition System,” 17th Symposium IMEKO TC 4, 3 rd Symposium IMEKO TC 19 and 15 th IWADC Workshop, Instrumentation for the ICT Era, September 8 – 10, 2010, Kosice, Slovakia.
[10] A. Laika, W. Stechele, “A review of different object recognition methods for the application in driver assistance systems, “ Image Analysis for Multimedia Interactive Services, 2007, WIAMIS, 6-8 June 2007.
[11] F.P. Paulo, L.P. Correia, “Automatic detection and classification of traffic signs”, Image Analysis for Multimedia Interactive Services, WIAMIS, 6-8 June 2007.
[12] B. E. A. Saleh, M.C. Teich, Fundamentals of photonics, Wiley – Interscience, 2007.
[13] B. Cyganek, “Circular Road Signs Recognition with Soft Classifiers,” Integrated Computer-Aided Engineering, Vol. 14, No. 4, pp. 323-343, 2007.
[14] A. Escalera, J. M. Armingol and M. Mata, “Traffic Sign Recognition and Analysis for Intellige$nt Vehicles,” Image and Vision Computing, Vol. 21, 2003, 247-258.
[15] J. C. Noyer, P. Lanvin and M. Benjelloun, “Correlation-based particle filter for 3D object tracking,” Integrated Computer-Aided Engineering, 16:2, pp. 165-177, 2009.
BIOGRAPHIES
Ján TURÁN ( Dr.h.c., Prof., RNDr., Ing. DrSc.) received Ing. (MSc.) degree in physical engineering with honours from the Czech Technical University, Prague, Czech Republic, in 1974, and RNDr. (MSc.) degree in experimental physics with honours from Charles University, Prague, Czech Republic, in 1980. He received a CSc. (PhD.) and DrSc. degrees in radioelectronics from University of Technology, Košice, Slovakia, in 1983, and 1992, respectively. Since March 1979, he has been at the University of Technology, Košice as Professor for electronics and information technology. His research interests include digital signal processing and fiber optics, communication and sensing.
Ľuboš Ovseník (doc., Ing., PhD.) received Ing. (MSc.) degree in radioelectronics from the University of Technology Košice, in 1990. He received PhD. degree in electronics from University of Technology, Košice, Slovakia, in 2002. Since February 1997, he has been at the University of Technology, Košice as Associate Professor for electronics and information technology. His general research interests include optoelectronic, digital signal processing, photonics, fiber optic communications and fiber optic sensors.