Cell phenotypic change due to Cryptosporidium parvum
infection in immunocompetent mice
Vera Codices
1, Catarina Martins
2, Carlos Novo
2,3, Mário Pinho
4, Bruno de Sousa
5, Ângela Lopes
6,
Miguel Borrego
2and Olga Matos
1*
1Unidade de Parasitologia Médica, Grupo de Protozoários Oportunistas/VIH e Outros Protozoários, CMDT, Instituto de Higiene e Medicina Tropical, Universidade Nova de Lisboa, Portugal;2Centro de Estudos de Doenças Crónicas, CEDOC, Faculdade de Ciências
Médicas, Universidade Nova de Lisboa, Lisboa, Portugal; 3Unidade de Parasitologia Médica, Instituto de Higiene e Medicina Tropical, Universidade Nova de Lisboa, Lisboa, Portugal;4Faculdade de Medicina Veterinária, Universidade Técnica de Lisboa, Lisboa, Portugal;
5Unidade de Saúde Internacional e Bioestatística, CMDT, Instituto de Higiene e Medicina Tropical, Universidade Nova de Lisboa, Lisboa, Portugal;6Unidade de Tecnologias de Proteínas e Anticorpos Monoclonais, presently Unidade de Microbiologia Médica,
Instituto de Higiene e Medicina Tropical, Universidade Nova de Lisboa, Lisboa, Portugal
Abstract
Cryptosporidium parvumis an intracellular parasite causing enteritis which can become life-threatening in immunocompromised host. Immunoregulatory T cells play a central role in the regulatory network of the host. Here, we proposed to characterize the populations of immune cells during infection and reinfection with C. parvum. Four-week-old BALB/C mice were inoculated with oocysts of C. parvumat days 0 and 22. Fecal and blood samples, spleens, and small intestines were collected for analysis. Pe-ripheral blood and spleen cell populations were characterized by flow cytometry. After infection (days 0 to 21), mice presented higher values of neutrophils, eosinophils, NK cells and CD4+CD25highT cells in peripheral blood. After reinfection, this upward trend continued in the following days for all four populations in infected mice. At day 35, infected mice presented similar val-ues to the control group, except for CD4+CD25highT cells, which remained higher in infected mice. A possible correlation between alterations in blood and spleen cell populations was also studied, but no consistent association could be established. Small in-testine sections were screened for intracellular stages of the parasite but no evidence of pathology was observed. Here, we re-port information which may be imre-portant for the understanding of the specific cell-mediated response in immunocompetent mice toC. parvuminfection. Although some questions remain unanswered and complementary studies are needed, our results are ex-pected to contribute to a better understanding of innate and Treg cells role in the clearance process of this parasite.
Keywords
Cryptosporidium, immunophenotype, flow cytometry, B-lymphocytes, T-lymphocytes
Introduction
Cryptosporidiumspp. are apicomplexan protozoan parasites with a worldwide distribution, causing gastrointestinal disease in humans and animals. Cryptosporidium parvumis the most prevalent species and causes short-term self-limiting diarrheal illness in immunocompetent hosts. Recovery is complete, and the vast majority of recovered individuals are resistant to re-infection. Immunocompromised individuals such as AIDS pa-tients experience prolonged diarrhea associated with persistent infection of intestinal epithelial cells, which can be life-threat-ening (Fayer and Ungar 1986, Blanshard et al. 1992, Fayer et al. 2000, Matos et al. 2004, Xiao and Fayer 2008). Humans
can acquire Cryptosporidium infections through several routes, such as anthroponotic, zoonotic, food and waterborne transmission. Oocysts are immediately infectious when ex-creted in feces and highly resistant to environmental stress, disinfectants, and some treatment technologies. These char-acteristics facilitate their dissemination in water, and have given rise to several waterborne outbreaks (Mac Kenzie et al. 1994, Fayer et al. 2000, Xiao et al. 2006, Xiao and Feng 2008, Xiao and Ryan 2008).
Furthermore, C.parvumhas a considerable economic im-portance in veterinary medicine, particularly in newborn ru-minants where it causes weight loss, dehydration and death (Fayer and Ungar 1986).
*Corresponding author: [email protected]
A complex sequence of events involving various compo-nents of the host response has shown to be important in the control of C. parvuminfection and critically dependent on the immune status of the host. It means that the study of the im-mune response to the parasite would improve the knowledge of the host defense mechanisms and the choice of better targets for therapy. To date, specific therapeutic or preventive inter-ventions are not yet available. Few studies on the immune re-sponse in humans have been done, some of which mainly dealing with systemic antibody responses and others address-ing their attention on the humoral and cell-mediated immune response. Generally, these studies conclude that despite the many advances made in understanding immune responses to
C.parvum, some infection mechanisms not clear and a lot re-mains unknown (Theodos 1998, Riggs 2002, Gomez Morales
et al. 2004, Borad and Ward 2010, Petry et al. 2010). Im-provements in this area have been hampered by the lack of studies in immunocompetent animal models. Most experi-ments have been performed in neonatal or immunocompro-mised mice, with lacking functional T and/or B cells, and targeted mutations on major histocompatibility complex (MHC) class-II, alpha-beta-T-cell receptor (αβ-TCR) and in-terferon-gamma (INF-γ) (McDonald et al. 1992, Aguirre et al. 1994, McDonald and Bancroft 1994, Perryman et al. 1994, McDonald 2000).
Several studies suggest that innate immune response ini-tially limits the parasite number but the clearance of the in-fection ultimately requires a T-cell-mediated response, empha-sizing the importance of CD4+cells in the protective immunity towardsC. parvum.
Nevertheless, limited information is available on the spe-cific subset and function of these cells (Aguirre et al. 1994, Waters and Harp 1996). More recently, it has become clear that avoidance of damage to the host by foreign microorgan-isms is also possible to achieve by active suppression mediated by regulatory T cells (Treg) populations (Maloy and Powrie 2001, Belkaid and Tarbell 2009). However, we should keep in mind that, although Treg cells have an important role in the regulation of immune responses, T-helper type 1 (Th1) and type 2 (Th2) cells can also regulate immune responses in this context through the production of specific cytokines (Lean et al. 2002). CD4+CD25+Treg cells are “naturally occurring” subpopulation of Treg and their role in the initiation and de-velopment of immune response has been widely studied (O’Garra and Vieira 2004, Belkaid and Tarbell 2009, Borrego
et al. 2009). Some authors showed, in mice, that these cells are the hematopoietic components that reverse, or at least, pre-vent the disease (Fontenot et al. 2003). Due to the inherent difficulties in using CD25 as a marker for the purification of Treg cells, the finding that selection of the CD25highsubset of CD4+CD25+ T cells minimizes the co-isolation of contami-nating activated CD4 T cells is important for future studies on the role of these cells in human disease (Baecher-Allan et al. 2005). Although not tested in this study, there are other mole-cules that can also be used for the identification and isolation
of Treg cells (transcription factor Foxp3 and IL7R - CD127) (Fontenot et al. 2003, Baecher-Allan et al. 2005, Banham 2006, Liu et al. 2006).
In this study, four-week-old BALB/C ByJ strain mice under specific-pathogen-free (SPF) conditions were used as animal model. Cryptosporidiuminfection was performed with purified oocysts. Evaluation of C.parvumcell-mediated re-sponse was done by flow cytometry (FC) through the periph-eral blood and spleen cell population analysis. Histological analysis of small intestine and spleen has also been done. It is expected to analyze and characterize (immunophenotyping) changes in peripheral blood and spleen cell populations due to
C. parvuminfection, which could help clarify some aspects of the immune response to this infection.
Materials and Methods
Mice: Four-week-old female BALB/C ByJ mice were ob-tained from Charles River Laboratories (France). Mice were acclimated and housed in separate sterilized plastic cages with filter top, and fed with sterilized food and water (pH 3.5) ad libitumunder SPF conditions.
Parasites and infection studies: Purified oocysts of C.
parvum(Moredun strain) from cervine origin were purchased at Creative Science Company/Moredun Institute (Edinburgh, Scotland). According to the supplier, oocysts were resus-pended in phosphate buffered saline (PBS) and stored at 4ºC in the presence of antibiotics (penicillin and streptomycin). The viability of the oocysts preparation, checked by in vitro
excystation, was 94.7%.
Seven groups of three animals each were inoculated with 1 x 10⁶C. parvumoocysts in 80 µl of PBS per mouse by oral gavage. Four groups of three mice each were gavaged with PBS and used as control. One group of infected mice was eu-thanized on each of days 3, 7, 14 and 21 post-infection (PI) and one group of control mice was euthanized on each of days 3 and 14. In order to analyze the mechanisms conferring re-sistance towards infection with C. parvum, the remaining groups of infected mice were rechallenged with 1 x 10⁶ oocysts in 80 µl of PBS per mouse on day 22 PI. On each of days 25, 28 and 35 PI (days 3, 6 and 13 post-reinfection [PRI], respectively) a group of infected mice was also euth-anized and on days 28 and 35 a group of control mice was also euthanized.
At each time point the feces, blood, spleens and small in-testines were collected for analysis. Care was taken to keep the same level of animal handling for all groups.
The presence of C. parvumDNA in feces was confirmed by a nested-PCR of the 60-kDa glycoprotein (GP60) gene (Glaberman et al. 2002, Alves et al. 2003) after extraction of DNA by a Mini-BeadBeater/silica method (Alves et al. 2001). The presence of oocysts in feces was determined in fecal smears stained by a modified Ziehl-Neelsen method (Casemore
et al. 1985) after oocyst concentration using a modified
ether sedimentation method (Alves et al. 2000) and then ob-served under an optical microscope with 400x magnification.
Simultaneously, the active infection in small intestines of mice was confirmed by histological methods. Morphological changes in the spleen were also evaluated. For this purpose, tissues samples were removed from euthanized mice and fixed in 10% buffered formalin solution, processed for paraffin em-bedding and sectioned. Small intestine sections were stained with hematoxylin-eosin and with FITC-labeled monoclonal antibody reagent for direct immunofluorescence detection of
Cryptosporidiumoocysts (Crypt-a-Glo™, A400FLR-1X, Wa-terborne, Inc, New Orleans, Los Angeles) in accordance with the laboratory procedures and examined at a magnification of x400. Spleen sections were stained only with hematoxylin-eosin and examined at a magnification of x200.
All protocols and experiments involving animals were performed in compliance with the relevant laws and institu-tional guidelines with specific approval by the animal care committee.
Flow cytometric analysis of spleen and peripheral blood cell populations: Peripheral blood and spleen were aseptically collected from euthanized mice. Peripheral blood was col-lected from the vena cava. Splenocytes were obtained by gen-tle removal of spleen’s contents, followed by a mechanical disassociation protocol, using BD Medimachine system/BD Medicon and BD Filcon Filters (BD Biosciences, San Jose, California). The protocol was adjusted according to the cy-tometer manufacturer’s instructions. Red blood cells from mouse peripheral blood and spleen cell suspension were lysed using BD Biosciences Pharmingen’s PharM Lyse™ solution. Five milliliters of 1X Lysing Solution per spleen cell suspen-sion or per 250 µl of mouse peripheral blood were added. Samples were gently vortexed and incubated at room temper-ature, in the dark, for 5 min. After centrifugation at 200 x gfor 5 min, supernatants were carefully aspirated and discarded. Each pellet was resuspended in 500 µl of cold wash buffer (Facs Flow BD Biosciences). After centrifugation at 350 x g
for 5 min, the supernatants were discarded and the pellet re-suspended to a concentration of 2 x 10⁷cells/ml (i.e., 106cells per 50 µl). The used mAbs (obtained from BioLegend, San Diego, California) were: anti-mouse CD4 APC (clone GK1.5), anti-mouse CD8a PE (clone 53-6.7), anti-mouse CD19 APC (clone 6D5), mouse CD3ε PerCP (clone 145-2C11), anti-mouse CD45 FITC (clone 30-F11), anti-anti-mouse CD49b PE (clone DX5), anti-mouse CD25 PE (clone PC61), anti-mouse TCRγδ FITC (clone GL3) and anti-mouse TCRβ FITC (clone H57-597). Each mAb was diluted to predetermined optimal concentration in wash buffer and placed in several tubes in a volume of 50 µl. About 100 µl of resuspended pellet (106cells) were added to each tube already containing 50 µl of mAb (or 50 µl wash buffer for negative controls). After mixing by gen-tly vortexing, all tubes were incubated at 4°C for 30 min in the dark. Two washes were made with 200 µl of wash buffer followed by centrifugation at 350 x gfor 5 min and super-natant removed by aspiration. Labeled cell pellets were
re-suspended in 200 µl of wash buffer and analyzed on a BD FACS Calibur™ Flow Cytometer (BD Biosciences, San Jose, California) equipped with an air-cooled argon laser, with an excitation wavelength of 488 nm, and a red diode laser, with an excitation wavelength of 685 nm. Instrument settings were previously adjusted and controlled following the standard pro-cedures.
Cell Quest 3.3™ (BD Biosciences) software was used for both acquisition and analysis. In each tube, 40,000 leukocyte events (CD45+) were acquired. Results were presented as a per-centage of total leukocytes for major populations, identified according to their forward angle light scatter (FSC) and side angle light scatter (SSC), and also the expression of CD45 (neutrophils, monocytes, lymphocytes and eosinophils). Within the lymphocytes, T, B and natural killer (NK) populations were identified according to the expression of CD3, CD4, CD8, CD19 and CD49b, and presented as a percentage of total lym-phocytes. TCRαβ+T cells (assessed as the population of cells expressing the TCRβ chain) were also evaluated according to their expression of CD4 and CD8, and classified in CD4+, CD8+, double negative (DN) and double positive (DP) cells. Finally, a combined Boolean Gating Strategy was used for the evaluation of CD25 expression within CD3+CD4+T cells. For this purpose, 10,000 to 15,000 CD3+CD4+T cells were ac-quired in each tube, and a fluorescence minus one (FMO) con-trol tube was also used. CD3+CD4+CD25+ T cells were identified as the cells with higher fluorescence intensity than the FMO tube. Within this population, CD3+CD4+CD25highT cells were identified as the small cluster presenting higher CD25 expression (above the second decade in the fluorescence logarithmic scale).
Statistical analysis: Statistical analysis was performed using the nonparametric Mann-Whitney test, since the data did not meet the criteria of normality and homogeneity of vari-ance necessary to apply the t-test. Statistical significvari-ance was defined by a p-value of less than 0.05. With this test the au-thors analyzed if there were statistical significant differences among the values of the populations in the spleen and periph-eral blood, determined by FC for each mouse, after infection and reinfection. Tests were performed using IBM SPSS Sta-tistics version 19 software (SPSS Inc., Chicago, U.S.A.).
Results
Infectivity assay: Fecal samples were collected from each group of mice on days 3, 7, 14, 21, 25, 28 and 35 PI. The oc-currence of oocysts in feces was determined in fecal smears of concentrated oocysts stained by a modified Ziehl-Neelsen method, followed by observation under an optical microscope with 400x magnification.
Although the load of oocysts was low (8–12 oocysts), they could be observed on days 3 and 7 PI. The presence of gDNA of C. parvumin feces was determined by a nested-PCR of 60-kDa glycoprotein gene and a band of DNA (400 bp) was
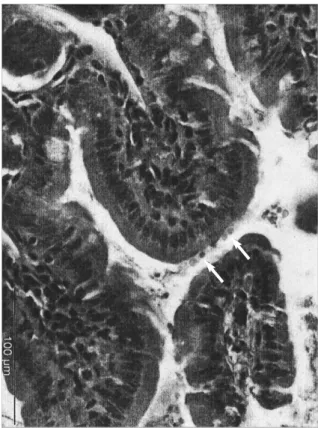
served only on days 3, 7 and 14 PI. Feces from control mice were also analyzed in all time points, by microscopy and nested-PCR, in duplicate, and were all negative. The active infection in small intestines of mice was confirmed by histo-logical examination. Small intestine sections from euthanized mice in all time points only showed a low number of intracel-lular parasite stages (5–10 parasites) in the superficial border of the villi (Fig. 1) on days 21, 25 and 35 PI. In sections
ana-lyzed by immunofluorescence in all time points, a low num-ber of oocysts (5–10 oocysts) were also observed. Particular attention was also given to the possibility of an influx of eosinophils to the site of infection that could be correlated with the increased number of systemic eosinophils. No noticeable changes consistent with infection were observed in any of those days. In order to check any possible correlation between alterations in blood and spleen cell populations, histological changes in sections of spleen of infected mice were also eval-uated by light microscopy. On days 25 and 28 PI (3 and 6 days PRI, respectively), all spleens of infected mice have shown signs of splenomegaly. Microscopically, the major feature of these spleens was a mild congestion of the red pulp, with no noticeable changes in the appearance of the white pulp.
Flow cytometry analysis: Analysis of peripheral blood – leukocyte subpopulations: Considering the major leukocyte subpopulations, neutrophils mean percentages varied between 31.42%–52.49% in infected mice, and 29.04%–45.33% in the control group (as shown in Table I). Analyzing the evolution of this population after infection and reinfection (days 0 and 22), neutrophil percentages appeared to rapidly increase (days 3 and 25), and then start to recover, approaching the values observed in the control group.
For eosinophils, mean percentage values of this popula-tion were higher in infected mice, varying between 3.29%– 5.61%, compared to 1.00%–4.78% for the control group. Although eosinophil values in infected mice were significantly higher than those in control mice until day 28, this difference decreased and reached similar values at day 35.
The lymphocyte population presented values between 36.36%–57.01% in infected mice and values between 39.86%– 56.25% in control mice. Lymphocytes and neutrophils are nor-mally the two major leukocyte populations in mice peripheral blood, although they present inverted tendencies. Lymphocytes percentage increased after infection, until day 21, and then rose again after reinfection. Nevertheless, after both exposure peri-ods, the lymphocyte population seemed to recover, presenting values closer to those observed in the control group.
Fig. 1.Histological examination of small intestine. Light photomi-crograph of small intestine from a C. parvuminfected mouse, at day 25 PI (day 3 PRI). Arrows indicate intracellular stages of the parasite lining the luminal surface of enterocytes (hematoxylin-eosin stain, x400)
Table I. Flow cytometry analysis for leukocyte subpopulations. Mean percentage values for leukocyte populations (neutrophils, eosinophils, lymphocytes and monocytes) in peripheral blood, along the infection and reinfection processes (35 days), in both infected and non-infected control mice
Day Neutrophils (%) Eosinophils (%) Lymphocytes (%) Monocytes (%)
IM CM IM CM IM CM IM CM
3 49.44 45.33 4.25 1.99 40.23 39.86 5.20 10.05
7 43.12 – 3.29 – 45.95 – 7.36 –
14 37.72 34.80 3.69 1.30 50.39 52.03 8.19 6.36
21 35.76 – 5.61 – 51.46 – 6.60 –
22 Reinfection
25 52.49 – 4.93 – 36.36 – 6.22 –
28 31.42 29.04 3.75 1.00 57.01 56.25 7.38 10.00
35 31.96 40.60 4.81 4.78 55.01 46.53 8.22 7.95
IM - infected mice; CM - control mice.
Monocytes showed mean percentage values between 5.2%–8.22% in infected mice, and between 6.36%–10.05% in control mice, which are not significantly different. Consider-ing the values obtained in both groups, we can only point out minor decreases in percentage populations values in infected mice after infection and reinfection (days 3 and 25).
The significance of the results was limited due to the small number of mice. In most leukocyte populations (neutrophils, eosinophils, lymphocytes, monocytes) no statistically signif-icant differences were observed among the mean values of in-fected and reinin-fected mice.
Analysis of peripheral blood – lymphocyte subpopula-tions: Lymphocytes, as previously mentioned, showed a ten-dency to decrease on days 3 and 25, after both infection and reinfection (days 0 and 22). In the control groups (Table II), within the lymphocyte subpopulations, B cells (CD19+) and NK cells (CD49b+) seemed to gain relevance through time. B cells and NK cells percentage ranged between 26.16%– 44.55% and 6.34%–20.14%, respectively, while T cells
(CD3+) showed a decreasing tendency from 64.47% to 30.94%, as well as the CD4/CD8 ratio (data not shown).
In infected mice, mean values of B cells oscillated between 23.79% and 42.64%, but with the initial percentage of cells (33.27%) similar to the final one (32.73%). From day 25 to day 35, however, data show that B cells in infected animals did not follow the increasing tendency observed in the con-trol group.
In infected animals, NK cells presented generally higher values than those observed in the control group. The only ex-ception was day 35, with infected animals presenting a de-crease in percentage values when compared to the control group (infected mice: 14.91%; control mice: 20.14%).
The data also showed that the percentage of T cells in in-fected mice, at days 3 and 25 diminished when compared with the control group, and then started to recover in value, achiev-ing normal levels one week after the infection challenge. At day 35, however, both T cells and CD4+T cells appeared to maintain higher values in infected animals.
Table II. Flow cytometry analysis for lymphocyte subpopulations. Mean percentage values for lymphocyte subpopulations in peripheral blood, along the infection and reinfection processes (35 days), in both infected and non-infected control mice. The discrepancy observed be-tween the summary of CD4+and CD8+ T cells and the total T cells matches to the DP and DN cells (data not shown)
Day B (%) NK (%) T (%) CD4
+ T (%) CD8+ T (%)
IM CM IM CM IM CM IM CM IM CM
3 33.27 26.16 10.15 6.87 53.72 64.47 42.20 44.81 7.78 7.57
7 23.79 – 6.84 – 65.72 – 48.65 – 8.92 –
14 31.69 36.18 12.01 6.34 52.89 55.07 42.59 41.02 7.58 7.10
21 40.29 – 11.39 – 44.30 – 28.92 – 8.56 –
22 Reinfection
25 42.64 – 11.72 – 43.35 – 26.74 – 4.99 –
28 38.65 35.74 11.67 8.22 48.41 54.01 33.15 38.59 8.97 8.94
35 32.73 44.55 14.91 20.14 51.60 30.94 37.80 11.07 6.36 5.51
B – B cells (CD19+ lymphocytes); NK – Natural Killer cells (CD49b+ lymphocytes); T – T cells (CD3+ lymphocytes); DP – Double posi-tive cells; DN – Double negaposi-tive cells; IM – infected mice; CM – control mice.
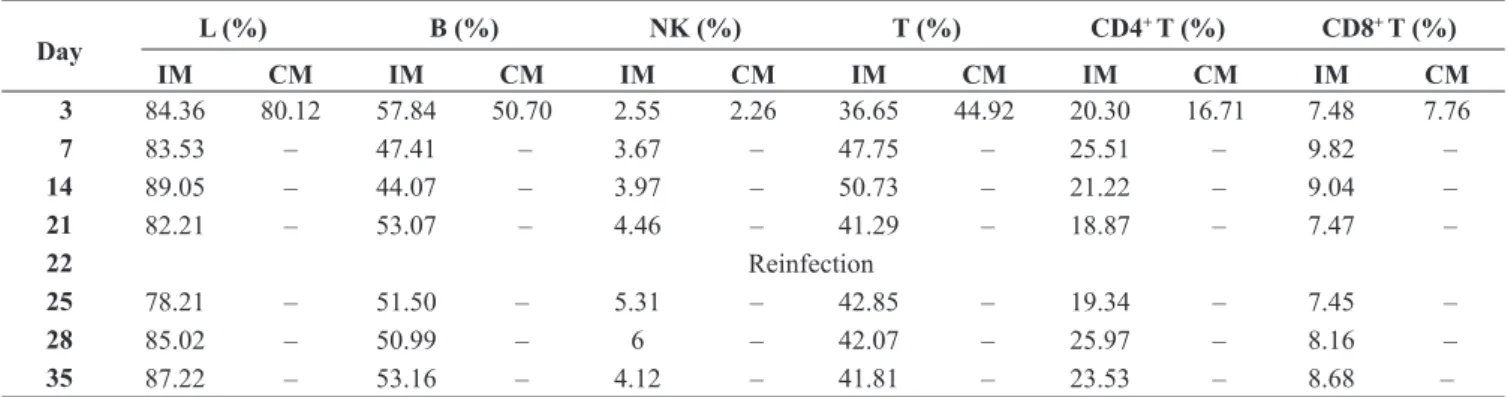
Table III. Flow cytometry analysis of lymphocytes in spleen cells. Mean percentage values for lymphocytes and lymphocyte subpopulations in spleen samples, along the infection and reinfection processes (35 days), in both infected and non-infected control mice
Day L (%) B (%) NK (%) T (%) CD4
+ T (%) CD8+ T (%)
IM CM IM CM IM CM IM CM IM CM IM CM
3 84.36 80.12 57.84 50.70 2.55 2.26 36.65 44.92 20.30 16.71 7.48 7.76
7 83.53 – 47.41 – 3.67 – 47.75 – 25.51 – 9.82 –
14 89.05 – 44.07 – 3.97 – 50.73 – 21.22 – 9.04 –
21 82.21 – 53.07 – 4.46 – 41.29 – 18.87 – 7.47 –
22 Reinfection
25 78.21 – 51.50 – 5.31 – 42.85 – 19.34 – 7.45 –
28 85.02 – 50.99 – 6 – 42.07 – 25.97 – 8.16 –
35 87.22 – 53.16 – 4.12 – 41.81 – 23.53 – 8.68 –
L – Lymphocytes (evaluated within total leukocyte events); B – B cells (CD19+ lymphocytes); NK – Natural Killer cells (CD49b+ lympho-cytes); T – T cells (CD3+ lympholympho-cytes); IM – infected mice; CM – control mice.
To evaluate whether there were differences in the TCRαβ and TCRγδ T cell populations or not, CD4 and CD8 expres-sion was assessed in TCRαβ+T cells (identified by the ex-pression of the TCRβ chain). Figure 2 represents the three values obtained for each group, except for day 35, which had only two mice because one mouse died. No significant differ-ences were observed between infected and non-infected mice. Due to the small sample size, no statistical tests could be ap-plied. At day 35, only DN TCRαβ+T cells (3) followed the control tendencies. Compared to control values, CD4+TCRαβ+ T cells (1) percentage values showed consistently higher val-ues in infected mice, and DP (4) and CD8+TCRαβ+T cells (2) showed consistently lower values in infected mice. Generally, variability appeared to be larger for the infected group.
The significance of the results was limited due to the small number of mice. In lymphocyte subpopulations (B cells, NK cells, T cells, and within T cells, CD4+and CD8+ cells) no statistically significant differences were observed among the mean values of both infected and reinfected mice. Among all populations in this study, CD8+and DN cells pre-sented lower p-values than all the other cells (CD8+, p= 0.054 and DN, p= 0.105), which, although not statistically signifi-cant, is an interesting result that deserves attention in future research studies.
Finally, CD25 expression was also evaluated in the CD3+CD4+T cell population. CD25 is an activation marker in T cells, and within a special population of T cells with regu-latory properties (Treg), that express high levels of this
mole-Fig. 2.Variability of TCRαβ+T cell subpopulations. Graphics showing the variability in the data obtained from the analysis of peripheral blood, along the infection period (35 days), of TCRαβ+T cells subpopulations divided according to their expression of CD4 and CD8: CD4+TCRαβ+ T cells (graphic 1), CD8+TCRαβ+T cells (graphic 2), DN TCRαβ+T cells (graphic 3) and DP TCRαβ+T cells (graphic 4). Each graphic rep-resents the results obtained for a group of three mice [first (-), second (dot), and third (-) values], infected and control, except for day 35, in which a mouse died in the infected group
Type Infected Control
Type Infected Control
Type Infected Control
Type Infected Control
100
90
60
40
20
0
40
30
20
10
0
8
6
4
2
0
8
4
2
0
%
D
N
T
C
R
α
β
+ T
c
e
ll
s
%
C
D
4
+ T
C
R
α
β
+ T
c
e
ll
s
%
D
P
T
C
R
α
β
+ T
c
e
ll
s
%
C
D
8
+ T
C
R
α
β
+ T
c
e
ll
s
3 7 14 21 25 28 35 3 7 14 21 25 28 35
3 7 14 21 25 28 35 3 7 14 21 25 28 35
Days of infection
Days of infection
Days of infection
Days of infection
cule. Thus, the expression of CD25 was assessed assuming two populations: CD3+CD4+CD25+and CD3+CD4+CD25high T cells. The analysis of the graphic 1 in Fig. 3 suggests that CD3+CD4+CD25+T cells were generally present in higher val-ues in infected animals, 68.80%–83.42%, versus 52.21%– 73.94% in control mice. No significant differences between both groups of mice were observed in each set point and, at day 35, both groups presented similar values. Furthermore, the population of CD4+T cells showing higher CD25 expres-sion (CD3+CD4+CD25high T cells), presented significantly higher percentage values in infected mice throughout the study (Fig. 3, graphic 2). These cells, a small percentage within CD3+CD4+T cells (5.04%–9.86% in infected mice versus 3.8%–5.0% in control mice), presented even higher values in the infected group at days 21 and 25, a period of time during which the reinfection process occurred (day 22).
Analysis of spleen cell populations: Spleen samples were collected at each time point in infected mice, while in control mice, spleen samples were analyzed only for the first time point (day 3). Since lymphocytes are the major population in the spleen, only they were evaluated (Table III). For all types of lymphocytes, a pattern can be observed across the two in-fection challenges, where after the first week the lymphocyte percentages tended to increase (days 14, 28 and 35), while B cells showed an increase immediately after infection, and then they oscillated, near the mean value found in the spleen of the control group (50.7%). NK cells started with a 2.55% mean value then increased constantly to 6% until day 35, in which they started to decrease to 4.12%.
CD3+, CD4+and CD8+T lymphocytes were also analyzed. In CD3+T cells, a peak was observed at days 7 (47.75%) and 14 (50.73%) PI, reaching higher values than those observed in the spleen of the control group (44.92%). However, after this
period, the percentage values within this population plateaued at a slightly lower level than the peak value. As for CD4+and CD8+T cells, both populations increased one week after the infection challenge (day 7). Nevertheless, after this period, both populations percentages started to decrease (days 21 and 25), closer to those observed in control mice. The reinfection episode, in day 22, somewhat mimics what was observed after the first infection point, as both populations achieved higher values a week after (day 28).
Discussion
The more we know about immune effector mechanisms that protect vertebrate hosts against opportunistic pathogens, the better the chances are to develop immunotherapeutic strate-gies for controlling diseases such as cryptosporidiosis. C.
parvumis predominantly an intestinal pathogen. However, we decided to analyze immunophenotypic changes and potential differences in cell population from peripheral blood and spleen in orally infected mice because modifications induced in the immune system to overcome the infection, may be reflected as changes in peripheral blood and spleen cell populations.
Although the majority of the studies have been done on neonatal and immunosuppressed mice (Certad et al. 2007), we consider it important to study what occurs in the immuno-competent animal because this type of infection also takes place in immunocompetent persons.
In previous studies using the same animal model (Kapel
et al. 1996, Marriotte et al. 2004), infective doses ranged from 104to 106oocysts and infection was not monitored beyond 27 days PI. So, in this work, we decided to monitor the infection for a longer period of time (35 days), with seven time points
Fig. 3.Variability of CD25 expression in CD3+CD4+T cells. Graphics showing the variability in the data obtained from the analysis of peripheral blood, along the infection period (35 days), of CD25 expression in CD3+CD4+T cells: CD3+CD4+CD25+T cells (graphic 1) and CD3+CD4+CD25++T cells (graphic 2). Each illustration represents the results obtained for a group of three mice [first (-), second (dot), and third (-) values], infected and control, except for day 35, in which a mouse from infected group died
15
10
5
0
3 7 14 21 25 28 35 100
80
60
40
20
0
3 7 14 21 25 28 35
%
C
D
3
+C
D
4
+C
D
2
5
++
T
c
e
ll
s
Days of infection Days of infection
%
C
D
3
+C
D
4
+C
D
2
5
+ T
c
e
ll
s
Type Infected Control
Type Infected Control
and a higher inoculum of oocysts (1 x 10⁶), instead of in-creasing the number of mice. With this first approach, we at-tempted to understand the tendencies of the cell population’s evolution.
Due to the high amount of administered inoculum by oral gavage to mice, it would be expected to find a large amount of oocysts in feces, which did not occur. Our data showed that the onset of parasite shedding was low and only detectable by mi-croscopy on days 3 and 7 PI. The presence of DNA of C.
parvumin feces was detected on days 3, 7 and 14 PI. Those events might be due to the fact that oocysts have undergone excystation or have been destroyed during the normal gut tran-sit. Furthermore, mice did not show any signs of disease such as weight loss, diarrhea or inactivity. In contrast to humans, who are susceptible to infection throughout life, animals in-cluding mice develop resistance to infection after the neona-tal period.
Small intestinal sections from infected mice euthanized on days 3, 7, 14, 21, 25, 28 and 35 PI were screened for intracel-lular stages of the parasites. Histological examination with hematoxylin-eosin stain showed 5–10 intracellular parasite stages in the superficial border of villi of intestine. However, there was no evidence of histopathological changes due to the infection when compared with the intestinal sections of the uninfected mice, in agreement with previous studies (Current and Garcia 1991; Wyatt et al. 1997; Del Coco et al. 2012). Particular attention was given to the possibility of an influx of eosinophils to the site of infection that could be correlated with the increased number of systemic eosinophils, but we did not observed any changes consistent with infection.
Spleen sections were observed with hematoxylin-eosin for the same time points and the possible correlation between al-terations in the blood and spleen cell populations was also studied. On days 25 and 28 PI (days 3 and 6 PRI, respec-tively), all of the euthanized mice presented with enlarged spleens (splenomegaly) with a size three times higher than the control mice. In the enlarged spleens we could observe that the proportion of both red and white pulps were similar. A mild congestion was observed in the red pulp of the enlarged spleens due to the increase in the cellular density; while the cellular density of the white pulp was similar in the spleens of both infected and control mice. Enlarged spleens may be at-tributable, in part, to the observed red pulp congestion. Thus, splenomegaly may be consistent with reinfection and related to the reinoculation event, may be due to stimulation of the immune response in the spleen, in agreement with what was reported by other authors (Miller and Schaefer 2007).
In this work, we expected to see an inflammatory response initiated by C. parvumattachment and development in the small intestine, characterized by an increase of circulating neutrophils followed by a gradual increase in circulating lym-phocytes immediately after infection. Effectively, we observed an increase of neutrophils at day 3 PI, followed by decrease of their percentage until day 21 PI, and a new increase on day 25 PI (3 days PRI) followed by decrease until day 35 PI reaching
similar values to the control group. These data suggest an ini-tial inflammatory response to inoculation events (primary and secondary infection), with an increase of circulating neu-trophils number, perhaps followed by the potential recruitment of these cells towards the affected tissues. However, the per-centage of neutrophils in control mice also showed fluctua-tion, though not as significant when compared with the values in infected mice.
Relative to eosinophils after infection and reinfection there was always an initial increase in their percentage (two to four times the control mice), followed by a decrease to values ob-served in control group at day 35 in a similar way to what was observed for neutrophils. This may be the characteristic pro-file exhibited by eosinophils during an infection by C. parvum, since increased eosinophilia has also been identified as a hall-mark of infection with parasites like Toxoplasma gondiiand
Plasmodiumspp. (Kasper and Buzoni-Gatel 2001, Male et al. 2006).
Relative to other cell populations, no significant variation was observed for monocytes among infected and control mice. In this context, it would be of interest to study if the monocytes express an activation marker (e.g. Gr-1+), which can be found in the mesenteric lymph nodes (MLNs) or lamina propria.
For B cells an increased was observed throughout the in-fection. However, between days 25 and 35, these values did not increase as observed in the values of the control group, probably related to T cell increase at these time points, which is more evident than the increase of B cells percentage.
NK cells values were higher in infected mice than in the control group. However, on day 35, we observed a percentage decrease in infected animals compared to the control group. Again, this difference might be related to T cell compartment within lymphocytes, which did not decrease in infected ani-mals (51.7%) as occurred in control aniani-mals (30.94%). More conclusive results were not possible due to the lack of absolute counting values for these cell populations.
In this study, we decided to analyze the spleen of the in-fected mice since it is the organ of the lymphatic system that has been less studied in the context of an infection by C.
parvum(mostly studied organs are Peyer’s patches or mesen-teric lymph nodes). In the spleen, the increase of CD4+and CD8+T cells one week after infection (day 7) and six days after reinfection (day 28), followed by its decrease, may be related to the establishment of the adaptive response upon which the protection against the infection depends. The low input presented by B cells may be related to the less important role of antibodies in this type of intracellular infection. Splenomegaly observed in mice challenged with C. parvum
oocysts but not harboring pathogen developmental stages in the intestine is intriguing but probably the result of the in-creased cell proliferation. Considering the association of IgE with other extracellular parasites and the relevance of IgA in the mucosa of respiratory and digestive systems (Male et al. 2006), it would be important to study this type of humoral re-sponse in future studies.
The population of CD3+CD4+CD25high, which is related to Treg cells, became progressively higher with time, and the val-ues in the infected group were two times higher than the con-trol group. In parasitic infectious diseases, as portrayed in an infection by Schistosoma mansoni, Treg cells may be induced in antigen-specific manner and may suppress tissue destruc-tion resulting from immune responses (Watanabe et al. 2007). These authors showed that the percentage of circulating Treg cells was increased in some people infected with S. mansoni, and effective treatment decreased the levels of these cells. In the context of the present study, we hypothesized that the be-havior of Treg cells may be similar, which needs to be proven in future studies and we would recommend using Foxp3 stain-ing and/or IL-7R stainstain-ing for a better discrimination between activated and Treg cells (Levings et al. 2006, Belkaid and Tar-bell 2009).
There were no statistically significant differences among the mean values of infected and reinfected mice in most pe-ripheral blood cell populations. However, it is interesting to notice that there was a greater variability after reinfection. In spite of the small sample size, and consequent p-values ob-tained (always greater than the chosen significance level), these findings allowed us to consider the hypothesis that this variability may be related to the fact that mice were older at PRI, and as such, the immune system was more mature. Al-though the age-related changes may be rather subtle, they may become very relevant during the course of the disease. This may explain the greater variability in the collected data after reinfection with oocysts of C. parvum. Additionally, some au-thors indicate that age should be considered in the selection of appropriate mouse models for immunological research (Pinchuk and Filipov 2008). This was one of the strongest rea-sons for choosing four-week-old animal model to understand how the immune system responds in the context of an infec-tion by C. parvumsince they are not yet in adulthood and the immune system is almost mature.
In spite of the numerous advances made in understanding the immune response to C. parvum, a significant amount of facts remains unknown. Limited information is available on the specific subset and function of the CD4+ cells that are re-quired for protection against infection.
In conclusion, our data provides the first information about the evaluation of C. parvumspecific cell-mediated response trends in immunocompetent mice. These results should be taken as a starting point for more deep studies to be performed with the main objective of understanding the role of innate im-mune response in the context of this infection in immuno-competent animals.
Acknowledgments. We would like to express our gratitude to Moussa Elbayoumy, MD, for critical review and linguistic editing. We are gra-teful to Glória Nunes from CEDOC, Faculdade de Ciências Médicas, Universidade Nova de Lisboa, for laboratory assistance. Vera Codices was supported by a PhD grant (SFRH/BD/46558/2008) from Funda-ção para a Ciência e a Tecnologia, Portugal.
References
Aguirre S.A., Mason P.H., Perryman L.E. 1994. Susceptibility of major histocompatibility complex (MHC) class I- and MHC class II-deficient mice to Cryptosporidium parvuminfection.
Infection and Immunity, 62, 697–699.
Alves M., Matos O., Antunes F. 2001. Multilocus PCR-RFLP analy-sis of Cryptosporidiumisolates from HIV-infected patients from Portugal. Annals of Tropical Medicine and Parasitol-ogy, 95, 627–632.
Alves M., Matos O., Spano F., Antunes F. 2000. PCR-RFLP analy-sis of Cryptosporidium parvumisolates from HIV-infected patients in Lisbon, Portugal. Annals of Tropical Medicine and Parasitology, 94, 291–297.
Alves M., Xiao L., Sulaiman I., Lal A.A., Matos O., Antunes F. 2003. Subgenotype analysis of Cryptosporidiumisolates from hu-mans, cattle, and zoo ruminants in Portugal. Journal of Clin-ical Microbiology, 41, 2744–2747. DOI: 10.1128/JCM.41.6. 2744-2747.2003.
Baecher-Allan C., Wolf E., Hafler D.A. 2005. Functional analysis of highly defined, FACS-isolated populations of human regula-tory CD4+CD25+ T cells. Clinical Immunology, 115, 10–18. DOI: 10.1016/j.clim.2005.02.018.
Banham A.H. 2006. Cell-surface IL-7 receptor expression facilitates the purification of FOXP3(+) regulatory Tcells. Trends in
Im-munology, 27, 541–544. DOI: 10.1016/j.it.2006.10.002. Belkaid Y., Tarbell K. 2009. Regulatory T cells in the control of
host-microorganism interactions. Annual Review of Immunology, 27, 551–589. DOI: 10.1146/annurev.immunol.021908.132723. Blanshard C., Jackson A.M., Shanson D.C., Francis N., Gazzard B.G. 1992. Cryptosporidiosis in HIV-seropositive patients. Quar-terly Journal of Medicine, 85, 813–823.
Borad A., Ward H. 2010. Human immune responses in cryp-tosporidiosis. Future Microbiology, 5, 507–519. DOI: 10.2217/ fmb.09.128.
Borrego L.M., Arroz M.J., Videira P., Martins C., Guimarães H., Nunes G., Papoila A.L., Trindade H. 2009. Regulatory cells, cytokine pattern and clinical risk factors for asthma in infants and young children with recurrent wheeze. Clinical and Ex-perimental Allergy, 39, 1160–1169. DOI: 10.1111/j.1365-2222.2009.03253.x.
Casemore D.P., Armstrong M., Sands R.L. 1985. Laboratory diag-nosis of cryptosporidiosis. Journal of Clinical Pathology, 38, 1337–341.
Certad G., Ngouanesavanh T., Guyot K., Gantois N., Chassat T., Mouray A., Fleurisse L., Pinon A., Cailliez J.C., Dei-Cas E., Creusy C. 2007. Cryptosporidium parvum, a potential cause of colic adenocarcinoma. Infectious Agents and Cancer, 21, 2–22. DOI: 10.1186/1750-9378-2-22.
Current W.L., Garcia L.S. 1991. Cryptosporidiosis. Clinical Micro-biology Reviews, 4, 325–358.
Del Coco V.F., Córdoba M.A., Sidoti A., Santín M., Drut R., Ba-sualdo J.A. 2012. Experimental infection with Cryptosporid-ium parvum IIaA21G1R1 subtype in immunosuppressed mice. Veterinary Parasitology, http://dx.doi.org/10.1016/j.vet-par.2012.06.033.
Fayer R., Morgan U., Upton S.J. 2000. Epidemiology of Cryp-tosporidium: transmission, detection and identification. In-ternational Journal for Parasitology, 30, 1305–1322. DOI: 10.1016/S0020-7519(00)00135-1.
Fayer R., Ungar B.L. 1986. Cryptosporidium spp. and Cryptospo-ridiosis.Microbiological Reviews, 50, 458–483.
Fontenot J.D., Gavin M.A., Rudensky A.Y. 2003. Foxp3 programs the development and function of CD4+CD25+ regulatory T cells. Nature Immunology, 4, 330–336. DOI: 10.1038/ni 904.
Glaberman S., Moore J.E., Lowery C.J., Chalmers R.M., Sulaiman I., Elwin K., Rooney P.J., Millar B.C., Dooley J.S., Lal A.A., Xiao L. 2002. Three drinking-water-associated cryptospo-ridiosis outbreaks, Northern Ireland. Emerging Infectious Dis-eases, 8, 631–633. DOI: 10.3201/eid0806.010368.
Gomez Morales M.A., Mele R., Ludovisi A., Bruschi F., Tosini F., Pozio E. 2004. Cryptosporidium parvum-specific CD4 Th1 cells from sensitized donors responding to both fractionated and recombinant antigenic proteins. Infection and Immunity, 72, 1306–1310. DOI: 10.1128/IAI.72.3.1306-1310.2004. Kapel N., Benhamou Y., Buraud M., Magne D., Opolon O., Gobert
J.G. 1996. Kinetics of mucosal ileal gamma-interferon re-sponse during cryptosporidiosis in immunocompetent neona-tal mice. Parasitology Research, 82, 664–667. DOI: 10.1007/ s004360050182.
Kasper L.H., Buzoni-Gatel D. 2001. Ups and downs of mucosal cel-lular immunity against protozoan parasites. Infection and Im-munity, 69, 1–8. DOI: 10.1128/IAI.69.1.1–8.2001.
Lean I.S., McDonald V., Pollok R.C. 2002. The role of cytokines in the pathogenesis of Cryptosporidiuminfection. Current Opin-ion in Infectious Diseases, 15, 229–234.
Levings M.K., Allan S., d’Hennezel E., Piccirillo C.A. 2006. Func-tional dynamics of naturally occurring regulatory T cells in health and autoimmunity. Advances in Immunology, 92, 119– 155. DOI: 10.1016/S0065-2776(06)92003-3.
Liu W., Putnam A.L., Xu-Yu Z., Szot G.L., Lee M.R., Zhu S., Gottlieb P.A., Kapranov P., Gingeras T.R., Fazekas de St Groth B., Clay-berger C., Soper D.M., Ziegler S.F., Bluestone J.A. 2006. CD127 expression inversely correlates with FoxP3 and suppressive func-tion of human CD4+ Treg cells. Journal of Experimental
Medi-cine, 203, 1701–1711. DOI: 10.1084/jem.20060772.
Mac Kenzie W.R., Hoxie N.J., Proctor M.E., Gradus M.S., Blair K.A., Peterson D.E., Kazmierczak J.J., Addiss D.G., Fox K.R., Rose J.B., Davis J.P. 1994. A massive outbreak in Mil-waukee of Cryptosporidiuminfection transmitted through the public water supply. New England Journal of Medicine, 331, 161–167.
Male D., Brostoff J., Roth D.B., Roitt I. 2006. Immunity to protozoa and worms. In: (Ed. Mosby Elservier) Immunology. 7th. Canada, 277–297.
Maloy K.J., Powrie F. 2001. Regulatory T cells in the control of im-mune pathology. Nature Immunology, 2, 816–822. DOI: 10. 1038/ni0901-816.
Mariotte D., Comby E., Brasseur P., Ballet J.J. 2004. Kinetics of spleen and Peyer’s patch lymphocyte populations during gut parasite clearing in Cryptosporidium parvuminfected suck-ling mice. Parasite Immunology, 26, 1–6. DOI: 10.1111/ j.0141-9838.2004.00676.x.
Matos O., Alves M., Xiao L., Cama V., Antunes F. 2004. Cryp-tosporidium felisand C. meleagridisin persons with HIV, Por-tugal. Emerging Infectious Diseases, 10, 2256–2257. McDonald V. 2000. Host cell-mediated responses to infection with
Cryptosporidium. Parasite Immunology, 22, 597–604. DOI: 10.1046/j.1365-3024.2000.00343.x.
McDonald V., Bancroft G.J. 1994. Mechanisms of innate and ac-quired resistance to Cryptosporidium parvum infection in SCID mice. Parasite Immunology, 16, 315–320.
(Accepted October 30, 2012)
McDonald V., Deer R., Uni S., Iseki M., Bancroft G.J. 1992. Immune responses to Cryptosporidium murisand Cryptosporidium parvumin adult immunocompetent or immunocompromised (nude and SCID) mice. Infection and Immunity, 60, 3325– 3331.
Miller T.A., Schaefer F.W.3rd. 2007. Characterization of a Cryp-tosporidium murisinfection and reinfection in CF-1 mice. Vet-erinary Parasitology, 144, 208–221. DOI: 10.1016/j.vetpar. 2006.10.026.
O’Garra A., Vieira P. 2004. Regulatory T cells and mechanisms of immune system control. Nature Medicine, 10, 801–805. DOI: 10.1038/nm0804-801.
Perryman L.E., Mason P.H., Chrisp C.E. 1994. Effect of spleen cell populations on resolution of Cryptosporidium parvum infec-tion in SCID mice. Infection and Immunity, 62, 1474–1477. Petry F., Jakobi V., Tessema T.S. 2010. Host immune response to
Cryptosporidium parvuminfection. Experimental Parasitol-ogy, 126, 304–309. DOI: 10.1016/j.exppara.2010.05.022. Pinchuk L.M., Filipov N.M. 2008. Differential effects of age on
cir-culating and splenic leukocyte populations in C57BL/6 and BALB/c male mice. Immunity and Ageing, 11, 5–11. DOI: 10.1186/1742-4933-5-1.
Riggs M.W. 2002. Recent advances in cryptosporidiosis: the immune response. Microbes and Infection, 4, 1067–1080. DOI: 10. 1016/S1286-4579(02)01631-3.
Theodos C.M. 1998. Innate and cell-mediated immune responses to
Cryptosporidium parvum. Advances in Parasitology, 40, 87– 119.
Watanabe K., Mwinzi P.N, Black C.L, Muok E.M, Karanja D.M, Secor W.E., Colley D.G. 2007. T regulatory cell levels de-crease in people infected with Schistosoma mansonion ef-fective treatment. American Journal of Tropical Medicine and Hygiene, 77, 676–682.
Waters W.R., Harp J.A. 1996. Cryptosporidium parvuminfection in T-cell receptor (TCR)-α- and TCR-δ-deficient mice. Infection and Immunity, 64, 1854–1857.
Wyatt C.R., Brackett E.J, Perryman L.E., Rice-Ficht A.C., Brown W.C., O’Rourke K.I. 1997. Activation of intestinal intraep-ithelial T lymphocytes in calves infected with Cryptosporid-ium parvum. Infection and Immunity, 65, 185–190.
Xiao L., Alderisio K.A., Jiang J. 2006. Detection of Cryptosporidium
oocysts in water: effect of the number of samples and analytic replicates on test results. Applied and Environmental Micro-biology, 72, 5942–947. DOI: 10.1128/AEM.00927-06. Xiao L., Fayer R. 2008. Molecular characterization of species and
genotypes of Cryptosporidiumand Giardiaand assessment of zoonotic transmission. International Journal for Para-sitology, 38, 1239–1255. DOI: 10.1016/j.ijpara.2008.03.006. Xiao L., Feng Y. 2008. Zoonotic cryptosporidiosis. FEMS Immunol-ogy and Medical MicrobiolImmunol-ogy, 52, 309–323. DOI: 10.1111/ j.1574-695X.2008.00377.x.
Xiao L., Ryan U.M. 2008. Molecular epidemiology. In: (Eds. R. Fayer and L. Xiao)Cryptosporidiumand Cryptosporidiosis. CRC Press and IWA Publishing, Boca Raton, FL, 119–171.