REMOVAL
Graziela Jardim Pacheco, Elisa Mara Prioli Ciapina, Edelvio de Barros Gomes, Nei Pereira Junior*
Laboratórios de Desenvolvimento de Bioprocessos, Departamento de Engenharia Bioquímica, Universidade Federal do Rio de
Janeiro, Faculdade de Química, Centro de Tecnologia, Rio de Janeiro, RJ, Brasil.
Submitted: June 15, 2009; Returned to authors for corrections: January 17, 2010; Approved: March 29, 2010.
ABSTRACT
The influence of different nutrients on biosurfactant production by Rhodococcus erythropolis was investigated. Increasing the concentration of phosphate buffer from 30 up through 150 mmol/L stimulated
an increase in biosurfactant production, which reached a maximum concentration of 285 mg/L in shaken
flasks. Statistical analysis showed that glycerol, NaNO3,MgSO4 and yeast extract had significant effects on
production. The results were confirmed in a batchwise bioreactor, and semi-growth-associated production
was detected. Reduction in the surface tension, which indicates the presence of biosurfactant, reached a
value of 38 mN/m at the end of 35 hours. Use of the produced biosurfactant for washing crude
oil-contaminated soil showed that 2 and 4 times the critical micellar concentration (CMC) were able to remove
97 and 99% of the oil, respectively, after 1 month of impregnation.
Key words: Biosurfactant production, oil removal, Rhodococcus erythropolis.
INTRODUCTION
The term surfactant is an abbreviation of the expression
“surface active agents” (8). These compounds have been
exhaustively studied, and they are fundamentally distinguished
by their amphiphilic and amphipathic characteristics and by
their ability to decrease surface and interfacial tensions of
liquids. Biosurfactants are surfactants produced by
microorganisms, either directly in microbial cell surfaces or by
extracellular secretion. As amphiphilic molecules,
biosurfactants contain hydrophilic and hydrophobic portions,
and their structures are typically composed of one or more
classes of compounds, including mycolic acids, glycolipids,
polysaccharide-lipid complexes, lipoproteins, lipopeptides,
phospholipids, and/or the microbial cell surface itself (12, 23).
The main biosurfactant market is the petroleum industry,
where they have been incorporated into oil formulations and
utilized in petroleum production and bioremediation. The
advantages ascribed to biosurfactants include: their
biodegradability, their reduced toxicity and the possibility to be
produced by renewable raw material (16). These first two
advantages make biosurfactants preferable to chemical
surfactants, particularly for environmental applications.
Consequently, enhanced oil recovery as well as soil
bioremediation represents a large market (2, 18, 19). Due to
their hydrophobicity, oil hydrocarbons bind consistently to soil
particles. They also form holes in soil that may exclude water
and nutrients. The surface area of oil can be increased by
adding synthetic or biological surfactants, which increases the
mobility and solubility of hydrocarbons and favors microbial
degradation (15).
It has been reported that biosurfactants produced by the
bacterial genus Rhodococcus are glycolipids with tensoactive properties (10). The bacterial cell wall of Rhodococcus has a highly organized and complex cell envelope, formed by a 30 to
54 carbon atom-containing peptidoglycan-arabinoglycan
skeleton bonded to mycolic acids that represent more than 40%
of the total cell wall. These acids can be found partially free as
trehalose dimycolates and monomycolic lipids. Mycolic acids
are 2-alkyl-3-hydroxy fatty acids of high molecular mass that
are found exclusively in the cell envelope of bacteria belonging
to the mycolata taxa, in which Rhodococcus spp. are included (20).
Studies on the kinetics of biosurfactant production and the
nutritional requirements of microorganisms can generate
important information about microbial metabolism that allows
these parameters to be adjusted to meet the needs of
biotechnology. Therefore, we investigated the influence of
nutritional parameters and culture conditions on biosurfactant
production by a strain of Rhodococcus erythropolis, and then we applied this knowledge to the treatment of crude
oil-contaminated soil.
MATERIALS AND METHODS
Microorganism and growth conditions
Rhodococcus erythropolis ATCC 4277 was obtained from the bacteria collection of the Department of Microbiology,
University of São Paulo, Brazil. The inoculum was grown in
sterilized medium as described in Ciapina et al.,2006, (4) and the cells were centrifuged (9000 x g) and used as fresh
inoculum for shaken flask and bioreactor experiments.
Shaken flask experiments
The basal medium used for all experiments contained
NaNO3 3.4 g; NaCl 1.0 g; MgSO4.7H2O 0.2 g; CaCl2.2H2O
0.02 g; FeCl3.7H2O 0.01 g per liter distilled water, pH 7.0.
Potassium phosphate buffer concentration varied from 30 up to
150 mmol/L for specific experiments. Glycerol was added as a
carbon source to a final concentration of 2% (w/v). The
medium was sterilized for 15 min at 121oC. The experiments were performed at 200 rpm, 37oC for 5 days.
Batch Experiment in Bioreactor
A bioreactor Biostat® B 2.0 L model (B. Braun Biotech International, Germany) was run at 37oC with a constant dissolved oxygen level at 20% of saturation in the fermentation
medium (maintained by the intensity of the agitation). The pH
was maintained at 7.0 by automatic addition of hydrochloric
acid and sodium hydroxide solutions.
Experimental Design
A 28-4 fractional factorial design was used to evaluate biosurfactant production as a function of glycerol, NaNO3,
NaCl, MgSO4.7H2O, FeCl3.7H2O, CaCl2.2H2O, yeast extract
and a trace element solution, which composition is as follows
(in g/L): ZnSO4.7H2O, 11.0; MnSO4.H2O, 6.0; FeSO4.7H2O,
1.0; CuSO4.5H2O, 0.04; CoSO4.7H2O, 0.04; H3BO3, 0.06; KI,
0.01; EDTA, 5.0. These independent variables with their real
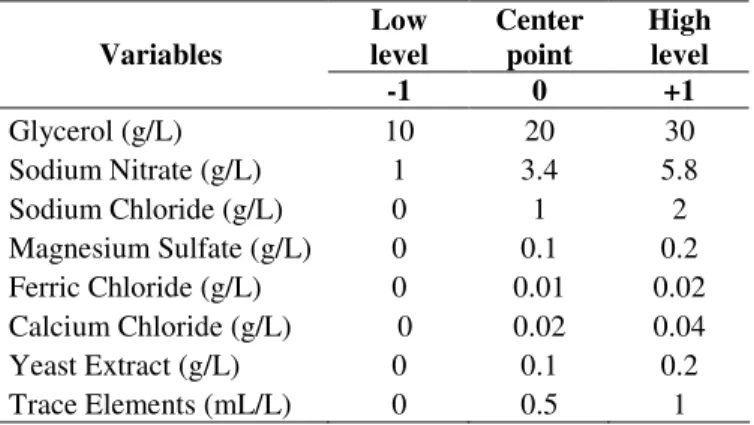
and encoded values are presented in Table 1. Statistical
analysis was performed using Statistica Statsoft Version 6.0 (Tulsa, Oklahoma, USA).
Table 1. Variables studied and their levels in the 28-4 fractional factorial experimental design.
Low level
Center point
High level Variables
-1 0 +1
Glycerol (g/L) 10 20 30
Sodium Nitrate (g/L) 1 3.4 5.8
Sodium Chloride (g/L) 0 1 2
Magnesium Sulfate (g/L) 0 0.1 0.2
Ferric Chloride (g/L) 0 0.01 0.02
Calcium Chloride (g/L) 0 0.02 0.04
Yeast Extract (g/L) 0 0.1 0.2
Analytical methods
Microbial growth was monitored by biomass
measurements by means of optical density observations of the
cell suspension at 600 nm, followed by normalizing to the dry
cell weight from a calibration plot.
Biosurfactant production was estimated by the
concentration of polysaccharide. The choice of this method for
surfactant quantitative determination was due to the ability of
R. erythropolis to produce predominantly polysaccharide-class surfactant when glycerol is used as the carbon source.
Polysaccharides were obtained by precipitation of the cell-free
spent medium with 95% ethanol (12). After extraction, total
sugars were estimated by the phenol-sulfuric method (6).
The emulsifying activity of the polysaccharide previously
isolated was estimated by the method of Cooper and
Goldenger, 1987 (5). Samples of 2 mL of cell-free spent
medium were precipitated as described previously, and the
precipitate was added to 2 mL of n-hexadecane and vortexed for 2 minutes and left to stand for 24 h. The Emulsification
Index at 24 h (EI24) was given as a percentage consisting of the
height of the emulsified layer (mm) divided by the total height
of the liquid column (mm). The surface tension of the cell-free
spent medium was measured by Du Nouy type tensiometer
(Krüss Tensiometer, K11 model - Germany) utilizing the ring
method as recommended by ASTM (1).
Glycerol concentration was analyzed by
enzymatic-colorimetric assay using a triglycerides kit (GPO/POD –
CELM/Brazil). The nitrate concentration was determined
colorimetrically by the brucine sulfate method (4).
Washing experiments
The method for washing crude oil-contaminated soil was
from Urum et al, 2003 (21). Four levels of biosurfactant
concentration were utilized: equal to the CMC, twice below the
CMC, twice above the CMC and four times above the CMC
(0.45 g/L, 0.23 g/L, 0.9 g/L and 1.8 g/L, respectively).
Contaminated soil samples were divided into three groups:
immediately contaminated, one-month contaminated and
two-month contaminated. Five grams of the contaminated soil was
introduced into flasks containing 25 mL of biosurfactant
(precipitated polysaccharide) solution. Flasks were incubated
at 30ºC, 300 rpm, 120 min (4). After 3 min of decantation, 1
mL of the supernatant was washed with n-hexane to remove
the crude oil extract (21). Absorbance of the n-hexane/crude oil
solution was measured at 294 nm using DU70
Spectrophotometer (Beckman, Germany).
RESULTS AND DISCUSSION
Effect of phosphate concentration
The phosphate buffer used to prevent pH decline had a
strong influence on biosurfactant production and cell growth.
In this study we varied the concentration of the phosphate
buffer (K2HPO4:KH2PO4 1:1) from 30 to 300 mmol/L and
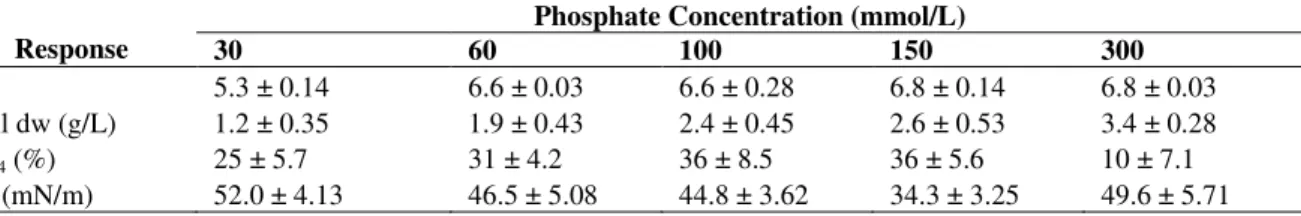
evaluated its effect on fermentation. As shown in Table 2,
concentrations equal to or higher than 60 mmol/L were
sufficient to maintain the pH of the culture medium throughout
the experiment. Although higher concentrations yielded more
biomass, our results suggest that a phosphate concentration of
300 mmol/L modifies the surfactant properties of the product,
as indicated by reductions in EI24 and increases in surface
tension. Higher values of EI24 were obtained when 100 and 150
mmol/L phosphate buffer was added to the culture. At these
concentrations, surface tension was reduced to 44.8 and 34.3
mN/m, respectively, comparable with values reported in the
literature (7, 17).
Table 2. Observed values of pH, cell concentration, EI24 and surface tension (ST) after 5 d of fermentation of R. erythropolis
using potassium phosphate varying from 30 to 300 mmol/L
Phosphate Concentration (mmol/L)
Response 30 60 100 150 300
pH 5.3 ± 0.14 6.6 ± 0.03 6.6 ± 0.28 6.8 ± 0.14 6.8 ± 0.03
Cell dw (g/L) 1.2 ± 0.35 1.9 ± 0.43 2.4 ± 0.45 2.6 ± 0.53 3.4 ± 0.28
EI24 (%) 25 ± 5.7 31 ± 4.2 36 ± 8.5 36 ± 5.6 10 ± 7.1
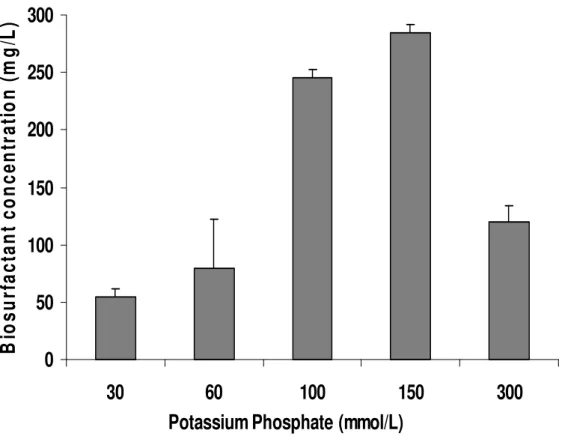
Figure 1, shows the amount of biosurfactant produced by
R. erythropolis after five days of fermentation in different concentrations of phosphate buffer. The results demonstrated
that increasing the concentration from 30 up through 150
mmol/L stimulates biosurfactant production. The maximum
productivity was observed at 150 mmol/L, in which 285 mg/L
of biosurfactant was obtained. This was the concentration used
in further experiments. This behavior is consistent with studies
performed by Kim et al., 1997 (11), who reported a positive influence of phosphate on biosurfactant production by Bacillus subtilis. On the other hand, Bazire etal., 2005 (3) observed that a concentration of 75 µ mol/L of phosphate in LPM63 medium
inhibits the cell-to-cell signal molecule
N-butyryl-L-homoserine lactone (C4-HSL), which is involved in the quorum
sensing system indirectly responsible for biosurfactant production in Pseudomonas aeruginosa.
0
50
100
150
200
250
300
30
60
100
150
300
Potassium Phosphate (mmol/L)
B
io
s
u
rf
a
c
ta
n
t
c
o
n
c
e
n
tr
a
ti
o
n
(
m
g
/L
)
Figure 1. Biosurfactant production by R. erythropolis grown in different concentrations of potassium phosphate. Values are expressed as means ± S.D. (n = 3)
Effect of different nutrients on biosurfactant production
The results of the fractional factorial design with four
center points are depicted in Table 3. The highest yield factor
of product on substrate consumed (YP/S) was obtained in essay
5 (YP/S = 19 mg/g), followed by essay 13 (YP/S = 14.5 mg/g). It
is worthnoting that in both essays the lowest level of glycerol
and sodium nitrate and the highest level of yeast extract were
used. Additionally, the influence of glycerol, sodium nitrate,
and yeast extract on the bioprocess was all statistically
significant with values of p-level < 0.1, resulted from the
Statistica version 6.0 (Microsoft ®). Therefore, these variables were selected as for identifying the optimum region in the
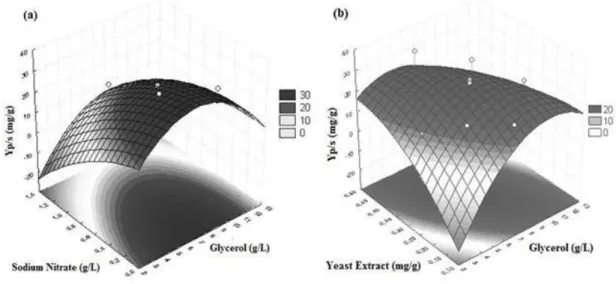
concentration range evaluated (Figure 2). Figure 2 (a)
illustrates the combined effect of sodium nitrate and glycerol
on the production yield factor (YP/S). It is deducible that the
bioprocess performance. In this case, a C:N ratio of 21:1 was
observed, also considering the presence of 10.5% total nitrogen
in the yeast extract (data not shown). These results suggest that
high C:N ratios are favorable for the bioprocess, corroborating
other reports in the literature, which indicate that the
stimulation of biosurfactant synthesis by Rhodococcus sp takes
place under nitrogen-limited conditions (11). Concerning the
yeast extract, even low concentrations of this complex source
of nutrients (0.1-0.2 g/L) enhanced considerably the bioprocess
performance (Table 3 and Figure 2 (b)), pointing out that this
complex source of nutrients is necessary since it induces
highest production of biosurfactant by R. erythropolis.
Table 3. Variables studied (encoded values) and respective response in terms of YP/S in the 28-4 Statistical Fractional Factorial
Design
Run Glycerol NaNO3 NaCl MgSO4 FeCl3 CaCl2 Yeast Extract Trace Elements YP/S mg/g
1 - - - 9,7
2 + - - - - + + + 11,5
3 - + - - + - + + 11,1
4 + + - - + + - - 5,1
5 - - + - + + + - 19,0
6 + - + - + - - + 9,0
7 - + + - - + - + 8,5
8 + + + - - - + - 4,3
9 - - - + + + - + 5,3
10 + - - + + - + - 3,9
11 - + - + - + + - 5,1
12 + + - + - - - + 4,3
13 - - + + - - + + 14,5
14 + - + + - + - - 0,8
15 - + + + + - - - 5,3
16 + + + + + + + + 2,1
Center point 0 0 0 0 0 0 0 0 4,6 ±1,3
Encoded values (-), (0) and (+) represents respectively, low level, center point (intermediate level) and high level for each variable studied. For glycerol, (-), (0) and (+) correspond to 10.0 , 20.0 and 30.0 g/L; for NaNO3 correspond to 1.0, 3.4 and 5.8 g/L; for NaCl correspond to 0.0, 1.0 and 2.0 g/L; for MgSO4 correspond to 0.0, 0.1 and 0.2 g/L; for FeCl3 correspond to 0.00, 0.01 and 0.02 g/L; for CaCl2 correspond to 0.00, 0.02 and 0.04 g/L; for yeast extract correspond to 0.0, 0.1 and 0.2 g/L; and for trace elements (aqueous solution) correspond to 0.0, 0.5 and 1.0 mL/L, respectively.
Bioreactor batch experiment
In order to validate the results obtained in the factorial
experiment, the bioprocess was carried out batchwise in an
instrumented bioreactor. This experiment employed
concentrations of nutrients considerably more favorable for
biosurfactant production.
Figure 3 shows the production of biosurfactant and cell
growth in glycerol (10 g/L), sodium nitrate (1 g/L), yeast
extract (0.2 g/L) and potassium phosphate (150 mmol/L). The
exponential growth of R. erythropolis started after about 7 hours with a specific growth rate ( x) of 0.035 h-1; which
remained constant for approximately 27 hours. Afterwards, the
culture entered stationary phase and the glycerol and sodium
nitrate ratios in the culture were reduced to 2.9 g/L and 0.18
g/L, respectively. Biosurfactant production started in the early
exponential growth phase and continued even after cell growth
had ceased, indicating a typical semi-growth-associated mode
of production. At the end of the bioprocess, the biosurfactant
concentration reached 271 mg/L. The yield factors of
biosurfactant per substrate consumed (YP/S) and per cells grown
(YP/X) were 40.2 mg/g and 301 mg/g, respectively. These
obtained parameters surpassed those found in shaken flasks,
through experimental design. At the end of the experiment
(after 35 hours), the minimum value of surface tension was 38
mN/m (data not shown), and an EI24 of 40% for an
n-hexadecane/water binary system was obtained.
Figure 3. Time-course of growth, biosurfactant production, glycerol and sodium nitrate consumption during cultivation of R. erythropolis in a bioreactor ( biomass [g/L]; ∇sodium nitrate [g/L]; glycerol [g/L]; * biosurfactant [g/L]).
Evaluation of the efficiency of the biosurfactant for washing crude oil-contaminated soil
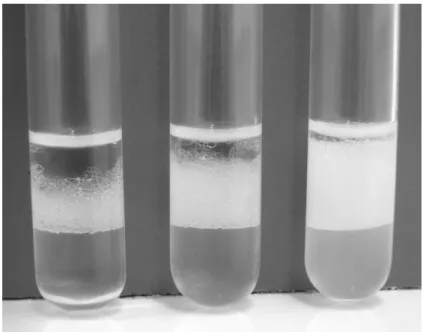
The emulsifying activity of each concentration used in this
experiment is shown in Figure 4. Biosurfactant concentrations
of 0.23 g/L, 0.45 g/L and 0.9 g/L resulted in EI24 values of
27%, 40% and 60%, respectively.
Figure 5 shows the percentage of oil removed from the
crude oil-contaminated soil. It is notable that, immediately after
soil contamination, the oil-removal efficiency of the
biosurfactant was nearly 100% at all concentrations used.
Kuyukina et al., 2005 (13), using biosurfactant produced by
Rhodococcus ruber (utilizing n-hexadecane as the carbon source) at twice the CMC observed removal of 80% of the oil
At 0% biosurfactant concentration (washing solely with
water), the reduction was about 76% for immediately
contaminated soil. However, after a one-month contamination
period, the oil-removal ability was considerably reduced, with
only 7% efficiency in the treatment without biosurfactant.
Biosurfactant oil-removal reached maximum efficiency for
immediately and 1-month contaminated soils only when 0.9
and 1.8 g/L biosurfactant concentrations were applied. These
results corroborate those reported by Ivshna et al., 1998 (9), who found that a concentration 2 g/L of biosurfactant produced
by either Rhodococcus erythropolis or Rhodococcus ruber had the best effect on oil desorption from oil shale.
After a two-month contamination period, the efficiency of
oil removal lowers dramatically, with a maximum value of
18% at the highest concentration of biosurfactant.
Figure 4. EI24 values obtained from biosurfactant solutions with concentrations twice below the CMC, equal to the CMC and
twice above the CMC, from the left to right respectively.
0 20 40 60 80 100
0 0.23 0.45 0.9 1.8
Biosurfactant concentration (g/L)
O
il
r
e
m
o
v
a
l
(%
)
Imediate
1 month
2 months
This result suggests that time is a limiting factor for the
performance of the biosurfactant, possibly due to greater
adsorption of oil to the soil hindering the interaction between
the biosurfactant solution and the oil. As the oil remains for
longer times, the physical and chemical nature of the soil
becomes modified, as noted by Urum et al., 2005 (22). This occurs due to the loss of volatile components and oil of lower
molecular weight, resulting in oil with higher density and
viscosity. This phenomenon, known as aging (because it is time-dependent), is responsible for the persistence of
hydrocarbons in soils because it makes the hydrocarbons less
available to microbial and surfactant action. Additionally, as
reported by Lee et al., 2002 (14), clay and humus adsorption can reduce the effectiveness of (bio)surfactants for soil
remediation, due to the negative charge of clay minerals
interacting with the surfactants (positively or negatively
charged) and decreasing micelle concentration and the extent
of oil solubilization. Conversely, nonionic surfactants are less
likely to be adsorbed to the soil.
CONCLUSIONS
These studies demonstrate that the production of
biosurfactant by R. erythropolis strain ATCC 4277 can be enhanced by the addition of experimentally defined
concentrations of glycerol, sodium nitrate and yeast extract.
Phosphate buffer varying from 60 to 150 mmol/L increases
biosurfactant production and also maintain the proper pH for
the fermentation process. Moreover, the results obtained in
oil-removal experiments indicate the applicability of biosurfactants
to soil bioremediation at low concentrations and at intermediate
contamination periods, such as one month.
ACKNOWLEDGEMENTS
The authors acknowledge the Rio de Janeiro State
Foundation for Science and Technology (FAPERJ); the
Brazilian Council for Research (CNPq) and the Brazilian
Petroleum Company (PETROBRAS) for scholarship and other
financial supports.
REFERENCES
1. ASTM D 971 (1999). 99ª Standard Test Method for Interfacial Tension of Oil Against Water by the Ring. In: Method American Society for Testing Materials. West Conhohocken, Pennsylvania, USA.
2. Banat, I.M.; Makkar, R.S.; Cameotra, S.S. (2000). Potential commercial applications of microbial surfactants. Appl. Microbiol. Biotechnol. 53(5), 495-508.
3. Bazire, A.; Dheilly, A.; Diab, F.; Morin, D.; Jebbar, M.; Haras, D.; Dufour, A. (2005). Osmotic stress and phosphate limitation alter production of cell-to-cell signal molecules and rhamnolipid biosurfactant by Pseudomonas aeruginosa. FEMS Microbiol. Lett. 253(1), 125-131. 4. Ciapina, E.M.P.; Melo, W.C.; Santa Anna, L.M.M.; Santos, A.S.; Freire,
D.M.G.; Pereira Jr, N. (2006). Biosurfactant production by Rhodococcus erythropolis grown on glycerol as sole carbon source. Appl Biochem Biotechnol. 131, 880-886.
5. Cooper, D.G.; Goldenberg, B.G. (1987). Surface active agents from two Bacillus species. Appl. Environ. Microbiol. 53(2):224-229.
6. Dubois, M.; Gilles, K.A.; Hamilton, J.K.; Rebers, P.A.; Smith, F. (1956). Colorimetric method for determination of sugars and related substances. Anal. Chem. 28(3):350-356.
7. Espuny, M.J.; Egido, S.; Rodón, I.; Manresa, A.; Mercandé, M.E. (1996). Nutritional requirements of a biosurfactant producing strain Rhodococcus sp 51T7. Biotechnol. Lett. 18(5), 521-526.
8. Fiechter, A. (1992). Biosurfactants: moving towards industrial application. Trends in Biotechnol. 10(6), 208-217.
9. Ivshina, I.B.; Kuyukina, M.S.; Philp, J.C.; Christofi, N. (1998). Oil desorption from mineral and organic materials using biosurfactant complexes produced by Rhodococcus species. Wrld J. Microbiol. Biotechnol. 14(5), 711-717.
10. Iwabuchi, N.; Sunairi, M.; Urai, M.; Itoh, C.; Anzai, H.; Nakajima, M.; Harayama, S. (2002). Extracellular polysaccharides of Rhodococcus rhodochrous S-2 stimulate the degradation of aromatic components in crude oil by indigenous marine bacteria. Appl. Environ. Microbiol. 68(5), 2337-2343.
11. Kim, H.S.; Yoon, B.D.; Lee, C.H.; Suh, H.H.; Oh, H.M.; Katsuragi, T.; Tani, Y. (1997). Production and properties of a lipopeptide biosurfactant from Bacillus subtilis C9. J. Ferment Bioeng. 84(1), 41-46.
12. Kumar, C.G.; Joo, S.H.; Choi, J.W.; Koo, Y.M.; Chang, C.S. (2004). Purification and characterization of an extracellular polysaccharide from haloakalophilic Bacillus sp. I-450. Enz. Microbial Technol. 34, 673-681. 13. Kuyukina, Maria S.; Ivshina, Irena B.; Makarovb, Sergey O.;
Litvinenkob, Ludmila V.; Cunningham, Colin J.; Philp, James C. (2005). Effect of biosurfactants on crude oil desorption and mobilization in a soil system. Env. Int. 31, 155-61.
surfactant based remediation of hydrophobic organic-contaminated soil. Environ. Int. 27, 681–688.
15. Morgan, P.; Watkinson, R.J. (1989). Hydrocarbon degradation in soils and methods for soil biotreatment, CRC Crit. Rev. Biotechnol. 8(4):305-333.
16. Mulligan, C.N.; Wang, S. (2006). Remediation of a heavy metal contaminated soil by a rhamnolipid foam. In: Yangt, R.N.; Thomas, H.R., (eds). Geoenvironmental engineering. Integrated management of groundwater and contaminated land. Thomas Telford, London, England, p. 544-551.
17. Philp, J.C.; Kuyukina, M.S.; Ivshina, I.B.; Dunbar, S.A.; Christofi, N.; Lang, S.; Wray, V. (2002). Alkanotrophic Rhodococcus ruber as a biosurfactant producer. Appl. Microbiol. Biotechnol. 59(2-3), 318-324. 18. Renner, R. (1997). European Bans on Surfactant Trigger Transatlantic
Debate. Environmental Science Technology. 31(7), 316A - 320A.
19. Scheibenbogen, K.; Zytner, R.G.; LEE, H.; Trevors, J.T. (1994). Enhanced removal of selected hydrocarbons from soil by Pseudomonas aeruginosa UG2 biosurfactants and some chemical surfactants. Journal Chemistry Technology Biotechnology. 59, 53 –59.
20. Sutcliffe, I.C. (1998). Cell envelope composition and organization in the genus Rhodococcus. AntonievanLeeuwenhoek. 74(1-3), 49-58. 21. Urum, K.; Pekdemir, T.; Copur, M. (2003). Optimum conditions for
washing of crude oil-contaminated soil with biosurfactant solutions. Trans. I. Chem. 81(3), 203-209.
22. Urum, K.; Grigson, S.; Pekdemir, T.; McMenamy, S. (2005). A comparison of the efficiency of different surfactants for removal of crude oil from contaminated soils. Chemosphere. 62(9), 1403-1410.