MANGROVEI SK-02 AS A FUNCTION OF GROWTH TEMPERATURE
Kanokwan Chodchoey*; Cornelis Verduyn
Department of Biotechnology, Faculty of Science, Mahidol University, Bangkok, Thailand.
Submitted: February 01, 2011; Returned to authors for corrections: March 29, 2011; Approved: August 15, 2011.
ABSTRACT
Aurantiochytrium mangrovei Sk-02 was grown in a medium containing glucose (40 g/l), yeast extract (10 g/L) and sea salts (15 g/L) at temperatures ranging from 12 to 35°C. The fastest growth (µmax= 0.15 h-1) and
highest fatty acid content of 415 mg/g-dry cell weight were found in the cells grown at 30°C. However, the
cells grown at 12°C showed the highest percentage of polyunsaturated fatty acid (PUFA) (48.6% of total
fatty acid). The percentage of docosahexaenoic acid (DHA) and pentadecanoic acid (C15:0) decreased with
an increase in the growth temperature, whereas, palmitic acid (C16:0), stearic acid (C18:0) and DPA
(C22:5n6) increased with an increase in the growth temperature. The composition of the major lipid class
(%w/w) was slightly affected by the growth temperature. The fluidity of the organelle membrane or
intracellular lipid (by DPH measurement) decreased with an increase in the growth temperatures, while the
plasma membrane fluidity (by TMA-DPH measurement) could still maintain its fluidity in a wide range of
temperatures (15 - 37°C). Furthermore, the distribution of DHA was found to be higher (36 – 54%) in
phospholipid (PL) as compared to neutral lipid (NL) (20 - 41%).
Key words: Anisotropy measurement; Aurantiochytrium sp.; Docosahexaenoic acid; lipid class
composition; membrane fluidity.
INTRODUCTION
Docosahexaenoic acid (C22:6n3; DHA) is an omega-3
polyunsaturated fatty acid (PUFA) and one of the essential
fatty acids necessary for infants during brain and retinal
development. In mammals, DHA can be either acquired
directly from the diet or there is a limited ability to synthesize
it from linoleic acid (C18:3n3) or eicosahexaenoic acid
(C20:5n3) obtained from the diet as precursors, with DHA
finally obtained via a retro-conversion of C24:6n3 to C22:6n3
by the Sprecher pathway (17, 19). The benefits of DHA
(C22:6n3) have been extensively studied in aspects of
nutritional and clinical effects in humans, animals and
aquaculture. It is found as a major constituent of the
phospholipid membrane in the brain and in the rod outer
segment in the retina (up to 60% DHA) (9). DHA has been
shown to improve cognitive performance in healthy adults and
also play an important role in a circulatory system as DHA can
Chodchoey, K. et al. Growth, fatty acid profile fluidity of A. mangrovei
increase flexibility and strength of arterial walls (3). The main
source of DHA is from fish and seafood. In addition, many
researches have been found that a number of microalgae in the
group of thraustochytrids produce a significant amount of
DHA. Cryptheconidium cohnii and the thraustochytrid, Schizochytrium sp., are now commercially applied to DHA production (21). Although, the production of fish oil does not
involve high technologies in the cultivation and oil extraction
like the production of DHA oil from microalgae. However, the
population of fish is reduced and fish could get contaminated
with mercury. Furthermore, the production of fish oil might
affect the balance of marine ecosystems. Thus,
DHA-containing oil from marine microalgae could be a sustainable
source of omega-3 oil. In addition, many studies have shown
that DHA-containing oil from marine microalgae is effective
and probably safer than fish oil in order to meet the demand for
human consumption (3).
Aurantiochytrium (formerly Schizochytrium) mangrovei Sk-02, a thraustochytrid, was isolated from a mangrove forest
in Hong Kong. Previous reports on growth and fatty acid
production of this strain showed that high DHA production (up
to 4.7 g/L or 22.5% of dry cell weight) could be obtained from
a glucose-yeast extract-sea salt medium in shake flask
cultivation (24). Other studies with A. limacinum OUC88 showed the effect of temperature and salinity on the biomass
and total fatty acid production (27). In a more recent study, the
effect of temperature on growth and total fatty acid
composition in Aurantiochytrium sp. strain mh0186 was reported (23). However, there are no reports on the fatty acid
profile of the major lipid changes or the membrane fluidity in
Thraustochytrids as a function of temperature. Therefore, the
objectives of this research were to investigate the effect of
cultivation temperature on growth, cellular fatty acid
composition, fatty acid composition in major lipid classes and
lipid fluidity. The results from this research might be useful
for further optimization of DHA production by this strain in
both triacylglycerol and phospholipid form. Moreover, the
results could add more physiological information in terms of
the lipid characterization and lipid fluidity of A. mangrovei Sk-02 as a function of growth temperature.
MATERIALS AND METHODS
Microorganism and culture conditions
Aurantiochytrium mangrovei Sk-02 (formerly Schizochytrium mangrovei Sk-02) was provided by Prof. Lilian L.P. Vrijmoed and Prof. Gareth Jones (City University of Hong
Kong). The pure culture was maintained on a glucose-yeast
extract-peptone (GYP) agar slant medium containing 10 g/L
glucose, 1 g/L yeast extract, 1 g/L peptone and 15 g/L each of
agar and artificial sea salts (50 % artificial seawater) and
subcultured every month (24). For obtaining 18S rRNA gene
sequence from this strain, a single colony from a GYP agar
plate was transferred to 50 ml tube containing 10 ml of liquid
medium consisting of 1 g/L peptone, 2 g/L yeast extract, 4 g/L
glucose and 15 g/L sea salts. The culture was cultivated at
26°C with 150 rpm for 1 week. Then the cells were harvested
and lyophilized. After that the genomic DNA of the cells was
extracted by using DNeasy Plant Mini Kit (Qiagen,
Germantown, MD, USA). Polymerase chain reaction was done
to amplify 18S rRNA gene in the genomic DNA by using two
primers: 16S1N (forward, 5
-TCCTGCCAGTAGTCATATGC-3 ) and 16S2N (reverse, 5
-TGATCCTCT/CGCAGGTTCAC-3 ) (2-TGATCCTCT/CGCAGGTTCAC-3). The polymerase chain reaction (PCR) mixture
composed of 50 µl 1 × Taq PCR buffer (New England Biolabs,
UK), 0.2 mM dNTP, 0.2 µM of each primer (16S1N and
16S2N), 2.3 U Taq polymerase (New England Biolabs, UK)
and sterile distilled water. The PCR program started from 1
cycle of DNA denaturing at 94°C for 5 min. Then the PCR was
run for 40 cycles of 30 s at 94°C, 30 s at 54°C, 2 min at 72°C
and followed by 1 cycle of final extension at 72°C. The results
of the 18S rRNA gene sequence were aligned and compared to
other microorganisms in GenBank database of the National
BLAST (Basic local alignment search). The neighbor-joining
(NJ) tree was constructed by MEGA4 (22) software and
CLUSTAL W. The bootstrap values were obtained from 1,000
replications of NJ analyses.
An inoculum was prepared by transferring 1 ml of
zoospore suspension in the well from a GYP plate to 250 ml
Erlenmeyer flask containing 50 ml of GYP medium. The
inoculum was incubated at 25°C in an orbital shaker at 200
rpm for 18 – 20 h. Basal medium consisted of 40 g/L glucose,
10 g/L yeast extract (Difco, USA), 0.001 g/L MnCl2 with 15
g/L artificial sea salts (SS) (Sigma, USA)with an initial pH of
6.5. The cultivation was performed in 500 mL baffled flasks
containing 100 ml culture medium. All flasks were inoculated
with 5 mL inoculum and incubated in an orbital shaker at 200
rpm at either 12°C, 15°C, 20°C, 25°C, 30°C or 35°C. Duplicate
cultivation flasks were sampled and the pH was measured and
adjusted to 6.5 by 1 M KOH or 1 M HCl during the cultivation.
Virtually no growth was observed at 10oC, whereas growth at
38oC resulted in a large reduction (ca. 50%) in the biomass
yield, hence these conditions were not included. During
cultivation, one ml samples were taken for assay of the optical
density (at 660 nm, indicated as OD660) or 4 mL for biomass
dry weight after washing with distilled water (24). When
glucose in the culture medium had decreased to approximately
2 to 4 g/L, 40 ml of culture was taken for assay of cell count
and cell size by haemacytometer, maximal biomass, overall
fatty acid profile as well as composition of major lipid classes.
Optical density measurement, biomass determination and residual glucose assay
The culture broth (1 mL) was collected in 2 mL Eppendorf
tubes and centrifuged at 10,000×g for 10 min. The pellet was
washed twice with distilled water. The optical density was
measured by spectrophotometer (Novaspec II, Pharmacia
Biotech, Sweden) at 660 nm. For biomass determination, cell
pellets were collected by centrifugation and washed with
distilled water. The weight of dried biomass was determined
after freeze-drying and expressed as mg/L. The supernatants,
after collecting cell pellets by centrifugation, were used for
glucose measurement by a glucose oxidase kit (Glucose
liquicolor, Human, Germany).
Fluorescence anisotropy measurement
Diphenyl-heaxatriene (DPH, Sigma) and
trimethylammonium-diphenyl-hexatriene (TMA-DPH, Sigma)
were used as probes to measure whole-cell fluorescence
anisotropy of A. mangrovei Sk-02. Briefly, fresh cells were collected from cells cultivated at 15°C and 30°C with 15 g/L
SS at the early fatty acid formation phase. Cells were washed
twice with distilled water. After centrifugation at 10,000×g for
10 min, cells were resuspended in 10 mM phosphate buffered
saline (PBS) to have a final OD660 of approximately 0.1 (ca.1
mg wet weight / mL). The stock solutions of DPH and
TMA-DPH were dissolved in tetrahydrofuran (THF) and dimethyl
sulfoxide (DMSO), respectively (6). A final concentration of 2
µM and 5 µM of DPH and TMA-DPH, respectively were
added to 1 mL cell suspension (final concentrations of THF
and DMSO were less than 0.1%). The same volumes of THF
and DMSO without probe were added to a cell suspension as a
blank control. After a fluorescence probe was added, the cells
were incubated at 15°C, 30°C and 37°C for 20 min. Steady
state fluorescence anisotropy was measured with a
Perkin-Elmer LS 55 luminescence spectrofluorometer connected to a
MP-50 Open Bath Circulator (JULABO). For DPH and
TMA-DPA, the excitation and emission wavelengths were 360 nm
and 450 nm, respectively. The anisotropy (r) was calculated
according to the equation:
r = (I vv – GF × I vh) / (I vv + 2GF × I vh)
where: GF = I hv/ I hh is the grating factor that is an instrumental
correction factor; I is the intensity of fluorescence emitted;
while v or h refer to the vertical and horizontal direction,
Chodchoey, K. et al. Growth, fatty acid profile fluidity of A. mangrovei
lower fluidity.
Lipid classes separation and fatty acid analysis
Lipids from dried cells were extracted by
chloroform-methanol-distilled water (1:2:0.8 v/v/v) described by (2). The
solvents were added to the dried cells in a sequence starting
from chloroform, methanol and distilled water as described by
(15). A mixture of dried cells and solvents was sonicated in a
sonication bath for 15 min, and then the mixtures were
incubated at room temperature for 18 h. Finally, lipids were
separated by adding 1.25 mL chloroform and 1.25 mL of 1 M
NaCl in a mixture. After centrifugation at 1000×g, lipids in the
chloroform phase were taken out and dried with nitrogen gas in
a new vial. Twenty milligram of lipids were separated into
neutral lipid (NL), free fatty acid (FFA), non-acidic
phospholipid (non-aPL) and acidic phospholipid (aPL) by
aminopropyl-bonded phase via a column chromatography
method described by (12). Neutral lipid was first eluted from
the column by adding 16 ml of chloroform-isopropanol (2:1
v/v) and 8 mL of 1% v/v acetic acid in diethyl ether was then
used to separate free fatty acid. Then 16 mL of methanol was
added to the column to elute non-acidic phospholipids
(non-aPL) (phosphatidyl choline; PC and phosphatidyl
ethanolamine; PE). The last fraction was acidic phospholipids
(aPL) (phosphatidyl inositol; PI and phosphatidyl serine; PS),
which was eluted by 8 ml of chloroform-methanol-3N HCl
(100:200:1 v/v/v). The solvent was evaporated in a vacuum
incubator (Gallenkamp, Germany). Dried lipid samples from
every fraction were weighed and resuspended in
chloroform-methanol (2:1 v/v). The purity of each lipid class was checked
by thin layer chromatography (TLC) using silica gel 60 plates.
The solvent used for TLC was hexane-diethyl ether-acetic acid
(70:30:1 v/v/v). The plate was stained with 3 % w/v copper
sulfate in 30% v/v sulfuric acid and heated at 120°C for 15
min.
Lipids extracted from dried cells as well as lipid from
individual lipid classes were methyl esterified in 4% v/v conc.
sulfuric acid in methanol with 0.1% of
2,6-Di-tert-butyl-4-methylphenol (BHT) (24). The internal standard was C19:0.
Fatty acid methyl esters (FAMEs) were injected on a Shimadzu
GC-17A gas chromatography equipped with an Omegawax
250™ (30m 0.25 mm) column (Supelco, USA), an
auto-injector and flame ionization detector. Injector and detector
temperatures were 250°C and 260°C respectively, with helium
as carrier gas at a linear velocity of 30 cm/s. Column
temperature was held at 200°C for 10 min, then increased to
230°C at 10°C /min and kept at this temperature for 14 min.
For routine analysis, peak quantification was performed by
comparison with four dilutions of DHA–FAME (Sigma, USA)
with C19:0-FAME (Sigma, USA) as internal standard.
Retention time of each peak from the sample was compared
with a mixed PUFA-standard (Supelco no. 189-19). The results
of total fatty acid composition in each lipid class were
compared to the results of total fatty acid composition found in
cellular lipids extracted by Bligh and Dyer method.
Statistical analysis
The data was statistically analyzed by using one-way
analysis of variance, and significant differences were identified
by the Duncan and Tukey’s test (P < 0.05). The analysis was done by SPSS Version 17.0 software (SPSS, Chicago, IL,
USA).
RESULTS AND DISCUSSION
Effect of culture temperature on growth
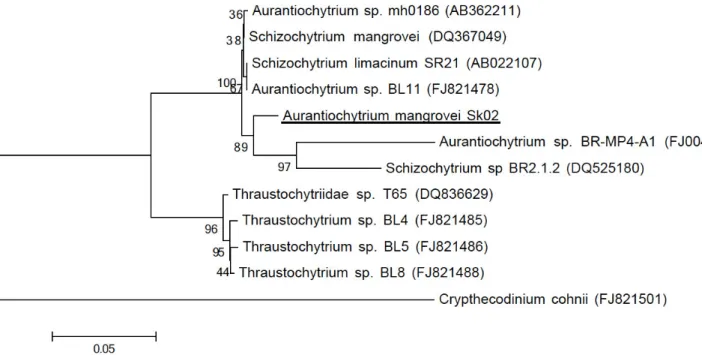
The neighbor-joining (NJ) tree showed the phylogenic
position of Aurantiochytrium mangrovei Sk-02 (JF260953) and its related species based on 18S rRNA gene sequences (Fig. 1).
The morphology and fatty acid profile of this strain suggested
that the genus and specie of this microalga was closely related
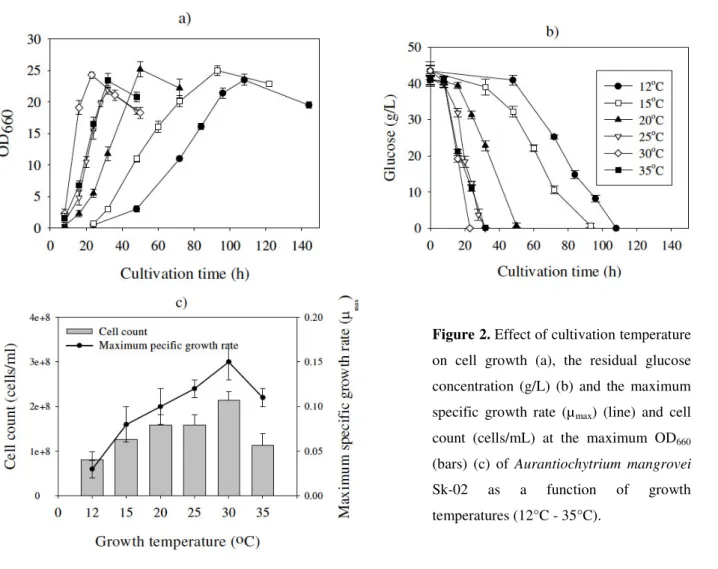
temperatures. Exponential growth was observed up till an
OD660 of ca. 12 and the specific growth rate (µ) was calculated
for all conditions (Fig. 2a). At this point, the cell count
reached a plateau (data not shown). The cells accumulated lipid
until glucose was exhausted in the culture medium with a linear
increase in biomass. At this point, the cells were in the late
lipid accumulation phase and the maximum OD660, the
maximum biomass (mg/L) and the maximum total fatty acid
content (mg/g-dry cell weight (DCW)) were obtained at 108 h,
93 h, 50 h, 28 h, 23 h and 32 h in the cells cultivated at 12 C,
15 C, 20 C, 25 C, 30 C and 35 C, respectively (Fig. 2a and
2b). The maximum specific growth rate and the consumption
rate of glucose in an early growth phase were increased with
the growth temperature except for cells grown at 35°C. The
highest µmax of 0.15 h-1 and the highest cell number of 2.1 × 10⁸
cells/ml were found in the cells grown at 30 C (Fig 2c). In
contrast to the present study, the growth rates of
Aurantiochytrium sp. strain mh0186 were similar even though the temperature was varied from 15 - 30°C and the cultivation
was finished at 96 h for all conditions (23). Thus, the latter
results suggested that conditions used for growing mh0186
were oxygen-limited at all temperatures tested.
The biomass significantly increased from 13.2±0.4 to
14.7±0.5 g/L (p<0.05). Total fatty acid was analyzed by GC and the GC chromatogram of total fatty acid from cells grown
on various growth temperatures was shown in Figure 3. Total
fatty acid (TFA) was significantly increased from 300 to 415
mg/g-DCW with an increase in growth temperature from 12 to
30 C but TFA decreased to 375 mg/g-DCW as the growth
temperature was increased to 35 C (Table 1). The highest total
fatty acid yield of 160 mg TFA/g glucose was found in the
cells grown at 30 C (Table 1). Previously, A. mangrovei Sk-02 was shown to have an optimum temperature for maximal
biomass and DHA-formation at ca. 25 -30°C (24). Another
report of the biomass and total fatty acid content of A. limacinum OUC88 cultivated in the range of 16 - 37°C were reduced significantly (2.6 and 1.6 times, respectively), as the
temperature increased from 30 to 37°C (27). The results from
previous studies agree with the results found in this study
suggesting that A.mangrovei could grow well at a wide range of growth temperatures (12 to 35°C).
Chodchoey, K. et al. Growth, fatty acid profile fluidity of A. mangrovei
Table 1. Fatty acid composition (mg/g-dry cell weight DCW) and the total fatty acid yield (mg/g glucose) of A. mangrovei Sk-02 as a function of
growth temperature. (The data was obtained from direct acid methylation and the percentages of C16:1 and C18:1 were less 1%).
Fatty acid Temperature (°C)
(mg/g DCW) 12 15 20 25 30 35
C14:0 8.8±1.6b 10.1±0.9b 8.4±0.8b 11.1±2.3b 14.3±1.8a 11.3±1.5b
C15:0 34.5±0.3b 37.9±1.2a 33.9±0.9b 30.3±0.4c 20.4±0.4d 22.2±0.3d
C16:0 108.9±9.8e 145.6±10.3d 137.4±7.5d 175.6±9.7c 228.3±5.4a 206.9±8.5b
C18:0 2.0±0.4c 2.2±0.5c 2.2±0.2c 4.0±0.3b 4.9±0.6a 4.2±0.2ab
C20:3n6 3.7±2.1a 4.3±0.3a 2.6±0.1a 2.7±0.8a 3.2±2.1a 3.9±0.2a
C20:5n3 1.5±0.3a 1.1±0.1a 0.5±0.4a 1.1±0.7a 1.1±0.3a 0.8±0.3a
C22:5n6 15.1±1.5d 14.0±0.8d 13.1±0.7d 19.9±0.1c 22.9±0.3b 27.8±0.6a
C22:6n3 125.6±5.2a 107.8±8.8b 105.0±5.6b 107.4±2.5b 119.9±4.6a 97.7±7.7b Saturated 154.2±11.5d 195.8±10.7c 181.9±8.4c 221.0±9.5b 268.0±7.5a 244.6±10.6b Unsaturated 146.0±1.9a 127.3±4.3b 120.7±2.4c 131.1±0.7b 147.0±2.7a 130.2±5.5b TFA (mg/g DCW) 300.2±10.3c 323.1±11.3d 302.6±9.5de 352.1±11.3c 415.0±7.7a 374.9±9.7b TFA (mg/g glucose) 99.0±3.4e 117.9±4.1cd 108.2±3.4de 126.7±4.1c 159.8±2.9a 137.8±3.8b Biomass (g/L) 13.2±0.3b 14.6±0.5ab 14.3±1.1ab 14.4±0.9ab 14.7±0.3a 14.7±0.9a
C22:6n3/C22:5n6 8.3 7.7 8.0 5.4 5.2 3.5
C16:0/C22:6n3 0.9 1.4 1.3 1.6 1.9 2.1
* Alphabetic superscripts within the same row but among the different groups indicate statistical difference (p< 0.05) analyzed by One-way ANOVA using the Tukey and Duncan’s test.
Figure 2. Effect of cultivation temperature on cell growth (a), the residual glucose
concentration (g/L) (b) and the maximum
specific growth rate (µmax) (line) and cell
count (cells/mL) at the maximum OD660
(bars) (c) of Aurantiochytrium mangrovei Sk-02 as a function of growth
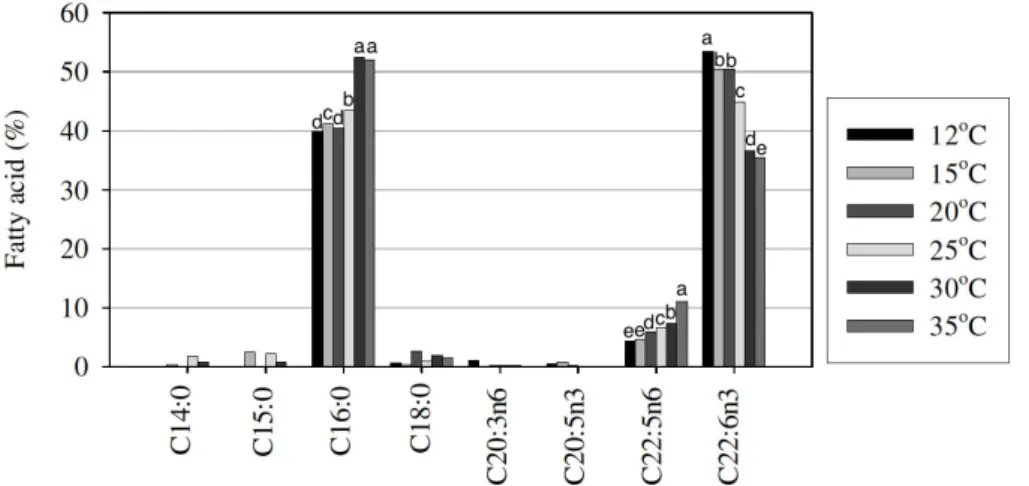
Effect of culture temperature on total fatty acid profile As shown in Table 1 and Figure 3, the major saturated
fatty acid found at all cultivation temperatures was palmitic
acid (C16:0) and the major polyunsaturated fatty acid was
DHA (C22:6n3). However, the ratio of C16:0 (mg/g-DCW) to
C22:6n3 (mg/g-DCW) increased from 0.9 to 2.1 as a growth
temperature increased from 15 to 35°C. In addition, some
minor UFAs like C16:1 and C18:1 were also found but they
were not included in the data, since the sum of them was less
than 1% of total fatty acid (TFA) or 4 mg/g-DCW (data not
shown). An increase in growth temperature was accompanied
by an increase in the percentages of C16:0, stearic acid (C18:0)
and DPA (C22:5n6), except for the condition at 35°C (Table
2). The percentage of total saturated fatty acid (SFA) increased
from 51.4 to 61.3% of TFA with an increase in growth
temperature from 12 to 35°C. In contrast, the percentage of
total unsaturated fatty acid (UFA) was negatively correlated
with an increase in the culture temperature (Table 2). The
percentage of DHA in total fatty acid (TFA) decreased
significantly from 41.8 to 26.1% whereas, C16:0 increased
significantly from 36.3% to 55.2% of TFA with an increase in
the growth temperature from 12 to 35°C, respectively (Table
2). These results were in accordance with previous reports.
For example, in Aurantiochytrium sp. strain mh0186, the amount of UFA and DHA decreased 1.2-times and at
1.3-times, when the temperature increased from 10 to 15°C,
respectively (23). Similarly, in A. limacinum, the amount of DHA decreased from 37.6 to 24.8% of TFA but C16:0
increased from 38.0 to 41.6% of TFA when the cultivation
temperature increased from 16 to 30°C (27).
In order to study, whether growth was oxygen limited,
experiments were conducted in which the initial liquid volume
was varied in 500 mL baffled flasks containing 50 to 250 mL
in 50 mL increments at 30°C. Only at a volume of larger than
150 mL, a decrease in µmax or linear growth was observed (data
not shown). Hence, oxygen was not limited in the conditions
used in this study. Alternatively or additionally, the FA profile
might be a function of the specific growth rate (µ), which was
strongly dependent on the cultivation temperature (Fig 2c).
Hence it can be argued that experiments should be performed
in a chemostat (continuous culture, chemostat) at a fixed
dilution = growth rate. However, experiments with various
oleaginous microbes suggest that in chemostat the biomass
and/or lipid content decreases rapidly with increasing growth
rates in N-limited media as shown for instance with an
oleaginous mould Entomophthora exitalis (13) as well as Schizochytrium sp. GS13/2S (7). In the context of Fig 2c, this would imply that dilution rate would have to be set as low as
0.01 h-1 to avoid wash-out at low cultivation temperatures. It
would be difficult and very time-consuming to get a steady
state under such conditions, hence this was not pursued.
Furthermore, trends in TFA profiles versus cultivation
temperature reported for Aurantiochytrium sp. mh0186 where similar to those reported in the present study (23). However,
for mh0186, growth curves were linear and similar for all
temperatures tested, suggesting that specific growth rate might
not be the major factor determining FA-profiles, although this
cannot be ruled out.
Unfortunately, the actual intermediates of PUFA
production by PKS pathway have not been identified so far.
However, the enzyme reactions in PKS pathway showed that
DPA was not an intermediate for DHA synthesis in the PKS
pathway (16), hence a separate pathway can be postulated. In
our study a clear effect of temperature on the ratio of DHA
(C22:6n3) to DPA (C22:5n6) was observed, for example, the
ratio was 8.3 at 12ºC and 3.5 at 35°C (Table 1). These results
were in agreement with the trend reported for A. limacinum SR21 and Aurantiochytrium sp. strain mh0186, respectively (27, 23). Hence, the regulation of the DPA versus DHA
formation appeared to be quite different and it can be
concluded that DPA was not a precursor for DHA as already
suggested (20). The odd-number fatty acid (pentadecanoic
acid, C15:0) was synthesized from propionyl CoA derived
Chodchoey, K. et al. Growth, fatty acid profile fluidity of A. mangrovei
CoA was then condensed with malonyl CoA by KS, the first
enzyme in the FAS pathway. In this study, C15:0 decreased
from 37.9 to 20.4% with an increase in the cultivation
temperature from 15 to 30°C (Table 2). So, the production of
C15:0 might be dependent on the nitrogen metabolism which
was controlled by the growth rate during nitrogen assimilation
as well as the growth temperature.
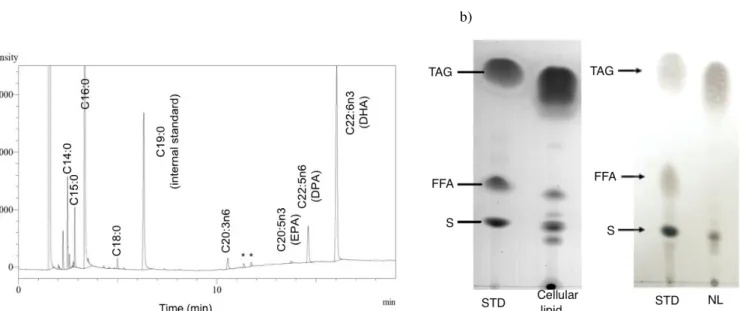
a) b)
Figure 3. GC chromatogram of methyl-esterified fatty acids from glucose grown cells and from lipid class separation (NL, FFA and PL) at various growth temperatures (Star indicates unidentified peak) (a) and TLC of neutral lipid (NL) class (major lipid
class) separated from cellular lipids compared to standard triacylglycerol (TAG), free fatty acid (FFA) and sterol (S) (b).
Table 2. Fatty acid composition (% total fatty acid) of A. mangrovei Sk-02 as a function of growth temperature. (The data was obtained from direct acid methylation and the percentages of C16:1 and C18:1 were less 1%).
Fatty acid Temperature (°C)
(%) 12 15 20 25 30 35
C14:0 2.9±0.3a 3.1±0.2a 2.8±0.3a 3.1±0.6a 3.5±0.2a 3.0±0.2a
C15:0 11.5±0.2a 11.7±0.1a 11.2±0.1b 8.6±0.2c 4.9±0.1e 5.9±0.1d
C16:0 36.3±0.9d 45.1±0.4c 45.4±0.3c 49.9±0.3b 55.0±0.8a 55.2±0.2a
C18:0 0.7±0.1b 0.7±0.0b 0.7±0.1b 1.1±0.2a 1.2±0.1a 1.1±0.1a
C20:3n6 1.2±0.5a 1.3±0.5a 0.9±0.1a 0.8±0.4a 0.8±0.4a 1.0±0.1a
C20:5n3 0.5±0.1a 0.3±0.0a 0±0.0a 0.3±0.3a 0.2±0.1a 0.2±0.2a
C22:5n6 5.0±0.2c 4.3±0.1d 4.3±0.4d 5.7±0.1b 5.5±0.2b 7.4±0.3a
C22:6n3 41.8±1.8a 33.4±0.2b 34.7±0.1b 30.5±0.1c 28.9±1.8c 26.1±0.1d
Saturated 51.4±1.1d 60.6±0.3c 60.1±0.2c 62.8±0.3b 64.6±1.2a 65.3±0.1a
Unsaturated 48.6±0.9a 39.4±0.2b 39.9±0.2b 37.2±0.3c 35.4±0.8d 34.7±0.2d
UI* 2.8 2.3 2.3 2.2 2.0 2.0
* Unsaturation index (UI) = (1.0(%monoene)) + (2.0(%diene)) + (3.0(%triene)) + (4.0(%tetraene)) + (5.0(%pentaene) + (6.0(%hexaene))/100
Fatty acid composition of major lipid classes
The major lipid classes of A. mangrovei Sk-02 grown at various temperatures in the late lipid accumulation phase were separated. The results of fatty acid composition in lipid extracted
from the cells by Bligh and Dyer method before lipid class separation were compared to the result of fatty acid composition in
each lipid class after lipid classes were separated by column
chromatography. The results of the sum of fatty acid composition in all classes after lipid class separation were similar to the result
found in total lipid extracted before lipid class separation. Moreover, the results of GC analysis of cells by direct methylation
method were similar to the results of fatty acid composition of lipid extracted from the Bligh and Dyer method followed by acid
methylation for GC analysis (Fig. 3a). The data from this study
showed that cells stored lipid predominantly in the form of neutral
lipid (NL) (> 75% of total cellular lipid). NL was composed of
triacylglycerol (TAG), diacylglycerol (DAG), monoacylglycerol (MAG), sterol ester (SE) and sterol (S) as shown by TLC of NL
from cells grown at various temperatures (Fig .3b). In addition, FFA and PL were also visible on TLC (Fig. 3b). In order to
exclude the possibility that FFA arose from lipase activity during
handling, fresh cells were heated at 70°C for 15 min which abolished intracellular lipase as assayed in cell-free extracts by
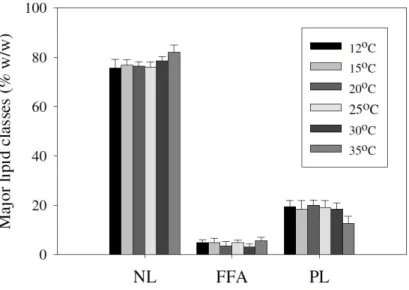
pNPP measurement (data not shown) but gave identical TLC patterns as non-heated cells. FFA accounted for 3 – 5% of the
total cellular lipid weight and total PL was approximately 18% of total cellular lipid. The data was independent of the cultivation
temperature (Fig. 4).
Figure 5 shows the influence of growth temperature on the
fatty acid composition in NL. Similar to the results of fatty
acid composition from overall cellular fatty acid profile, C16:0
slightly increased with an increase in the growth temperature
from 12 to 25°C and remained constant from 30 to 35°C. In
contrast, C15:0 and DHA decreased from 13.6 to 6.7% of TFA
and 40.7 to 24.9% of TFA in NL, respectively when the growth
temperature increased from 12 to 35°C (Fig. 5). In
phospholipids, the percentage of DHA decreased significantly
from 53.5 to 35.5% of TFA in total PL whereas C16:0
increased markedly from 39.9% to 52.0% of TFA in PL as the
growth temperature increased from 12 to 35°C (Fig. 6). The
major fatty acid composition in NL and PL as a function of
temperature were basically similar but the percentage of DHA
in total fatty acid of total PL was higher as compared to that in
NL (Fig. 5 and Fig. 6). For C20 PUFAs (C20:3n6 and Figure 4. The weight percentage (+/- S.D.) of individual major lipid classes from A. mangrovei Sk-02 as a function of growth temperature (12 -
35°C). NL = neutral lipid, FFA = free fatty acid and
Chodchoey, K. et al. Growth, fatty acid profile fluidity of A. mangrovei
C20:5n3), a similar decrease with increasing growth temperature
would be expected but due to the low absolute levels of these two
PUFAs a significant trend could not be established (Fig. 5 and Fig. 6). Phospholipids from cells grown at 15°C and 30°C were chosen
as examples of cells grown at low and high growth temperature for the separation of non-acidic phospholipid (non-aPL) and acidic
phospholipid (aPL). Previous research has shown that the
predominant PL in A. mangrovei consisted of PC and PE (5). In Sk-02, 60 - 70% of total PL consisted of non-acidic PL under all
growth conditions (data not shown). In phospholipids, DHA in
non-aPL was much higher than in aPL in which C16:0 was the
main fatty acid. DHA (%) in non-aPL also decreased from 68.5 to
48.5% of TFA with an increase in the growth temperature from 15 to 30°C (Fig. 7). These results were in agreement with the results
found in A. mangrovei FB3 grown at 25°C as non-aPL in this microalgae made up of ca. 60% of PL (5). Moreover, the
percentage of DHA in total PC (a non-aPL) of the
thraustochytrid-like strain 12B was approximately 54%, while only 20% of total PL was found in PI (an acidic phospholipid) in cells cultivated at
30°C (18).
Figure 5. Fatty acid composition in neutral lipid of cells grown at different growth temperature (S.D.< 1.0). Alphabets above each bar graph indicate a significant difference (p<0.05).
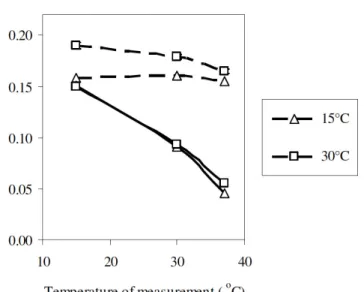
Lipid fluidity measurement
Fresh cells cultivated at 15°C and 30°C until the late lipid
accumulation stage were chosen as examples of cells grown at
low and high growth temperature, respectively. In order to
study the lipid fluidity of the cells grown at two different
temperatures, the temperatures for fluidity measurement were
set at 15°C, 30°C and 37°C. The common used probes -DPH
and TMA-DPH- had different in the polarities. DPH had no
head group whereas TMA-DPH was a cationic derivative of
DPH molecule, which can anchor at the surface region of the
plasma membrane (4). As the temperature for measurements
increased, the lipid fluidity measured with DPH from both
conditions increased significantly (p<0.05) (Fig. 8). For TMA-DPH, the anisotropy value was only slightly affected by the
temperature of measurement. Cells cultivated at 30°C had less
fluidity as compared to cells cultivated at 15°C when measured
at 15°C by TMA-DPH probe. Thus, this study showed that A. mangrovei Sk-02 can maintain a constant plasma membrane fluidity at a wide range of the environmental temperatures. In
contrast, lipid fluidity in the intracellular lipid as well as the
intracellular membrane was highly affected by the growth
temperature as indicated by significant changes in anisotropy
value of DPH as a function of growth temperature. These
results were in agreement with a study on the effect of
temperature on crab plasma membrane fluidity measured by
DPH and TMA-DPH as the temperature of measurement
increased from 5 to 35°C (4).
Highly unsaturated fatty acids such as DHA and DPA can
induce a change in the lipid bilayer structure as their kinked
molecules might loosen the packed structure of the membrane
lipid bilayer However, the properties and functions of DHA in
terms of increasing membrane fluidity in Thraustochytrids still
remain unclear (11)as a very high fluidity of membrane itself
might not be necessary for microorganisms living in such
shallow waters and moderate water pressure as present in
mangrove forests where Aurantiochytrium sp. are commonly isolated. In addition, not only DHA and DPA as found in
Aurantiochytrium sp. but also monounsaturated fatty acids like C18:1 could also increase the fluidity of the plasma membrane.
This was clearly shown in the deep sea bacterium
Photobacterium profundum SS9 from which the PKS gene cluster for EPA-production was deleted and oleic acid
(C18:1n9) added to the medium. This allowed good growth at
either low temperature or high pressure, suggesting that highly
unsaturated fatty acids were not essential for the cells to
survive in extreme conditions (1). Hence, the function of
DHA/DPA in thraustochytrids remains unclear.
Figure 7. Fatty acid composition of non-acidic phospholipid (non-aPL) and acidic phospholipid
Chodchoey, K. et al. Growth, fatty acid profile fluidity of A. mangrovei
Implications for commercial production of DHA from Aurantiochytrium mangrovei
From this study, the growth temperature for the industrial
scale production of DHA by A. mangrovei was in the range of 25 to 30°C. However, the temperature for producing
DHA-rich cells (ca. 34.2% to 43.8% of TFA) could be in the range of
12 to 20°C. But the cost for cooling the reactor down to a very
low temperature was high and the time to finish the cultivation
was longer as compared to that at high temperature (25 to
35°C). Therefore, it might be not worth for the large scale
production to cultivate the microorganism at low temperature
and effort should rather be focused on screening for a strain
with a high DHA/DPA content. For example, DHA of strain
G13/2S was 43% of TFA in batch fermentation at 27°C (7).
The forms of lipid containing in A. mangrovei were mainly NL, FFA and PL. The percentage of DHA (68.5% or 65 mol% of
TFA) in non-aPL at 15°C (Fig. 7) showed that it might be
possible to have PC with DHA at both sn-1 and sn-2 position as one molecule of phospholipid is composed of 2 moles of
free fatty acids. Therefore, PL in particularly DHA-containing
non-aPL, especially PC in both the residual oil after TAG
purification and the cell debris could be an interesting
by-product to add more value to large scale by-production of DHA
from Aurantiochytrium sp. It has been suggested that DHA-containing phospholipids are a better form of DHA as they are
two times more bioavailable in the brain than in triacylglycerol
or ethyl esters forms (14). Moreover, a report on the
development of fish larvae by feeding DHA in the form of
TAG and PL showed that DHA-containing PL was more
effective than TAG-containing DHA (8).
CONCLUSIONS
This study was carried out to show the growth, total fatty
acid profile, the distribution of DHA in major lipid classes and
lipid fluidity of the plasma membrane of A. mangrovei Sk-02 as a function of growth temperature. Cells could grow well
over wide range of temperature (12 to 35°C). Moreover, the
production of PUFA/TFA was inversely related to the growth
temperature with similar trends were also found in NL and PL
classes. In addition, cells could maintain their plasma
membrane fluidity in a wide range of growth temperature, and
only the intracellular lipid and organelle membrane were
affected by the growth temperature. Furthermore, the results in
terms of growth and lipid characterization as a function of
temperature could imply for the commercial production of Figure 8. The temperature dependence of
fluorescence anisotropy measured by DPH
(solid lines) and TMA-DPH (broken lines)
of cells cultivated at 15°C and 30°C (S.D. <
DHA from A. mangrovei. Thus, A. mangrovei could be one of the potential candidates for DHA production in the form of
dried cells and extracted oil for animal feed and human
consumption in both triacylglycerol form and especially,
phospholipid form as PC (non-aPL).
ACKNOWLEDGEMENTS
This research work was partially supported by a RA
scholarship from the Faculty of Graduate Studies, Mahidol
University. The authors are grateful to Asst. Prof. Noppawan
Phumala Morales for her kind support with anisotropy
measurements and Dr. Thipa Asvarak for her kind support with
18S rRNA technique.
REFERENCES
1. Allen, E.E.; Facciotti, D.; Bartlett, D.H. (1999) Monounsaturated but not polyunsaturated fatty acids are required for growth of the deep-sea bacterium Photobacterium profundum SS9 at high pressure and low temperature. Appl Environ Microbiol 65:1710 – 1720.
2. Bligh, E.G.; Dyer, W.J. (1959) A rapid method of total lipid extraction and purification. Can J Biochem Physiol 37:911-917.
3. Cannon, D. (2009) From fish oil to microalgae oil : A win-win shift for humans and our habitat. Explore 5:299-303.
4. Cuculescu, M.; Hyde, D.; Bowler, K. (1995) Temperature acclimation of marine crabs : changes in plasma membrane fluidity and lipid composition. J Therm Biol 20:207 – 222.
5. Fan, K.W.; Jiang, Y.; Faan, Y.W.; Chen, F. (2007). Lipid characterization of mangrove Thraustochytrid -Schizochytrium
mangrovei. J Agric Food Chem 55: 2906-2910.
6. Folmer, V.; Pedroso, N.; Matias, A.C.; Lopez, S.C.D.N. et al (2008) H2O2 induces rapid biophysical and permeability changes in the plasma
membrane of Sacchromyces cerevisiae. BBA-Biomembranes 1778:1141 – 1147.
7. Ganuza, E.; Izquierdo, M.S. (2007) Lipid accumulation in
Schizochytrium G13/2S produced in continuous culture. Appl Microbiol
Biotechnol 76:985 – 990.
8. Gisbert, E.; Villeneuve, L.; Zambonino-Infante, J.; Quazuguel, P. et al (2005) Dietary phospholipids are more efficient than neutral lipids for long-chain polyunsaturated fatty acid supply in European sea bass
Dicentrarchus labrax larval development. Lipids 40:609-618.
9. Giusto, N.M.; Pasquare, S.J.; Salvador, P.I.; Roque, M.G. (2000) Lipid metabolism in vertebrate retinal rod outer segments. Prog Lipid Res 39:315 – 391.
10. Jacobsen, A.N.; Aasen, I.M.; Josefsen, K.D.; Strom, A.R. (2008) Accumulation of docosahexaenoic acid-rich lipid in thraustochytrid Aurantiochytrium sp. strain T66 : effects of N and P starvation and O2
limitation. Appl Microbiol Biotechnol 80:297 – 306.
11. Jain, R.; Raghukumar, S.; Sambaiah, K.; Kumon, Y. et al (2007) Docosahexaenoic acid accumulation in thraustochytrids: search for the rationale. Mar Biol 151:1657-1664.
12. Kaluzny, M.A.; Duncan, L.A.; Merritt, M.V.; Eppse, D.E. (1985) Rapid separation of lipid classes in high yield and purity using bonded phase columns. J Lipid Res 26:135 – 140.
13. Kendrick, A.; Ratledge, C. (1992) Lipid formation in the oleaginous mould Entomophthora exitalis grown in continuous culture: effects of growth rate, temperature and dissolved oxygen tension on polyunsaturated fatty acids. Appl Microbiol Biotechnol 37:18-22. 14. Kidd, P.M. (2007) Omega-3 DHA and EPA for cognition behavior and
mood : clinical findings and structural functional synergies with cell membrane phospholipids. Altern Med Rev 12:207 – 227.
15. Lewis, T.E.; Nichols, P.D.; McMeekin, T.A. (2000) Evaluation of extraction methods for recovery of fatty acids from lipid producing microheterotrophs. J Microbiol Methods 43:107 – 116.
16. Metz, J.G.; Roessler, P.; Facciotti, D.; Levering C. et al (2001) Production of polyunsaturated fatty acids by Polyketide synthases in both prokaryotes and eukaryotes. Science 293: 290-293.
17. Moore, S.A.; Hurt, E.; Yoder, E.; Sprecher, H. (1995) Docosahexaenoic synthesis in human skin fibroblasts involves peroxisomal retroconversion of tetracosahexaenoic acid. J Lipid Res 36:2433-2443.
18. Okuyama, H.; Orikasa, Y.; Nishida, T. (2007) In vivo conversion of triacylglycerol to docosahexaenoic acid-containing phospholipids in a thraustochytrid-like microorganism, strain 12B. Biotechnol Lett 29:1977 – 1981.
19. Qui, X. (2003) Biosynthesis of docosahexaenoic acid (DHA, 22:6-4, 7, 10, 13, 16, 19): two distinct pathways. Prostaglandins Leukot Essent
Fatty Acids 68:181-186.
20. Ratledge, C. (2004) Fatty acid biosynthesis in microorganisms being used for single cell oil production. Biochemie 86:807-815.
21. Sijtsma, L.; Swaaf, M.E. (2004) Biotechnological production and applications of the omega-3 polyunsaturated fatty acid docosahexaenoic acid. Appl Microbiol Biotechnol 64:146-153.
22. Tamura, K.; Dudley, J.; Nei, M.; Kumar, S. (2007) MEGA4: molecular evolutionary genetics analysis (MEGA) software version 4.0. Mol Biol Evol 24:1596 – 1599.
Chodchoey, K. et al. Growth, fatty acid profile fluidity of A. mangrovei
composition of Aurantiochytrium sp. Strain mh0186. Mar Biotechnol 11:368-374.
24. Unagul, P.; Assantachai, C.; Phadungruengluij, S.; Suphantharika, M. et al (2005) Properties of the docosahexaenoic acid-producer
Schzochytrium mangrovei Sk-02 : effect of glucose, temperature and
salinity and their interaction. Botanica Marina 48:387 – 394.
25. Yang, H.L.; Lu, C.K.; Chen, S.F.; Chen, Y.M. et al (2010) Isolation and characterization of Taiwanese heterotrophic microalgae : screening of strains for docosahexaenoic acid (DHA) production. Mar Biotechnol 12: 173 – 185.
26. Yokoyama, R.; Honda, D. (2007) Taxonomic rearrangement of the genus
Schizochytrium sensu lato based on morphology, chemotaxonomical
characteristics and 18S rRNA gene phylogeny (Thraustochytriaceae, Labyrinthulomycetes, stramenopiles): emendation for Schizochytrium and erection of Aurantiochytrium and Oblongichytrium gen. nov.
Mycoscience 48: 199-211.
27. Zhu, L.; Zhang, X.; Ji, L.; Song, X. et al (2007) Changes of lipid content and fatty acid composition of Schizochytrium limacinum in response to different temperatures and salinities. Process Biochem 42:210-214.