Genetic and morphometric differences between yellowtail snapper
(
Ocyurus chrysurus
, Lutjanidae) populations of the tropical West Atlantic
Anderson V. Vasconcellos
1, Paulo Vianna
2, Paulo C. Paiva
3, Renata Schama
1and Antonio Solé-Cava
11
Universidade Federal do Rio de Janeiro, Instituto de Biologia, Departamento de Genética,
Laboratório de Biodiversidade Molecular, Rio de Janeiro, RJ, Brazil.
2
Projeto TAMAR, Praia do Forte, Rio Vermelho, Salvador, BA, Brazil.
3
Universidade Federal do Rio de Janeiro, Instituto de Biologia, Departamento de Zoologia,
Laboratório de Polychaeta, Rio de Janeiro, RJ, Brazil.
Abstract
Populations ofOcyurus chrysurus were compared genetically and morphometrically along the West Atlantic coast to test the null hypothesis of population homogeneity in the area. Brazilian populations were found to be differentiated in shape (canonical variates analysis; F[48,515]= 10.84, p < 0.0001). Analyses of mitochondrial DNA sequences (663 bp of the control region) did not show any differences between Brazilian populations but could detect differences between Brazilian and Caribbean (Belize) populations. The samples from Pernambuco differed significantly from the other Brazilian populations in allozyme frequencies (11 loci; FST= 0.167; p < 0.05), but this may have resulted from the small number of samples analysed for that population. Sequence variation of Belize samples departed from neutral expectations (Fu’s FS = -8.88; p < 0.001). A mismatch distribution analysis points to an ancient population expansion in that area. We conclude that the genetic data do not allow the rejection of the null hypothesis of panmixia for Brazil-ian yellowtail snapper populations which should be treated as a single genetic stock, with a latitudinal gradient on their morphology which probably results from phenotypic plasticity. On the other hand, there is a severe restriction to gene flow betweenO. chrysurus populations from the Caribbean and from the southwestern Atlantic.
Key words:mtDNA, allozymes, morphometry, fisheries, phylogeography.
Received: November 27, 2006; Accepted: October 7, 2007.
Introduction
The yellowtail snapper Ocyurus chrysurus (Bloch, 1791) is a Lutjanid reef fish found on the east coast of the Americas from New England (USA) to southeastern Brazil (Menezes and Figueiredo, 1980; Allen, 1985). It is dioe-cious and its spawning times vary between geographic re-gions (Thompson and Munro, 1983; Claro, 1983; Grimes, 1987).O. chrysurushas opportunist and generalist alimen-tary habits and, hence, it is an important predator in some reef zones (Fallows, 1984; Parrish, 1987). They are long-lived (up to 17 years Allmanet al., 2005) and their larvae are pelagic (Rileyet al., 1995).
Yellowtail snappers are important fisheries resource where they occur. The production of the species in North-east Brazil is high (Costaet al., 2003) by 2001 averaging 1683 tons.year-1(Resendeet al., 2003). In Southeast Brazil
yellowtail snappers accounted for 16% of the total fish bio-mass captured between 1986-1989 (Paiva and Andrade-Tubino, 1998). The formation of spawning aggregations in this species (Claro, 1983) makes it particularly vulnerable to overfishing (Costaet al., 2003), so that it is important that the stock structure of this species be known in order to better preserve it. This is also important because of the re-ported post-recruitment site fidelity of this species (Watson
et al., 2002) which might lead to large stock differentiation and fragility.
In recent years there has been a worldwide decrease in fishing stocks (Garcia and Grainger, 2005; Paulyet al., 2005): the overexploited, fully exploited and exhausted fisheries that were 69% in 1995 increased to 75% in 2002 and only 1% of the stocks are in a state of recuperation (FAO, 2002; Ormerod, 2003). Similar problems are faced by the Brazilian fisheries stocks (Vasconcellos and Gasalla, 2001). For this reason efficient management policies based on unambiguous scientific data are necessary both to pro-tect the fishing stocks and to maximize their exploitation without compromising their integrity. The correct stock
as-Send correspondence to Antonio M. Solé-Cava. Laboratório de Biodiversidade Molecular, Departamento de Genética, Instituto de Biologia, Universidade Federal do Rio de Janeiro, Avenida Pau Brasil 211, Ilha do Fundão, 21941-590 Rio de Janeiro, RJ, Brazil. E-mail: [email protected].
sessment and identification of the species is fundamental to establish the maximum sustainable effort of a given marine resource (Ryman and Utter, 1987; Ryman, 1991). Many stock concepts can be found in the literature (Booke, 1981; Ovenden, 1990; Smithet al., 1990; Carvalho and Hauser, 1995), but one of the most accepted and used is that “a stock is an intraspecific group of randomly mating individuals with temporal and spatial integrity” (Ihssenet al., 1981) which covers most of the definitions given by other authors. The identification of fish stocks can be made effi-ciently by the use of highly polymorphic molecular markers (Blaberet al., 2005; Caddy and Seijo, 2005; Carmen and Ablan, 2006). In this study nuclear (allozymes) and mito-chondrial (control region sequences) markers are used for the first time to analyse the stock structure of populations of
O. chrysurusalong 2380 km of Brazilian coast. A significant latitudinal gradient was observed for geometric morpho-metric data. The lack of observable heterogeneity in allozymes or in the highly variable mitochondrial DNA se-quences indicates that this variation results from phenotypic plasticity. Additionally, samples from the Caribbean dif-fered genetically from the Brazilian ones indicating restric-tion in gene flow between the two areas for this fish species.
Material and Methods
Sampling
Specimens ofOcyurus chrysuruswere collected be-tween August and October 2001 by fishing vessels from four locations along the Brazilian coast (Table 1; Figure 1). Samples of muscle and liver tissues from each fish were transported frozen to the laboratory where they were stored in liquid nitrogen until analyses. Muscle samples fromO. chrysurus were also collected in Belize (17° 29' 34" N, 88° 06' 00" W; N = 20) and transported in 90% ethanol to the laboratory where they were used in DNA sequencing.
Morphometric analyses
Morphometric variation among populations was as-sessed through geometric methods (Zelditchet al., 2004). For this purpose all 192 individuals collected at the four lo-calities were measured. Measurements were taken with a Vernier manual calliper (0.05 mm of precision) between 10 homologous landmarks using a truss network protocol (Strauss and Bookstein, 1982) which provided 21 inter-landmark distances (Figure 2).
To retain the relative geometry of landmarks, inter-landmark distances were converted to Cartesian inter-landmark coordinates for each specimen using the import truss fea-ture of the Morpheus program (Slice, 1998). Landmark co-ordinates were then adjusted by the generalized least squares Proscrustes superimposition (GLS) method (Rohlf and Slice, 1990), centering all specimens, and scaling them to an equal centroid size. The GLS-adjusted landmark
coor-Figure 1- Collection localities ofOcyurus chrysurus.
Figure 2- Outline ofOcyurus chrysurusshowing the 10 landmarks and the truss network of measured distances.
Table 1- Sampling localities and number of specimens used for each analysis.
Locality Latitude Longitude Morphometry Allozymes mtDNA
CE - Ceará 3° 43' 02" S 38° 32' 34" W 57 45 17
PE - Pernambuco 8° 45' 35" S 35° 06' 17" W 17 5 12
BA - Bahia 13° 22' 13" S 39° 04' 23" W 60 55 12
dinates were used for thin-plate spline (TPS) analysis (Bookstein, 1989) which provided shape parameters for subsequent multivariate analyses. Both uniform and non-uniform (= partial warps) components of shape were sub-mitted to a canonical variate analysis (CVA) in order to as-sess shape variation among populations (Cavalcantiet al., 1999; Zelditchet al., 2004). The PAST program (Hammer
et al., 2001) was used for thin-plate spline analysis and par-tial warps computations. Multivariate statistical analysis (CVA) was performed with SYSTAT® package, v. 10.
Allozyme electrophoresis
Muscle and liver samples were tested for thirty allo-zymes and three buffer systems, using 12.5% starch gel electrophoresis. Based on preliminary results, liver tissue and twelve allozyme systems were chosen for the analyses (Table 2).
Gel slices were stained following standard conditions (Manchenko, 1994; Batista and Solé-Cava, 2005; Limaet al., 2005). Samples that could not be reliably scored for at least half of the allozyme loci were excluded from the anal-yses. This was the case for most samples from Pernambuco, leading to a severe reduction in allozymes sample size for that locality. Allozyme genotypes were used to estimate al-lele frequencies, from which heterozygosity levels and in-breeding indices (Global and pairwise FST) were calculated,
using the Genetix 4.01 program (Belkhiret al., 2002). An exploratory factorial correspondence analysis (Excoffieret al., 1992) was also used, to check for hidden partitions in the allelic hyperspace.
DNA extraction
Total genomic DNA was extracted from muscle tis-sues of 77 individuals, using a CTAB extraction protocol (CTAB 2%, EDTA 20 mM, 2-mercaptoethanol 0.2% v/v,
NaCl 1.4 M, Proteinase K 30 micrograms in 500µL of Tris 100 mM). The extracted DNA was precipitated with etha-nol and 3 M sodium acetate, re-suspended in 20 µL of ultrapure water, and stored at -20 °C.
PCR amplification and sequencing
The PCR reactions of the control-region of mitochon-drial DNA (D-loop) were done using the external primers THR (5’AGCTCAGCGCCAGAGCGCCGGTCTTGTA AA3’) (Leeet al., 1995) and 12S (5’ATAGTGGGGTAT CTAATCCCAGTT3’) (Palumbiet al., 1991). PCR reac-tions were set up using 1 unit of Taq polymerase, 0.2 mM of each dNTP, 0.5µM of each primer, 1.5 mM of MgCl2,
30µg of BSA (bovine serum albumin) and 1µL of DNA (approx. 50 ng) as a template, in a final volume of 30µL of PCR buffer (Promega). Thermocycling conditions were: one initial cycle of 5 min at 94 °C, followed by 35 cycles of 1 min each at 94 °C, 48 °C and 72 °C, and one final exten-sion step of 5 min at 72 °C. Negative controls (without DNA template) were used in all PCR reactions to check for contamination. PCR products were purified, and both strands were sequenced in an ABI 3730 XL automatic se-quencer, using the internal PRO (5’CCCAAAGCTAAAA TTCTAA3’) (Kocheret al., 1989) and PHE (5’GCTTTAG TTAAGCTACG3’) (Hedgecock and Strong, 1994) prim-ers. The different haplotypes obtained were deposited in GenBank under accession numbers DQ666423-DQ666447 and EF624354-EF624386.
Sequence analyses
Sequences were edited using the SeqmanTM II pro-gram (DNAstar Inc.) and aligned using ClustalW (Thomp-sonet al., 1994). For phylogeographic nested clade analysis (NCA), a haplotype network was generated using the TCS 1.21 program (Clementet al., 2000) using the 95%
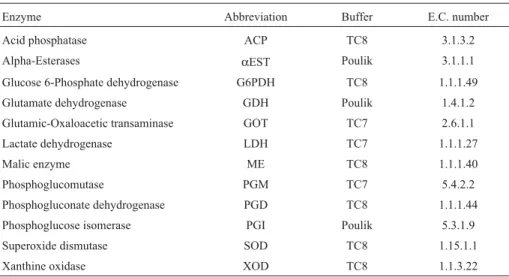
parsi-Table 2- Enzyme systems used in allozyme electrophoresis; buffer systems: TC8 = 0.25 M Tris, 0.06 M citrate, pH 8.0 (Ward and Beardmore, 1977); TC7 = 0.135 M Tris, 0.043 M citrate, pH 7.0 (Shaw and Prasad, 1970); Poulik = 0.03 M Tris, 0.005 M citrate, pH 8.5 (gel), 0.06 M LiOH, 0.30 Borate, pH 8.1 (buffer tank) (Poulik, 1957). E.C.: Enzyme Commission numbers.
Enzyme Abbreviation Buffer E.C. number
Acid phosphatase ACP TC8 3.1.3.2
Alpha-Esterases αEST Poulik 3.1.1.1
Glucose 6-Phosphate dehydrogenase G6PDH TC8 1.1.1.49
Glutamate dehydrogenase GDH Poulik 1.4.1.2
Glutamic-Oxaloacetic transaminase GOT TC7 2.6.1.1
Lactate dehydrogenase LDH TC7 1.1.1.27
Malic enzyme ME TC8 1.1.1.40
Phosphoglucomutase PGM TC7 5.4.2.2
Phosphogluconate dehydrogenase PGD TC8 1.1.1.44
Phosphoglucose isomerase PGI Poulik 5.3.1.9
Superoxide dismutase SOD TC8 1.15.1.1
mony criterion (Templeton, 1998). Clades were nested from haplotypes (0-step) to the highest level, each sepa-rated by one substitution step (Templeton et al., 1995; Templeton, 1998), and the statistical significance of each group was assessed, jointly with geographical coordinates for each sample, using the program GeoDis 2.2 (Posadaet al., 2000). Selective neutrality of the control region se-quences was tested with Tajima’s (Tajima, 1996) and Fu’s (Fu and Li, 1993) tests. Exact tests of population differenti-ation (Raymond and Rousset, 1995) were performed with 1,000 dememorisation steps and 10,000 Markov Chain steps. Selective neutrality tests, mismatch distribution anal-yses (Rogers and Harpending, 1992), Analanal-yses of Molecu-lar Variance (AMOVA; Excoffieret al., 1992) and exact tests of population differentiation were done using the Arlequin 3.0 program (Excoffieret al., 2005). Haplotype and nucleotide diversity indices were estimated using the DNAsp 4 program (Rozaset al., 2003).
Results
Morphometry
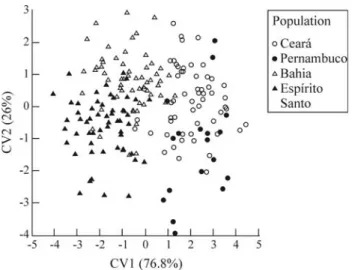
Morphometric variation among populations was vi-sualized via scatter plot of the scores of the first two canoni-cal variables of the CVA applied to the shape variables of the TPS analysis (Figure 3). The first variable accounted for 76.8% of the among-population relative to within-lation variation and discriminated the southern-most popu-lations (Espírito Santo, Bahia) from the northern ones (Per-nambuco, Ceará). A geographical gradient was also observed when considering the intermediate position of the Bahia specimens between Espírito Santo and the northern populations. The second variable accounted for only 26% of total variation, being related to differences between Ceará and Pernambuco and, to a lesser extent, between Bahia and Espírito Santo. Results of CVA indicated signifi-cantly among-populations differences (Wilks lambda = 0.1255; F[48,515]= 10.84; p < 0.0001). Percentage of
individ-uals correctly classified to the four original populations ranged from 80% (Bahia) to 84% (Ceará and Espírito San-to).
Allozyme electrophoresis
Elevenlociwere scored for all samples. Another four loci were scored for all populations except that of Pernam-buco (Table 3). Observed heterozygosities (average Hardy-Weinberg expected heterozygosity, He = 0.1917; Table 3) were high (Smith and Fujio, 1982; Wardet al., 1994). Overall, the populations were found to be geneti-cally structured (FST = 0.0277; 95% confidence interval
(bootstrapping over loci) = 0.00078-0.05648; standard er-ror (jacknifing across loci) = 0.0195 reject the null hypothe-sis of population homogeneity). However, this resulted, mostly, from the large gene frequency differences found in two loci (G6PD-2 and GOT, Table 3) of the population
from Pernambuco, which was the only one significantly different from the others (Table 4). When the samples from Pernambuco were excluded from the analyses, the FST
be-came non-significant (FST= 0.0098; p > 0.30). The factorial
correspondence analysis of unclassified samples showed a wide non-significant scatter of the data with only 27.1% of the total inertia explained by the first two factors (Figure 4). When the gravity centroids of each of the four sampling sites were compared, the two first factors accounted for 84.9% of the total inertia, showing significant differentia-tion between Pernambuco and the other sites.
Sequence variation
From the 663 base pairs of the control region of mito-chondrial DNA sequenced, 105 were polymorphic, produc-ing 58 haplotypes in the 77 individuals analysed. Genetic variation over all sampling sites was high (haplotype diver-sity, h = 0.9614; nucleotide diverdiver-sity, π = 0.0185). The highest levels of variation were observed in Belize (h = 1.000;π= 0.02378). The null hypothesis of selective neutrality was not rejected for the studied sequences (Taji-ma’s D test; p > 0.05; Fu’s Fs test; p > 0.05) from most sam-pling sites. An exception was the Belize population, where D was not significantly different from zero, but Fu’s Fs was significantly negative (Fs = -8.88; p < 0.001). A negative Fs results from an excess of rare alleles (as can be observed in the haplotype network in Figure 5), and it is usually inter-preted as an indication of population expansion (Harpen-ding, 1994). Hence, a mismatch distribution analysis (Rogers and Harpending, 1992) was performed on that pop-ulation (Figure 6), and the observed distribution did not de-viate significantly from the null hypothesis of population expansion (SSD = 0.004; p > 0.95). The Harpending’s Rag-gedness index was low (r = 0.010), indicating a smooth dis-tribution, also consistent with the hypothesis of population expansion (Harpending, 1994).
Levels of population differentiation, as indicated by pairwise FSTvalues, were significant only between the
pop-ulation from Belize and the others (Tables 4 and 5). No dif-ferentiation was observed among populations from Brazil with the exact tests of population differentiation (Markov chain test; exact P value = 0.72255±0.02941). This was confirmed by AMOVA, where none of the ΦST values
among Brazilian populations was significant, and less than 7% of the total variance was explained by differences be-tween geographical locations (Table 6). The nested clade analysis did not reveal significant (p > 0.05 after Bonferroni correction) groupings at any hierarchical level. Seven ha-plotypes, five of which from Belize, were excluded from the nested-clade analysis because they did not meet the 95% confidence level on the TCS haplotype network. This
was caused by the very large divergence of those sequences in relation to the others, as can be seen in the neigh-bor-joining tree of all haplotypes (Figure 7).
Discussion
The analysis of both nuclear and mitochondrial ge-netic data of populations of yellowtail snappers,Ocyurus chrysurus,did not reveal genetic differences that could jus-tify rejecting the null hypothesis of panmixia along the 2380 km of Brazilian coast, but significant differences were observed between Brazilian and Caribbean populations. In contrast, we observed significant differences in the
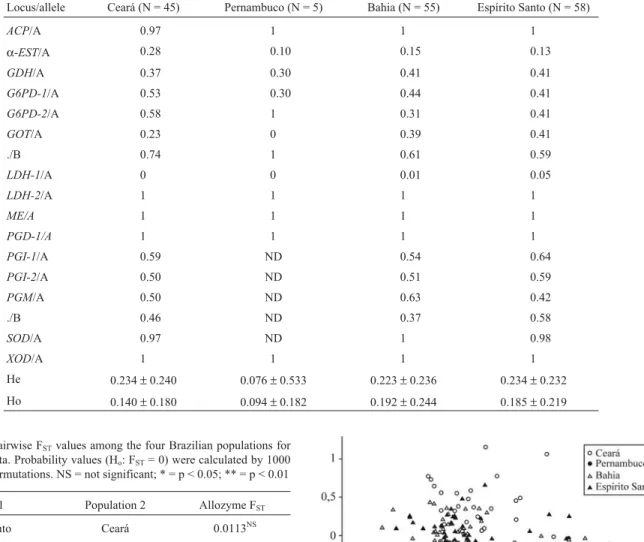
mor-Table 3- Allele frequencies for the 14locianalysed. For simplicity, the slowest migrating allele for eachlocusis not shown: its frequency can be calcu-lated as oneminusthe frequency of the other alleles at thatlocusin the population. N = number of individuals analysed; He = mean Hardy-Weinberg ex-pected heterozygosity; Ho = mean observed heterozygosity (values shown as average±standard error)
Locus/allele Ceará (N = 45) Pernambuco (N = 5) Bahia (N = 55) Espírito Santo (N = 58)
ACP/A 0.97 1 1 1
α-EST/A 0.28 0.10 0.15 0.13
GDH/A 0.37 0.30 0.41 0.41
G6PD-1/A 0.53 0.30 0.44 0.41
G6PD-2/A 0.58 1 0.31 0.41
GOT/A 0.23 0 0.39 0.41
./B 0.74 1 0.61 0.59
LDH-1/A 0 0 0.01 0.05
LDH-2/A 1 1 1 1
ME/A 1 1 1 1
PGD-1/A 1 1 1 1
PGI-1/A 0.59 ND 0.54 0.64
PGI-2/A 0.50 ND 0.51 0.59
PGM/A 0.50 ND 0.63 0.42
./B 0.46 ND 0.37 0.58
SOD/A 0.97 ND 1 0.98
XOD/A 1 1 1 1
He 0.234±0.240 0.076±0.533 0.223±0.236 0.234±0.232
Ho 0.140±0.180 0.094±0.182 0.192±0.244 0.185±0.219
Table 4- Pairwise FSTvalues among the four Brazilian populations for
allozyme data. Probability values (Ho: FST= 0) were calculated by 1000
bootstrap permutations. NS = not significant; * = p < 0.05; ** = p < 0.01
Population 1 Population 2 Allozyme FST
Espírito Santo Ceará 0.0113NS
Espírito Santo Pernambuco 0.1726*
Espírito Santo Bahia 0.0005NS
Ceará Pernambuco 0.1010NS
Ceará Bahia 0.0202NS
Pernambuco Bahia 0.2256**
phology of the Brazilian samples (F[48,515] = 10.84;
p < 0.0001).
Some heterogeneity was observed in allozyme fre-quencies among Brazilian populations (FST = 0.0277;
p < 0.05). This heterogeneity was caused by the large dif-ferences observed between Pernambuco and other
Brazil-ian populations (Table 4, Figure 4). However, since only 5 individuals were analysed from that population, it is likely that the differences encountered simply result from sam-pling error. Indeed, when we excluded Pernambuco from the analysis, the mean FSTvalues became non-significant
(FST= 0.0098; p > 0.30). Therefore, we cautiously conclude
that there is no support from the allozyme data to reject the null hypothesis of panmixia in this species along the stud-ied area on the Brazilian coast.
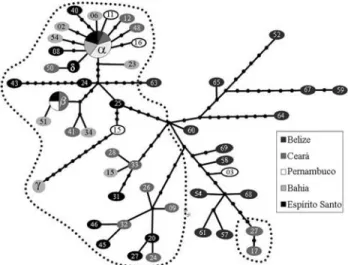
The control region ofO. chysurusis extremely vari-able (haplotype diversity = 0.9614). However, this variabil-ity is much higher within than between sampling locations in Brazil (Tables 5 and 6), and both the haplotype network generated by nested-clade analysis (Figure 5) and the com-plete haplotype tree (Figure 7) show that the haplotypes from the Brazilian samples are distributed haphazardly along the coast. The Caribbean samples, on the other hand, differ significantly from the southwestern Atlantic ones (FST= 0.17, p < 0.05; Table 5). This can also be seen in the
haplotype network and the haplotype tree (Figures 5 and 7), where most samples from Belize cluster outside of the southwestern Atlantic ones. The haplotype network has a
Figure 5- mtDNA control-region haplotype network. Different shades of grey are used to indicate sample locations. Hypothetical non-sampled haplotypes are indicated by dots. Lines connecting haplotypes correspond to single nucleotide changes. Dotted line surrounds haplotype clusters from the southwestern Atlantic. Haplotype α: samples CE22, CE06, PE01, PE06, PE10, PE13, PE14, PE17, BA10, BA11, BA47, ES04, ES07, ES41, BE62; Haplotypeβ: CE05, CE53, PE4, ES42; Haplotypeγ: BA43, BA46; Haplotypeδ: ES28, ES52.
Figure 6- Mismatch distribution analysis for the Belize population. The line shows the expected distribution under the null hypothesis of popula-tion expansion.
Table 5- Pairwise mtDNA FSTvalues betweenO. chrysuruspopulations (below the diagonal). The significance of each value (Ho: FST= 0) is shown
above the diagonal. * p < 0,05.
Belize Ceará Pernambuco Bahia Espírito Santo
Belize 0.000+-0.00* 0.000+-0.00* 0.000+-0.00* 0.000+-0.00*
Ceará 0.07763 0.054+-0.03 0.117+-0.03 0.468+-0.04
Pernambuco 0.21298 0.07341 0.657+-0.07 0.216+-0.02
Bahia 0.17277 0.04022 -0.02348 0.315+-0.03
Espírito Santo 0.17159 -0.00254 0.01821 0.01320
Table 6- Results of the analysis of molecular variance (AMOVA) from mtDNA sequence data of the Brazilian populations. O.B.P. = Other Bra-zilian Populations. *p < 0.05.
Groups Among
groups
Within populations
Ceará X O.B.P. -3.95 100.00
Pernambuco X O.B.P. 1.51 97.66
Bahia X O.B.P. -2.01 99.39
Espírito Santo X O.B.P. 4.25 96.31
Ceará and Pernambuco X O.B.P. -1.50 98.90
Ceará and Bahia X O.B.P. -2.30 99.16
Ceará and Espírito Santo X O.B.P. 3.74 97.18
Ceará X Pernambuco X O.B.P. -3.33 98.95
Pernambuco X Bahia X O.B.P. 2.59 97.98
Pernambuco X Espírito Santo X O.B.P. 3.43 97.84
Bahia X Ceará X O.B.P. -7.19 99.58
Bahia X Espírito Santo X O.B.P. 0.91 98.25
Ceará X Espírito Santo X O.B.P. 3.43 97.84
signal of recent population expansion (star-shaped topol-ogy around haplotypeαin Figure 5), but that grouping was not significant in the nested-clade analysis, and none of the Brazilian samples presented deviations from neutrality in both Fu’s and Tajima’s tests. On the other hand, the se-quences of the population from Belize diverged from neu-tral expectation (Fu’s Fs = -8.88; p < 0.001), and the mismatch distribution analysis (Figure 6) had a mode of 15 nucleotide differences, which is a clear signal of an old pop-ulation expansion. The analysis of mtDNA thus indicates that the population from the Caribbean is old and currently stable. It shows also that the Caribbean population is differ-ent from the Brazilian one which is homogeneous along its distribution.
The results of the morphometric geometric analyses show what seems to be a north-south gradient of body shape, ranging from fusiform individuals, with a long cau-dal fin in specimens from the north to more rounded indi-viduals, with shorter caudal fin in the south. Gradients in morphometric characters are often associated to phenotypic plasticity (O’Reilly and Horn, 2004). The morphometric differences observed are not incompatible with the exis-tence of discrete fish stocks, since patterns of reef fish com-munity change along the Brazilian coast often show a north-south differentiation (Floeteret al., 2001), but this re-sult contrasts with the homogeneity observed with both nuclear and mitochondrial data. It has been argued that morphometric analyses can sometimes detect subtle differ-ences in stock structure which are undetectable by genetic data, particularly when stock structure is the result of very recent population subdivision (Cadrin, 2000). However, the differences in morphometric data on a background of genetic homogeneity could also indicate phenotypic plas-ticity. This phenomenon may occur as response to gradients in environmental cues (Viaet al., 1995). Such environmen-tal gradient is likely to occur along a geographic range of more than 15° of latitude and ca. 2,400 km of coastline as
the one inhabited by the studied Brazilian populations of
Ocyurus chrysurus. Differences in oceanographic condi-tions, mainly sea-water temperature, were reported to this area (Castro and Miranda, 1998) being regarded as an im-portant factor in the genetic differentiation ofMacrodon ancylodonpopulations along the Brazilian coast (Santoset al., 2003). Cases where morphometric and genetic data in-dicate different scenarios of population structuring are not uncommon (Saliniet al., 2004; Leviet al., 2004). In the case ofOcyurus chrysurus, the fact that the morphological variation observed formed a gradient is a clear indication that it has likely resulted from phenotypic plasticity. We thus conclude that the genetic data do not allow the rejec-tion of the null hypothesis of panmixia for Brazilian yellowtail snapper populations which could be treated as a single genetic stock, with a latitudinal gradient on their morphology. On the other hand, there is a severe restriction to gene flow betweenO. chrysuruspopulations from the Caribbean and from the southwestern Atlantic.
Acknowledgments
The authors thank Drs. Carlos Arthur Sobreira Rocha, Rosangela Lessa, Agnaldo Silva Martins, George Olavo Mattos e Silva, Paulo Roberto Duarte Lopes and many oth-ers from the REVIZEE program for invaluable support dur-ing the first stages of this work. We thank Dr. Luiz Rocha for samples collection in Belize. Cristiano Lazoski revised an earlier version of this manuscript. This work is part of the thesis in Genetics of Anderson Vasconcellos. Financial support for this work was provided by the REVIZEE pro-gram, by CNPq and FAPERJ.
References
Allen GR (1985) Snappers of the world. An annotated and illus-trated catalogue of lutjanid species known to date. FAO Fish Synop 125:1-208.
Allman JA, Barbieri LR and Bartels CT (2005) Regional and fish-ery-specific patterns of age and growth of yellowtail snap-per,Ocyurus chrysurus. Gulf Mex Sci 2005:211-223. Batista RP and Solé-Cava A (2005) Baixa diferenciação genética
entre populações do peixe-batata (Lopholatilus villarii Mi-randa-Ribeiro, 1915) ao norte e sul do banco dos Abrolhos, Brasil. In: PAS Costa, AS Martins and G Olavo (ed.) Pesca e Potenciais de Exploração de Recursos Vivos na Região Cen-tral da Zona Econômica Exclusiva Brasileira. Editora da UFRJ, Rio de Janeiro, pp 241-247.
Belkhir K, Borsa P, Chikhi L, Raufaste N and Bonhomme F (2002) GENETIX 4.04, logiciel sous Windows TM pour la génétique des populations. Montpellier (France). Labora-toire Génome, Populations, Interactions, CNRS UMR 5000, Université de Montpellier II.
Blaber SJM, Dichmont CM, Buckworth RC, Badrudin, Sumiono B, Nurhakim S, Iskandar B, Fegan B, Ramm DC and Salini JP (2005) Shared stocks of snappers (Lutjanidae) in Austra-lia and Indonesia: Integrating biology, population dynamics and socio-economics to examine management scenarios. Rev Fish Biol Fish 15:111-127.
Booke HE (1981) The conundrum of the stock concept - Are na-ture and nurna-ture definable in fisheries science? Can J Fish Aquat Sci 38:1479-1480.
Bookstein FL (1989) Principal warps: Thin-plate splines and the decomposition of deformations. IEEE Trans Pat Anal Mach Intel 11:567-585.
Caddy JF and Seijo JC (2005) This is more difficult than we thought! The responsibility of scientists, managers and sta-keholders to mitigate the unsustainability of marine fisher-ies. Phil Trans Royal Soc B 360:59-75.
Cadrin SX (2000) Advances in morphometric identification of fishery stocks. Rev Fish Biol and Fish 10:91-112.
Carmen MA and Ablan A (2006) Genetics and the study of fisher-ies connectivity in Asian developing countrfisher-ies. Fish Res 78:158-168.
Carvalho GR and Hauser L (1995) Molecular genetics and the stock concept in fisheries. In: Carvalho GR and Pitcher TJ (eds) Molecular Genetics in Fisheries. Chapman & Hall, London, pp 55-79.
Castro BM and Miranda LBd (1998) Physical oceanography of the western Atlantic Continental Shelf located between 4° N and 34° S coastal segment (4, W). In: Robinson AR and Brink KH (eds) The Sea VII. John Wiley and Sons Inc, Lon-don, pp 209-251.
Cavalcanti MJ, Monteiro LR and Lopes PRD (1999) Landmark-based morphometric analysis in selected species of serranid fishes (Perciformes, Teleostei). Zool Stud 38:287-294. Claro R (1983) Ecologia y ciclo de vida de la rabirrubia,O.
chrysurus (Bloch), en la plataforma cubana. II. Edad y crecimiento, estructura de poblaciones y pesquerias. Rep In-vest Inst Oceanol Acad Cien Cuba 19:1-33.
Clement M, Posada M and Crandall KA (2000) TCS: A computer program to estimate gene genealogies. Mol Ecol 9:1657-1660.
Costa PAS, Braga AD and da Rocha LOF (2003) Reef fisheries in Porto Seguro, Eastern Brazilian Coast. Fish Res 60:577-583. Excoffier L, Laval G and Schneider S (2005) Arlequin ver. 3.0: An integrated software package for population genetics data analysis. Evol Bioinf Online 1:47-50.
Excoffier L, Smouse PE and Quattro JM (1992) Analysis of mo-lecular variance inferred from metric distances among DNA haplotypes-application to human mitochondrial-DNA re-striction data. Genetics 131:479-491.
Fallows JA (1984) The behavioural ecology of feeding in the yellowtail snapper,Ocyurus chrysurus(Family Lutjanidae). PhD Thesis, University of Newcastle Upon Tyne, Newcas-tle.
FAO (2002) El Estado Mundial de la Pesca y la Acuicultura. Food and Agriculture Organization of the United Nations, Rome, 150 pp.
Floeter SR, Guimarães RZP, Rocha LA, Ferreira CEL, Rangel CA and Gasparini JL (2001) Geographic variation in reef-fish assemblages along the Brazilian coast. Global Ecol Biogeogr 10:423-431.
Fu YX and Li WH (1993) Statistical tests of neutrality of muta-tions. Genetics 133:693-709.
Garcia SM and Grainger RJR (2005) Gloom and doom? The fu-ture of marine capfu-ture fisheries. Phil Trans Royal Soc B 360:21-46.
Grimes CB (1987) Reproductive biology of the Lutjanidae: A re-view. In: Polovina JJ and Ralston S (eds) Tropical Snappers
and Groupers: Biology and Fisheries Management. Wes-tview Press, Boulder, pp 239-294.
Hammer O, Harper DAT and Ryan PD (2001) PAST: Paleon-tological Statistics Software Package for Education and Data Analysis. Palaeont Elect 4(1).
Harpending HC (1994) Signature of ancient population growth in a low-resolution mitochondrial DNA mismatch distribution. Hum Biol 66:591-600.
Hedgecock D and Strong DR (1994) Conservation biology of en-dangered Pacific salmonids: Introductory remarks. Cons Biol 8:863-894.
Ihssen PE, Booke HE, Casselman JM, McGlade JM, Payne NR and Utter FM (1981) Stock identification: Materials and methods. Can J Fish Aquat Sci 38:1838-1855.
Kocher TD, Thomas WK, Meyer A, Edwards SV, Paabo S, Villablanca FX and Wilson AC (1989) Dynamics of mito-chondrial DNA evolution in animals: Amplification and se-quencing with conserved primers. Proc Nat Acad Sci USA 86:6196-6200.
Lee W-J, Conroy J, Howell WH and Kocher TD (1995) Structure and evolution of teleost mitochondrial control regions. J Mol Evol 41:54-66.
Levi D, Patti B, Rizzo P, Lo Brutto S, Parrinello N and Arculeo M (2004) Genetic and morphometric variations of Mediterra-nean hake, Merluccius merluccius, in the Strait of Sicily (central Mediterranean): Implications for stock assessment of shared resources. Ital J Zool 71:165-170.
Lima D, Freitas JE, Araujo ME and Solé-Cava AM (2005) Ge-netic detection of cryptic species in the frillfin goby
Bathygobius soporator. J Exp Mar Biol Ecol 320:211-223. Manchenko GP (1994) Handbook of Detection of Enzymes on
Electrophoretic Gels.CRC Press Inc, Ann Arbor, 341 pp. Menezes NA and Figueiredo JL (1980) Manual de Peixes
Mari-nhos do Sudeste do Brasil. IV Teleostei (3). Museu de Zoologia, São Paulo, 96 pp.
O’Reilly K and Horn MH (2004) Phenotypic variation among populations ofAtherinops affinis(Atherinopsidae) with in-sights from a geometric morphometric analysis. J Fish Biol 64:1117-1135.
Ormerod SJ (2003) Current issues with fish and fisheries: Editor’s overview and introduction. J Appl Ecol 40:204-213. Ovenden JR (1990) Mitochondrial DNA and marine stock
assess-ment: A review. Austr J Mar Freshwat Res 41:835-853. Paiva MP and Andrade-Tubino MF (1998) Distribuição e
abun-dância de peixes bentônicos explotados pelos linheiros ao largo do sudeste do Brasil (1986-1995). Rev Bras Biol 58:619-632.
Palumbi SR, Martin A, Romano S, McMillan WO, Stice L and Grabowski G (1991) The Simple Fools Guide to PCR, Ver-sion 2.0. Univ. Hawaii, Honolulu, 47 pp.
Parrish JD (1987). The trophic biology of snappers and groupers. In: Polovina JJ and Ralston S (eds) Tropical Snappers and Groupers: Biology and Fisheries Management. Westview Press, Boulder, pp 405-463.
Pauly D, Watson R and Alder J (2005) Global trends in world fish-eries: Impacts on marine ecosystems and food security. Phil Trans R Soc B 360:5-12.
Poulik MD (1957) Starch gel electrophoresis in a discontinuous system of buffers. Nature 180:1477-1479.
Raymond M and Rousset F (1995) An exact test for population differentiation. Evolution 49:1280-1283.
Resende SM, Ferreira BP and Fredou T (2003) A pesca de Lut-janídeos no nordeste do Brasil: Histórico das pescarias, características das espécies e relevância para o manejo. Bol Tecn Cient CEPENE 11:257-270.
Riley CM, Holt GJ and Arnold CR (1995) Growth and morphol-ogy of larval and juvenile captive bred Yellowtail Snapper,
Ocyurus chrysurus. Fish Bull 93:179-185.
Rogers AR and Harpending H (1992) Population growth makes waves in the distribution of pairwise genetic differences. Mol Biol Evol 9:552-569.
Rohlf FJ and Slice DE (1990) Extensions of the Procrustes me-thod for the optimal superimposition of landmarks. Syst Zool 39:40-59.
Rozas J, Sánchez-DelBairro JC, Messeguer X and Rozaz R (2003) DNAsp: DNA polymorphism analyses by the coalescent and other methods. Bioinformatics 19:2496-2497.
Ryman N (1991) Conservation genetics considerations in fishery management. J Fish Biol 39:211.
Ryman N and Utter F (1987) Population genetics and fishery man-agement. Washington University Press, London, 420 pp.
Salini JP, Milton DA, Rahman MJ and Hussain MG (2004) Allozyme and morphological variation throughout the geo-graphic range of the tropical shad, hilsaTenualosa ilisha. Fish Res 66:53-69.
Santos S, Schneider H and Sampaio MI (2003) Genetic differenti-ation of Macrodon ancylodon (Sciaenidae, Perciformes) populations in Atlantic coastal waters of South America as revealed by mtDNA analysis. Genet Mol Biol 26:151-161.
Shaw PR and Prasad R (1970) Starch gel eletroforesis of enzymes - A compilation of recipes. Biochem Genet 4:297-320.
Slice DE (1998) Morpheuset al.: Software for morphometric re-search. Department of Ecology and Evolution, State Univer-sity of New York, New York.
Smith PJ and Fujio Y (1982) Genetic variation in marine teleosts: High variability in habitat specialists and low variability in habitat generalists. Mar Biol 69:7-20.
Smith PJ, Jamieson A and Birley AJ (1990) Electrophoretic stud-ies and stock concept in marine teleosts. J Cons Int Explor Mer 47:231-245.
Strauss RE and Bookstein FL (1982) The truss: Body form recon-struction in morphometrics. Syst Zool 31:113-135. Tajima F (1996) The amount of DNA polymorphism maintained
in a finite population when the neutral mutation rate varies among sites. Genetics 143:1457-1465.
Templeton AR (1998) Nested clade analyses of phylogeographic data: Testing hypotheses about gene flow and population history. Mol Ecol 7:381-397.
Templeton AR, Routman E and Phillips CA (1995) Separating population structure from population history: A cladistic analyses of the geographical distribution of mitochondrial DNA haplotypes in the tiger salamander, Ambystona tigrinum. Genetics 140:767-782.
Thompson JD, Higgins DG and Gibson TJ (1994) CLUSTAL W: Improving the sensitivity of progressive multiple sequence alignment through sequence weighting, position-specific gap penalties and weight matrix choice. Nucleic Acids Res 22:4673-4680.
Thompson R and Munro JL (1983) The biology, ecology and bionomics of Caribbean reef fishes: Lutjanidae (snappers). In: Munro JL (ed) Caribbean Coral Reef Fishery Resources ICLARM Stud Rev 7. Manila, Philippines, pp 94-109. Vasconcellos M and Gasalla MA (2001) Fisheries catches and the
carrying capacity of marine ecosystems in southern Brazil. Fish Res 50:279-295.
Via S, Gomulkiewicz R, de Jong G, Scheiner SM, Schlichting CD and Van Tienderen PH (1995) Adaptive phenotypic plastic-ity: Consensus and controversy. Trends Ecol Evol 10:212-217.
Ward RD and Beardmore JA (1977) Protein variation in the plaice (Pleuronectes platessa). Genet Res 30:45-62.
Ward RD, Woodwark M and Skibinski DOF (1994) A compari-son of genetic diversity levels in marine, fresh-water, and anadromous fishes. J Fish Biol 44:213-232.
Watson M, Munro JL and Gell FR (2002) Settlement, movement and early juvenile mortality of the yellowtail snapper
Ocyurus chrysurus. Mar Ecol Prog Ser 237:247-256. Zelditch ML, Swiderski DL, Sheets HD and Fink WL (2004)
Geo-metric morphoGeo-metrics for biologists: A primer. Elsevier Ac-ademic Press, San Diego, 443 pp.
Associate Editor: Maria Iracilda Sampaio