INTRODUCTION
Studies of divergence and phylogenetic relation-ships between and within vegetable species of agricultural interest have been one of the most concrete contributions of molecular markers to germplasm organization, plant genetics and breeding. Multivariate techniques such as clustering and ordination analyses for a simplified repre-sentation of the results are frequently employed in these studies. The predecessor of these analyses is the construc-tion of a similarity (or distance) matrix between the culti-vars being evaluated.
Jackson et al. (1989) commented that employment of these techniques has revealed some problems. The ob-jective nature of the analyses is compromised by the sub-jective choice of the clustering method and/or the similar-ity-dissimilarity coefficient.
Several coefficients have been proposed (Sokal and Sneath, 1963; Sneath and Sokal, 1973; Johnson and Wichern, 1988). Similarity coefficients specific for dichotomic variables, especially co-occurrence measures, are suggested for use with RAPD type molecular markers. These coefficients employ several reasons of similarity or differences by total comparisons, and their values vary from 0 to 1 (Skroch et al., 1992). Though many coefficients are available, published studies usually do not justify their preference for any one in particular. Considering that
clus-tering and ordination results can be influenced by this choice (Gower and Legendre, 1986; Jackson et al., 1989), these coefficients need to be better understood, so that the most efficient ones can be employed.
In this study, the alterations caused by eight differ-ent similarity coefficidiffer-ents on the subsequdiffer-ent clustering and ordination analyses of 27 common bean (Phaseolus vul-garis L.) cultivars analyzed by RAPD markers were evalu-ated. The most adequate coefficient was identified for the study of genetic divergence in these cultivars.
MATERIAL AND METHODS
Similarity coefficients were compared among 27 common bean cultivars (Table I) analyzed by RAPD mark-ers. Procedures for DNA extraction, RAPD reaction and electrophoresis were essentially as described by Nienhuis et al. (1995).
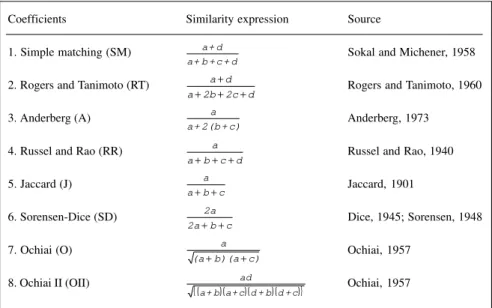
From a zero and one matrix constructed by 137 medium/strong RAPD bands, where zero represented an absence of the band and one the presence, genetic similar-ity estimates (sgij) between each pair of i and j cultivars were performed for eight similarity coefficients (Table II). Similarities derived from these coefficients were trans-formed into genetic distance measures by the following equation: dgij = 1 - sgij. All the genetic similarity matrices met the presuppositions for transformation into genetic distances described by Johnson and Wichern (1988), that is, all of them were non-negative definite. Similarity analy-ses were done with the NTSYS-PC program (Rohlf, 1992). Coefficients were compared by Spearman’s corre-lation between the genetic distances generated by the complement of these coefficients, and also by the evalua-tion of alteraevalua-tions caused by these different coefficients in the subsequent clustering analyses (construction of
den-COMPARISON OF SIMILARITY COEFFICIENTS BASED ON RAPD
MARKERS IN THE COMMON BEAN*
Jair Moura Duarte, João Bosco dos Santos and Leonardo Cunha Melo
ABSTRACT
The alterations caused by eight different similarity coefficients were evaluated in the clustering and ordination of 27 common bean (Phaseolus vulgaris L.) cultivars analyzed by RAPD markers. The Anderberg, simple matching, Rogers and Tanimoto, Russel and Rao, Ochiai, Jaccard, Sorensen-Dice, and Ochiai II’s coefficients were tested. Comparisons among the coeffi-cients were made through correlation analysis of genetic distances obtained by the complement of these coefficoeffi-cients, dendro-gram evaluation (visual inspection and consensus fork index - CIC), projection efficiency in a two-dimensional space, and
groups formed by Tocher’s optimization procedure. The employment of different similarity coefficients caused few alterations in cultivar classification, since correlations among genetic distances were larger than 0.86. Nevertheless, the different similar-ity coefficients altered the projection efficiency in a two-dimensional space and formed different numbers of groups by Tocher’s optimization procedure. Among these coefficients, Russel and Rao’s was the most discordant and the Sorensen-Dice was considered the most adequate due to a higher projection efficiency in a two-dimensional space. Even though few structural changes were suggested in the most different groups, these coefficients altered some relationships between cultivars with high genetic similarity.
*Part of a thesis presented by J.M.D. to the Universidade Federal de Lavras, Lavras, MG, in partial fulfillment of the requirements for the Master’s de-gree.
taxonomic unit (OTU). The different dendrograms were subjectively compared using visual inspection, and then contrasted with consensus trees using the CIC index or consensus fork index, obtained from comparisons of all pair of dendrogram combinations (Rohlf, 1982).
The CIC index gives a relative estimate of dendro-gram similarity. It is obtained by dividing the number of common ramifications between the dendrograms by the maximum possible number of ramifications, which is n-2 for integrally resolved dendrograms (n corresponds to the number of OTU) (Rohlf, 1982). Dendrograms were ob-tained from the ‘SANH-Clustering’ option and the CIC index by the ‘CONSENSUS-Consensus tree’ option, both in the NTSYS-PC program (Rohlf, 1992).
The methodology of Cruz and Viana (1994) was employed, from the GENES program (Cruz, 1997), for the projection of distances in a two-dimensional space. Similarity coefficients were compared by the efficiency of the projection considering:
a) Correlation between the original distances and the distances obtained by the graphic representation of two-dimensional dispersion;
b) Distortion degree (1 - α), considering that:
in which dgij and doij are the graph distances (two-dimen-sional space) and original distances (n-dimen(two-dimen-sional space), respectively, of every pair of i and j cultivars (Cruz and Viana, 1994).
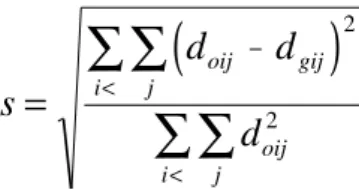
c) Stress (s) value, given by:
Table II - Similarity coefficients studied.
Coefficients Similarity expression Source
1. Simple matching (SM) Sokal and Michener, 1958
2. Rogers and Tanimoto (RT) Rogers and Tanimoto, 1960
3. Anderberg (A) Anderberg, 1973
4. Russel and Rao (RR) Russel and Rao, 1940
5. Jaccard (J) Jaccard, 1901
6. Sorensen-Dice (SD) Dice, 1945; Sorensen, 1948
7. Ochiai (O) Ochiai, 1957
8. Ochiai II (OII) Ochiai, 1957
d + c + b + a
d + a
a d a 2b 2c d
+
+ + +
c) + 2(b + a
a
a a+ + +b c d
a a+ +b c
2a 2a+ +b c
a (a+b)(a+c)
( ) ( ) ( ) ( )
{a+b a+c d+b d+c}
ad drograms and groups formed by Tocher’s optimization procedure, cited by Rao, 1952) and ordination analyses (two-dimensional projection (Cruz and Viana, 1994)).
The unweighted pair-group mean arithmetic method (UPGMA) was employed to construct the den-drograms. Each cultivar was denominated an operational
Table I - Common bean cultivars employed for comparison of similarity
coefficients and respective races and domestication centers.
Cultivars Race Domestication center
01. Puebla 152 Mesoamerica Middle American 02. Mont Calm Nueva Granada Andean South American 03. A-77 Mesoamerica Middle American 04. A-140 Mesoamerica Middle American 05. Jamapa Mesoamerica Middle American 06. Porrilo Sintético Mesoamerica Middle American 07. Sanilac Mesoamerica Middle American 08. A-62 Mesoamerica Middle American 09. Rojo Seda Mesoamerica Middle American 10. Milionário Mesoamerica Middle American 11. Brasil 2 Mesoamerica Middle American 12. Perry Marrow Nueva Granada Andean South American 13. IPA - 7419 Mesoamerica Middle American 14. Great Northern Durango Middle American 15. A-114 Durango Middle American 16. A-175 Mesoamerica Middle American 17. Diacol Andino Nueva Granada Andean South American 18. Carioca Mesoamerica Middle American 19. CNC* Mesoamerica Middle American 20. Flor de Mayo Jalisco Middle American 21. Ojo de Liebre Durango Middle American 22. Apetito Blanco Jalisco Middle American 23. Jalo Nueva Granada Andean South American 24. Bolón Bayo Peru Andean South American 25. ICA Rumichaca Peru Andean South American 26. Frijolica LS-33 Peru Andean South American 27. Kori Inti Peru Andean South American
* CNC = Compuesto Negro Chimaltenango.
α=
∑
∑
∑
∑
<<
d
d gij j i
This statistical representation of stress (standard-ized residual sum of squares) was proposed by Kruskal (1964). It is a parameter that determines the goodness-of-fit of the graphic projection. Stress was classified accord-ing to the followaccord-ing suggestions (Kruskal, 1964):
Stress level (%) Goodness-of-fit
40 unsatisfactory
20 regular
10 good
5 excellent
0 perfect
The establishment of groups by Tocher’s optimi-zation procedure was obtained using the GENES program (Cruz, 1997). The largest value of the set of smaller dis-tances involving each cultivar studied was considered as the inter-group distance limit.
Levels of statistical significance are not given be-cause the analyses are derived from a single initial data matrix and therefore lack independence.
RESULTS AND DISCUSSION
Correlations between the different genetic distances were all close to 1 (Table III), making it evident that they are highly related. Even though all these correlations were elevated, for the Russel and Rao’s coefficient they were slightly inferior than for the other coefficients. These high distance correlations seem to be constant for the different coefficients applied to dichotomic variables. Johns et al. (1997), in a study with RAPD markers in the common bean, found correlations on the order of 0.989, 0.972 and 0.979 between the genetic distances obtained by the complement
of the simple matching coefficient, Jaccard and Nei-Li’s coefficients and Rogers’ modified distance, respectively.
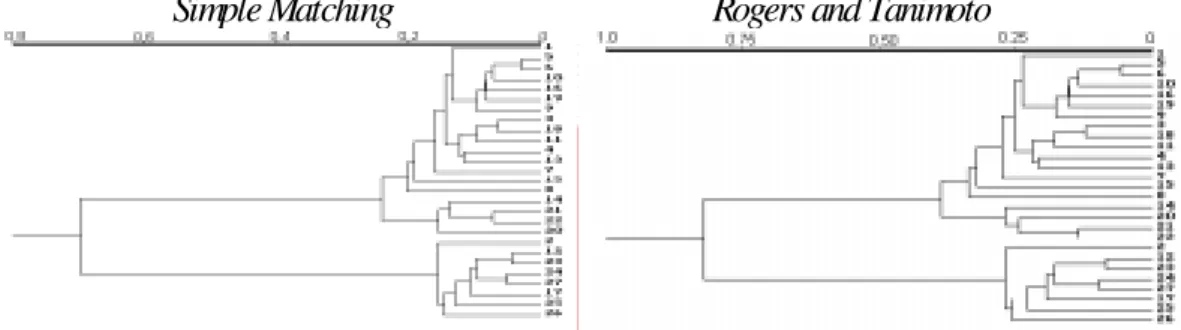
The dendrograms constructed from the coefficients studied all presented the same general structure (Figure 1), making it evident that the different coefficients caused few alterations. Considering that the 27 common bean cultivars belonged to two distinct domestication centers and different races, one can perceive that all the dendro-grams were capable of dividing the cultivars into their re-spective domestication centers. However, some modifica-tions in the clustering of races could be found. These re-sults are in agreement with those obtained by Johns et al. (1997), who verified that different similarity coefficients basically did not influence the clustering of common bean landraces from Chile in groups corresponding to the Mesoamerican and Andean domestication centers.
Although all dendrograms were similar, when they were contrasted by the CIC index (Table IV), small differ-ences among them were made evident. By this index, whose amplitude goes from 0 to 1, two dendrograms are consid-ered identical when the calculated value equals one. There-fore, the dendrogram in Figure 1 obtained by Jaccard’s similarity coefficient is identical to that of Sorensen-Dice, as were Rogers and Tanimoto’s and Ochiai II’s. Compar-ing dendrograms by this index, one can also perceive their division into two groups, based on their similarity: the first corresponded to those constructed by simple matching, Rogers and Tanimoto, Ochiai and Ochiai II’s coefficients. The other group involved Anderberg, Jaccard and Sorensen-Dice’s coefficients. It was also observed that the dendrogram constructed by the Russel and Rao’s coeffi-cient presented very low CIC index values compared to the other coefficients, making it evident that this coefficient is the most discriminating, as a visual evaluation of this den-drogram (Figure 1) shows. These results are highly coher-ent with those prescoher-ented by Jackson et al. (1989), who study-ing relationships between different fish species based on different similarity coefficients, verified that cluster analy-sis shows a strong similarity between dendrograms obtained with Jaccard and Sorensen-Dice’s coefficients, and simple matching and Rogers and Tanimoto’s coefficients.
The similar appearance in some dendrograms is not surprising since generalizations about the properties of several coefficients are possible. They are differentiated by the manner in which the matrix of original data (1 = presence of the RAPD marker and 0 = absence) is em-ployed in the similarity estimate. When two genotypes are compared, the following situations occur: a = 1.1; b = 1.0; c = 0.1; d = 0.0. Thus, Jaccard and Sorensen-Dice’s coef-ficients are equivalent, except that double weight is given to positive occurrences (a) in the Sorensen-Dice’s efficient. Simple matching and Rogers and Tanimoto’s co-efficients include negative co-occurrences (d), but differ by the double weight given to the disagreements (that is, b and c) in the latter coefficient. As shown by the results presented, different weights of values of a, b, c and d
(
)
s
d
d
d
oij gij j
i
oij j i
=
−
∑
∑
∑
∑
<
<
2
2
Table III - Spearman’s correlation between the genetic distances
generatedfrom the complement of the similarity coefficients*.
Coefficients SM RT A RR J SD O OII
SM 1.00 RT 1.00 1.00 A 0.96 0.96 1.00 RR 0.87 0.87 0.94 1.00 J 0.96 0.96 0.99 0.95 1.00 SD 0.96 0.96 0.99 0.95 1.00 1.00 O 0.96 0.96 0.99 0.95 0.99 0.99 1.00 OII 0.99 0.96 0.98 0.90 0.99 0.99 0.99 1.00
Simple Matching
Rogers and Tanimoto
Anderberg
Russel and Rao
Jaccard
Sorensen-Dice
Ochiai
Ochiai II
Figure 1 - Dendrograms constructed from matrices of genetic distances obtained by the complement of the
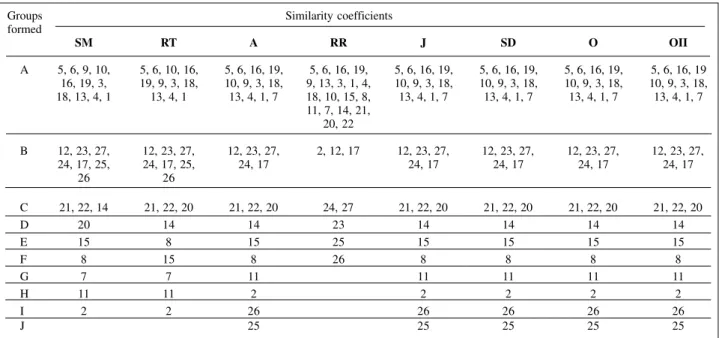
cedure, cited by Rao (1952). In this method, individuals (cultivars) are partitioned into non-empty and mutually exclusive sub-groups by means of maximization or mini-mization of a pre-established measurement (Cruz and Regazzi, 1994), requiring a similarity or distance matrix, which can be obtained by several coefficients. Different coefficients altered the number of groups formed, which varied from six to 10 (Table VI). They also altered the classification of some cultivars in these groups. Prior re-sults (Table VI) had the same tendency, in which Russel and Rao’s similarity coefficient once again was the most discriminatory. Sokal and Sneath (1963) reported that this coefficient is, in essence, a ‘hybrid’ coefficient, excluding negative co-occurrences (d) from the numerator, but not from the denominator. This seems to be of questionable usefulness.
All results obtained illustrate the redundancy of the different coefficients. Anderberg, Jaccard and Sorensen-Dice’s coefficients had approximately identical results, as seem to have limited impact on the subsequent analyses.
The different similarity coefficients altered the ef-ficiency of distance projection in a two-dimensional space (Table V). Considering the three evaluation parameters of efficiency separately (distortion, correlation between origi-nal and estimated distances and stress), one can perceive the same general tendency of coefficient classification. The distorted values are coherent with the correlation values, and both values are coherent with the level of stress. Stress values are the most widely used parameter to evaluate pro-jection efficiency. The Ochiai’s coefficient showed the smallest stress value and Russel and Rao’s the biggest. According to Kruskal (1964), simple matching, Sorensen-Dice and Ochiai’s coefficients had good levels of stress. Rogers and Tanimoto, Anderberg, Jaccard and Ochiai II’s coefficients had regular, and only the Russel and Rao’s coefficient had stress considered unsatisfactory.
One cultivar clustering method that has also been employed with RAPD data is Tocher’s optimization
pro-Table IV - Comparison of the dendrograms generated by the similarity
coefficients employing the values of the consensus fork index (CIC index)*.
Coefficients SM RT A RR J SD O OII
SM 0.76 0.28 0.12 0.16 0.16 0.52 0.76
RT 0.36 0.16 0.24 0.24 0.76 1.00
A 0.08 0.88 0.88 0.24 0.36
RR 0.12 0.12 0.20 0.16
J 1.00 0.36 0.24
SD 0.36 0.24
O 0.76
OII
* Abbreviations defined in Table II.
Table V - Distortion degree (%), correlation (r) between the original and
estimated distances, and value of the stress (%), obtained by the projec-tion of the genetic distances in a two-dimensional space*.
Coefficients Distortion (%) r Stress (%)
SM 11.2 0.989 13.7
RT 19.6 0.987 21.5
A 29.1 0.965 32.0
RR 53.4 0.946 56.5
J 19.0 0.988 21.0
SD 10.1 0.995 11.5
O 9.9 0.995 11.4
OII 18.9 0.988 20.7
* Abbreviations defined in Table II.
Table VI - Clustering of common bean cultivars by means of Tocher’s optimization method considering different similarity coefficients*.
Groups Similarity coefficients
formed
SM RT A RR J SD O OII
A 5, 6, 9, 10, 5, 6, 10, 16, 5, 6, 16, 19, 5, 6, 16, 19, 5, 6, 16, 19, 5, 6, 16, 19, 5, 6, 16, 19, 5, 6, 16, 19 16, 19, 3, 19, 9, 3, 18, 10, 9, 3, 18, 9, 13, 3, 1, 4, 10, 9, 3, 18, 10, 9, 3, 18, 10, 9, 3, 18, 10, 9, 3, 18, 18, 13, 4, 1 13, 4, 1 13, 4, 1, 7 18, 10, 15, 8, 13, 4, 1, 7 13, 4, 1, 7 13, 4, 1, 7 13, 4, 1, 7
11, 7, 14, 21, 20, 22
B 12, 23, 27, 12, 23, 27, 12, 23, 27, 2, 12, 17 12, 23, 27, 12, 23, 27, 12, 23, 27, 12, 23, 27,
24, 17, 25, 24, 17, 25, 24, 17 24, 17 24, 17 24, 17 24, 17
26 26
C 21, 22, 14 21, 22, 20 21, 22, 20 24, 27 21, 22, 20 21, 22, 20 21, 22, 20 21, 22, 20
D 20 14 14 23 14 14 14 14
E 15 8 15 25 15 15 15 15
F 8 15 8 26 8 8 8 8
G 7 7 11 11 11 11 11
H 11 11 2 2 2 2 2
I 2 2 26 26 26 26 26
J 25 25 25 25 25
did the simple matching and Rogers and Tanimoto’s coef-ficients. Nevertheless, similarity coefficient choice should be based on some criteria, because even a few structural changes of more differentiated groups can alter the rela-tionship between cultivars with high genetic similarity.
In relation to these criteria, an important aspect to be considered is the inclusion or exclusion of negative co-occurrences in the coefficient. This inclusion is highly re-lated to the type of trait with which one is working. In some cases, an absence of the trait in both individuals would indicate similarity, but in other cases, this is not necessarily true. Taking into consideration the genetic ba-sis of RAPD markers (Williams et al., 1990), the absence of amplification of a determined band in two genotypes does not necessarily represent genetic similarity between them, which makes those coefficients that exclude these negative co-occurrences from their expression of similar-ity (Jaccard, Sorensen-Dice, Ochiai, etc.) more adequate for use with this type of marker. Sokal and Sneath (1963) also stated that the simpler the coefficient the easier its interpretation; therefore, simpler coefficients should pref-erentially be employed. Jaccard’s similarity coefficient is the simplest of its category (exclusion of d), and it has been widely employed with RAPD markers. In this study, it was verified that cultivar cluster results with Jaccard and Sorensen-Dice’s coefficients were identical, but for the latter, a higher projection efficiency in a two-dimensional space (smaller distortion and stress, higher correlation) was obtained, so that the Sorensen-Dice’s coefficient can be considered as the most adequate for a genetic divergence study in this group of cultivars, employing RAPD markers.
ACKNOWLEDGMENTS
Research supported by CAPES and FAPEMIG.
RESUMO
Foram avaliadas as alterações provocadas por oito diferentes coeficientes de similaridade no agrupamento de 27 cultivares de feijão analisados por marcadores RAPD. Foram testados os coeficientes de Anderberg, simple matching, Rogers e Tanimoto, Russel e Rao, Ochiai, Jaccard, Sorensen-Dice e Ochiai II, sendo as comparações entre eles realizadas pelas correlações entre as distâncias genéticas obtidas pelo complemento destes coeficientes, e também pela avaliação dos dendrogramas (inspeção visual e índice CIC), eficiência da projeção no espaço bidimensional e grupos formados pelo método de otimização de Tocher. Os resultados evidenciaram que a utilização de diferentes coeficientes de similaridade provocou poucas alterações na classificação dos cultivares em grupos, sendo as correlações obtidas entre as distâncias genéticas maiores que 0,86. Apesar disso, foi observado que diferentes coeficientes alteraram a eficiência da projeção no espaço bidimensional e formaram número diferenciado de grupos pelo método de otimização de Tocher. Dentre estes, o de Russel e Rao apresentou resultados mais discordantes em relação aos demais e o de Sorensen-Dice foi considerado o mais adequado devido a uma maior eficiência de projeção no espaço bidimensional. Mesmo
provocando poucas mudanças na estrutura dos grupos mais diferenciados, estes coeficientes alteraram alguns relacionamentos entre cultivares com alta similaridade genética.
REFERENCES
Anderberg, M.R. (1973). Cluster Analysis for Applications. Academic
Press, New York.
Cruz, C.D. (1997). Programa Genes: aplicativo computacional em genética
e estatística. Universidade Federal de Viçosa, Viçosa.
Cruz, C.D. and Regazzi, A.J. (1994). Modelos Biométricos Aplicados ao
Melhoramento Genético. UFV, Viçosa.
Cruz, C.D. and Viana, J.M.S. (1994). A methodology of genetic
diver-gence analysis based on sample unit projection on two-dimensional space. Rev. Bras. Genet.17: 69-73.
Dice, L.R. (1945). Measures of the amount of ecologic association between
species. Ecology 26: 297-302.
Gower, J.C. and Legendre, P. (1986). Metric and Euclidean properties of
dissimilarity coefficients. J. Classif. 3: 5-48.
Jaccard, P. (1901). Étude comparative de la distribution florale dans une por-tion des Alpes et des Jura. Bull. Soc. Vaudoise Sci. Nat. 37: 547-579.
Jackson, A.A., Somers, K.M. and Harvey, H.H. (1989). Similarity
coeffi-cients: measures for co-occurrence and association or simply mea-sures of occurrence? Am. Nat.133: 436-453.
Johns, M.A., Skroch, P.W., Nienhuis, J., Kinrichsen, P., Bascur, G. and
Muñoz-Schick, C. (1997).Gene pool classification of common bean
landraces from Chile based on RAPD and morphological data. Crop Sci.37: 605-613.
Johnson, R.A. and Wichern, D.W. (1988). Applied Multivariate
Statisti-cal Analysis. Prentice-Hall, New Jersey.
Kruskal, J.B. (1964). Multidimensional scaling by optimizing goodness of
fit to a non-metric hypothesis. Psychometrika29: 1-27.
Nienhuis, J., Tivang, J., Sckroch, P. and Santos, J.B. dos (1995). Genetic
relationships among cultivars and lines of lima bean (Phaseolus lunatus L.) as measured by RAPD markers. J. Am. Soc. Hort. Sci. 120: 300-306.
Ochiai, A. (1957). Zoogeographic studies on the soleoid fishes found in
Japan and its neighbouring regions. Bull. Jpn. Soc. Sci. Fish. 22: 526-530.
Rao, R.C. (1952). Advanced Statistical Methods in Biometric Research. J.
Wiley, New York.
Rogers, D.J. and Tanimoto, T.T. (1960). A computer program for
classify-ing plants. Science 132: 1115-1118.
Rohlf, F.J. (1982). Consensus indices for comparing classifications. Math.
Biosci. 59: 131-144.
Rohlf, F.J. (1992). Numerical Taxonomy and Multivariate Analysis
Sys-tem. Version 1.70. Exeter Software, Setauker, NY.
Russel, P.F. and Rao, T.R. (1940). On habitat and association of species of anopheline larvae in south-eastern Madras. J. Malaria Inst. India 3: 153-178.
Skroch, P., Tivang, J. and Nienhuis, J. (1992). Analysis of genetic
rela-tionships using RAPD marker data. In: Applications of RAPD Tech-nology to Plant Breeding. Joint Plant Breeding Symposia Series,
Minneapolis, 1992. CCSA, ASHS, and AGA, Madison, pp. 26-30.
Sneath, P.H.A. and Sokal, R.R. (1973). Numerical Taxonomy: the
Prin-ciples and Practice of Numerical Classification. W.H. Freeman, San Francisco.
Sokal, R.R. and Michener, C.D. (1958). A statistical method for
evaluat-ing systematic relationships. Univ. Kans. Sci. Bull. 38: 1409-1438.
Sokal, R.R. and Sneath, P.H.A. (1963). Principles of Numeric Taxonomy.
W.H. Freeman, San Francisco.
Sorensen, T. (1948). A method of establishing groups of equal amplitude in
plant sociology based on similarity of species content and its appli-cation to analyses of the vegetation on Danish commons. K. Dan. Vidensk. Selsk. Biol. Skr. 5: 1-34.
Williams, J.G.K., Kubelik, A.R., Livak, K.J., Rafalski, J.A. and Tingey,
S.V. (1990). DNA polymorphisms amplified by arbitrary primers are useful as genetic markers. Nucleic Acids Res. 18: 6531-6535.