Comparison of similarity coefficients used for cluster analysis
with dominant markers in maize (
Zea mays
L)
Andréia da Silva Meyer
1, Antonio Augusto Franco Garcia
2, Anete Pereira de Souza
3and Cláudio Lopes de Souza Jr.
21
Uscola Superior de Agricultura “Luiz de Queiroz”, Departamento de Ciências Exatas,
Piracicaba, SP, Brazil.
2
Escola Superior de Agricultura “Luiz de Queiroz”, Departamento de Genética, Piracicaba, SP, Brazil.
3Universidade Estadual de Campinas, Departamento de Genética e Evolução, Campinas, SP, Brazil.
Abstract
The objective of this study was to evaluate whether different similarity coefficients used with dominant markers can influence the results of cluster analysis, using eighteen inbred lines of maize from two different populations, BR-105 and BR-106. These were analyzed by AFLP and RAPD markers and eight similarity coefficients were calculated: Jaccard, Sorensen-Dice, Anderberg, Ochiai, Simple-matching, Rogers and Tanimoto, Ochiai II and Russel and Rao. The similarity matrices obtained were compared by the Spearman correlation, cluster analysis with dendrograms (UPGMA, WPGMA, Single Linkage, Complete Linkage and Neighbour-Joining methods), the consensus fork index between all pairs of dendrograms, groups obtained through the Tocher optimization procedure and projection efficiency in a two-dimensional space. The results showed that for almost all methodologies and marker systems, the Jaccard, Sorensen-Dice, Anderberg and Ochiai coefficient showed close results, due to the fact that all of them exclude negative co-occurrences. Significant alterations in the results for the Simple Matching, Rogers and Tanimoto, and Ochiai II coefficients were not observed either, probably due to the fact that they all include negative co-occurrences. The Russel and Rao coefficient presented very different results from the others in almost all the cases studied and should not be used, because it excludes the negative co-occurrences in the numerator and includes them in the denominator of their expression. Due to the fact that the negative co-occurrences do not necessarily mean that the regions of the DNA are identical, the use of coefficients that do not include negative co-occurrences was suggested.
Key words:genetic divergence, heterotic groups, AFLP, RAPD, multivariate analysis. Received: February 21, 2003; Accepted: October 21, 2003.
Introduction
Studies of divergence among vegetal species of agro-nomic importance have been receiving greater attention, mainly with the recent adoption of molecular markers (Duarteet al., 1999). In these studies, researchers are inter-ested in clustering similar individuals, so that the greater difference occurs among the formed groups. Statistical methods, such as cluster analysis, factor analysis, discriminant analysis and principal component analysis can be applied to help in this kind of study. Among them, clus-ter analysis stands out as it does not demand an initial hy-pothesis regarding the probability distribution of the data and as it provides easy interpretation.
Nevertheless, before employing some of these meth-ods, a similarity (or distance) matrix must be obtained among the genotypes. These matrices can be calculated in diverse ways, and are differences in the proposals found nowadays in literature (Sneath and Sokal, 1973; Johnson and Wichern, 1988; Weir, 1996).
The similarity coefficients are specific for dichotomic (binary) variables and their use is suggested for divergency studies based on dominant molecular markers, such as RAPD (Duarteet al., 1999). In general, they are based on comparisons between co-occurring bands (indicated by ‘ones’ in common in the data matrix) and different bands (in-dicated by ‘one and zero’ or ‘zero and one’) between each genotype pair. Some coefficients also consider the co-occurrence of ‘zeros’ (Johnson and Wichern, 1988). Their values normally vary from 0 to 1 (Skrochet al., 1992).
Considering that the results of clustering can be influ-enced by the similarity coefficient choice (Jacksonet al.,
www.sbg.org.br
Send correspondence to Antonio Augusto Franco Garcia. Escola Superior de Agricultura “Luiz de Queiroz”, Departamento de Gené-tica, Caixa Postal 83, 13400-970 Piracicaba, SP, Brazil. Part of a the-sis presented by A.S.M. at USP/ESALQ/LCE, as a requirement for Masters Degree. Adviser: A.A.F.G. E-mail: aafgarci@esalq. usp.br.
1989; Duarteet al., 1999), these coefficients need to be better understood, so that the most efficient ones in each specific situation can be employed.
Another aspect to be considered is that authors do not usually justify the choice of the employed coefficients, thus showing the necessity of studies on this subject. Duarteet al.(1999) showed for RAPD markers in the common bean that Sorensen-Dices coefficient was the most adequate for divergence studies. However, studies that compare coeffi-cients for cluster analysis, mainly using data from different dominant molecular markers in maize, are rare.
The objective of this study was to investigate the in-fluence of the choice among eight different similarity coef-ficients over the following cluster analysis, based on data taken from the dominant molecular marker analysis (RAPD and AFLP) of 18 maize inbred lines.
Materials and Methods
In this study, 18 S3inbred lines were used, which
were developed by the maize breeding program of the Departamento de Genética - ESALQ/USP, by professor Dr. Cláudio Lopes de Souza Jr. Eight inbred lines were derived from BR-105 populations, and ten from BR-106 popula-tion. Due to different genealogies, these two populations are considered distinct heterotic groups and the inbred lines should follow this previous classification. Both populations were developed by Centro Nacional de Milho e Sorgo (Embrapa Milho e Sorgo).
The amplification for the RAPD marker was carried out as described by Williamset al.(1990) and the AFLP marker was analyzed as described by Voset al.(1995) with twenty enzyme-primer combinations. In both cases, only polymorphic bands were used for the construction of the
bi-nary value matrix, representing the absence and presence of bands by 0 and 1, respectively. Each band was considered a locus.
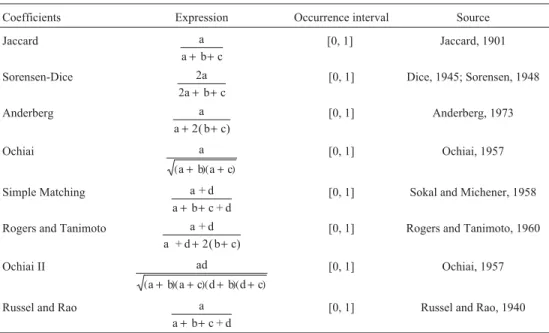
Genetic similarity estimates (gsij) were obtained be-tween each pair of lines (i,j), for both markers, using eight similarity coefficients (Table 1). The similarities obtained using these coefficients were transformed into genetic dis-tances (gdij) by the equation:gdij = 1 -gsij, so that all of them obeyed the presuppositions for the transformation of similarities into genetic distances (Jonhson and Wichern, 1988). The similarity coefficients were calculated with SAS software (Sas Institute, 1992), using the program pre-sented by Victóriaet al.(2001).
For both markers systems, the eight similarity cients were compared using the Sperman correlation coeffi-cient (Hollander, 1973). Dendrograms were produced according to the unweighted pair-group mean arithmetic method (UPGMA), weighted pair-group mean arithmetic method (WPGMA), single linkage method, complete link-age method and neighbor-joining method, using Statistica software (1999) and NTSYS software (Rohlf, 1992). The different dendrograms were then compared using visual in-spection and the consensus fork indexCIC(Rohlf, 1982), in an analogous form to that presented by Duarteet al.(1999). This CIC index provides a relative estimate of the dendrogram similarities and was calculated using NTSYS software (Rohlf, 1992).
The establishment of the clusters was also studied by the Tocher optimization procedure (Rao, 1952), using the Gene Program (Cruz, 2001). The greatest value of the set of smaller distances involving each inbred line studied was considered the inter-group distance limit.
Table 1- Similarity coefficients used among the 18 maize inbred lines, for the AFLP and RAPD markers.
Coefficients Expression Occurrence interval Source
Jaccard a
a+b c+
[0, 1] Jaccard, 1901
Sorensen-Dice 2a
2a+b c+
[0, 1] Dice, 1945; Sorensen, 1948
Anderberg a
a+2(b c)+
[0, 1] Anderberg, 1973
Ochiai
( )( )
a
a+b a c+
[0, 1] Ochiai, 1957
Simple Matching a + d
a+b c + d+
[0, 1] Sokal and Michener, 1958
Rogers and Tanimoto a + d
a + d+2(b c)+
[0, 1] Rogers and Tanimoto, 1960
Ochiai II
( )( )( )( )
ad
a+b a c d+ +b d c+
[0, 1] Ochiai, 1957
Russel and Rao a
a+b c + d+
Finally, the cluster methodology proposed by Cruz and Viana (1994) was used, which consists of making the dissimilarity matrix projection into a two-dimensional space. The similarity coefficients for both markers were compared regarding the efficiency of this obtained projec-tion. To do this, the following was considered:
a) Correlation between the original distances and the distances obtained by two-dimensional dispersion;
b) Degree of distortion (1 -α), given by:
α = <
<
∑
∑
gdod
ij i j
ij i j
wheregdijis the graphical genetic distances between inbred linesiandj, in the two-dimensional space andodijthe origi-nal distances between lines i and j, in a n-dimensional space.
c) Stress value (S), given by:
(
)
S
od gd
od
ij ij i j
ij i j
=
−
< <
∑
∑
2
2
This statistical representation of stress (standardized residual sum of squares), proposed by Kruskal (1964), is a parameter that determines the goodness-of-fit of the graphic projection. The stress was classified according to the criteria presented in Table 2 (Kruskal, 1964).
Results and Discussion
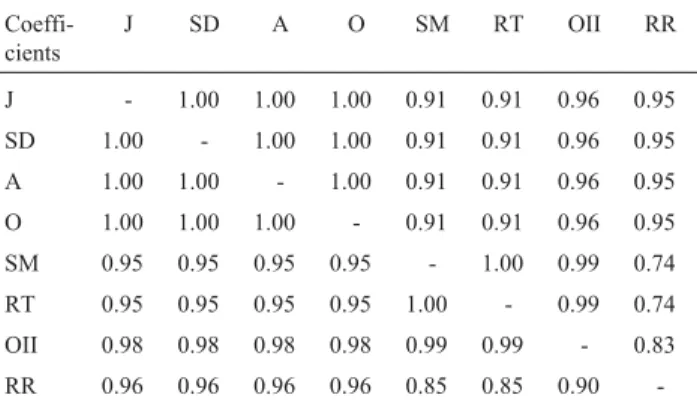
The Sperman correlation coefficients among the eight similarity coefficients, for both markers, were all high, showing that there is a strong association between them, with few rank alterations (Table 3). The Jaccard, Sorensen-Dice and Anderberg coefficients presented correlation val-ues equal to 1.00, indicating that there is no change in the ranks using any one of these coefficients,i.e.they classify the similarity among inbred lines exactly in the same order. The Ochiai coefficient presented correlation values almost equal to 1 in relation to these coefficients. Therefore, the Jaccard, Sorensen-Dice, Anderberg and Ochiai coefficients are highly correlated. The same situation occurred between Simple Matching and the Rogers and Tanimoto
coeffi-cients that also presented correlation value equal to or close to 1.00. However, between these two classes of coeffi-cients, the correlations were lower (Table 3). The Russel and Rao coefficient, however, had slightly inferior correla-tion values with the other coefficients, especially in relacorrela-tion to Simple Matching and the Rogers and Tanimoto and Ochiai II coefficients.
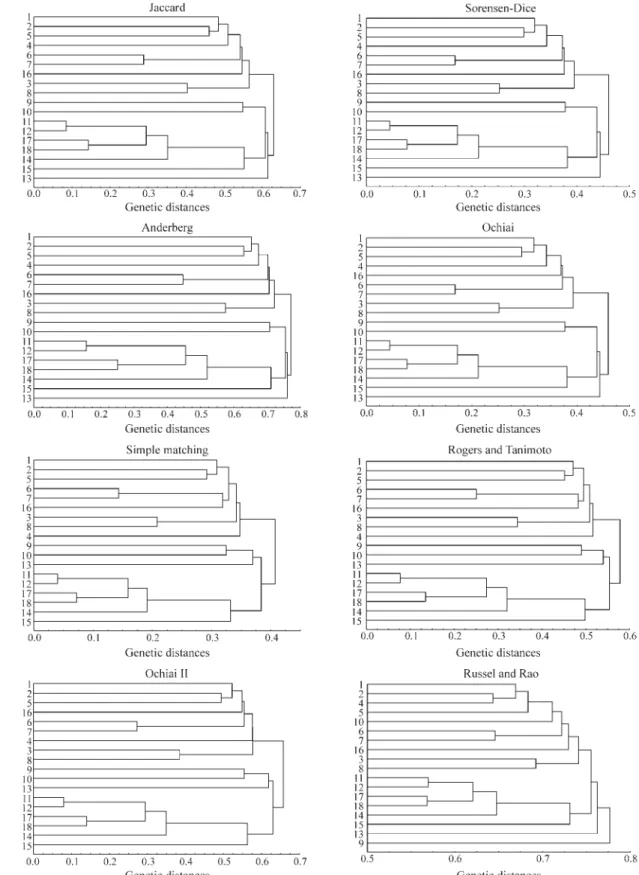
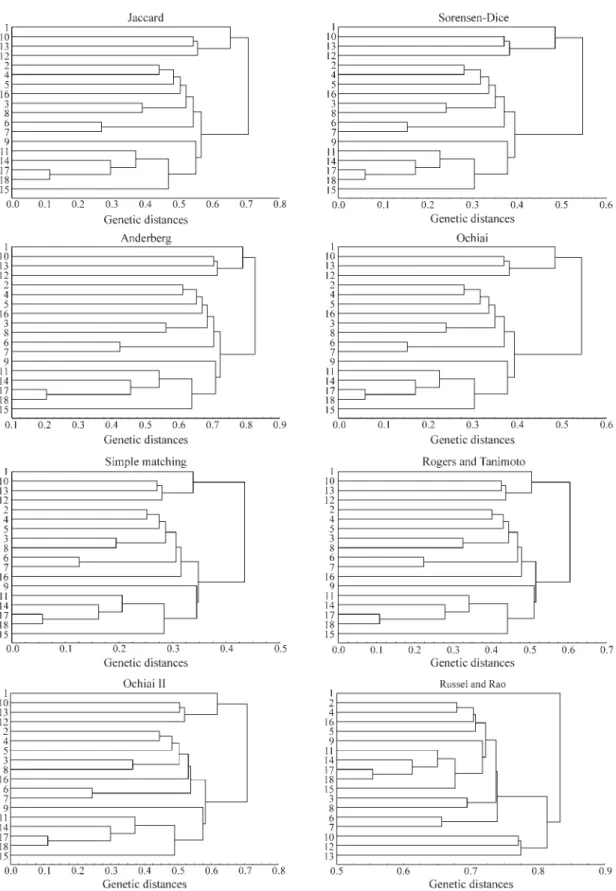
A visual inspection of the dendrograms obtained with the UPGMA method (Figures 1 and 2) shows that, except for the Russell and Rao coefficient, the dendrograms pres-ent similar clustering structures. For the dendrograms ob-tained from the AFLP marker, it was observed that they were able to separate the inbred lines of the two different populations (inbred lines 1 to 8, from BR-105; inbred lines 9 to 18; from BR-106). The exception refers to inbred line 16, originally belonging to the BR-106 population, which grouped with a higher similarity with the BR-105 popula-tion inbred lines. Recent studies, however, show that inbred line 16 is more similar to the heterotic group of BR-105 (Benchimolet al., 2000; Pintoet al., 2001; Barbosaet al., 2003; Garciaet al., 2004), confirming what was observed in the dendrograms and showing that this method of analy-sis provides the expected results. Although the general structure of the dendrograms is highly similar, it is ob-served that there are slight alterations in the levels in which lines are grouped. Nevertheless, this causes few practical problems. The greatest differences found in the den-drogram obtained for the Russel and Rao coefficient con-firm what was observed in the similarity matrices (Table 3). Although there is not an objective criteria to deter-mine the number of groups present in the dendrograms, or rather, to determine which clusters were formed, it is ob-served that, in general, cluster structures in dendrograms for the RAPD marker (Figure 2), present differences in re-lation to the structures observed in the dendrograms from the AFLP marker (Figure 1), highlighting that different marker systems influence cluster structure formation. For
Table 2- Stress (S) classification for the goodness-of-fit of the graphic projection (Kruskal, 1964).
Stress level (%) Goodness-of-fit
40 unsatisfactory
20 regular
10 good
5 excellent
0 perfect
Table 3- The Spearman correlation coefficient between the similarity coefficients for the AFLP (above the diagonal) and RAPD (below the diagonal) markers* (J: Jaccard, SD: Sorensen-Dice; A: Anderberg; O: Ochiai; SM: Simple Matching; RT: Rogers and Tanimoto; OII: Ochiai II; RR: Russel and Rao).
Coeffi-cients
J SD A O SM RT OII RR
J - 1.00 1.00 1.00 0.91 0.91 0.96 0.95
SD 1.00 - 1.00 1.00 0.91 0.91 0.96 0.95
A 1.00 1.00 - 1.00 0.91 0.91 0.96 0.95
O 1.00 1.00 1.00 - 0.91 0.91 0.96 0.95
SM 0.95 0.95 0.95 0.95 - 1.00 0.99 0.74
RT 0.95 0.95 0.95 0.95 1.00 - 0.99 0.74
OII 0.98 0.98 0.98 0.98 0.99 0.99 - 0.83
RR 0.96 0.96 0.96 0.96 0.85 0.85 0.90
RAPD, there was no clear separation of the inbred lines de-rived from the BR-105 and BR-106 populations. This could be due to the inefficiency of this marker system for this
pur-pose. These clustering structures were the same as those ob-tained by Lanzaet al.(1997) for RAPD in maize.
less, for each separate marker, all coefficients showed very similar results, except for the Russel and Rao coefficient.
It is important to highlight the fact that this type of analysis does not present an objective criterion for cluster identification, which causes some difficulty to interpret the
results. In the present situation, it was only possible be-cause the two groups were already known which does not always happens in practice.
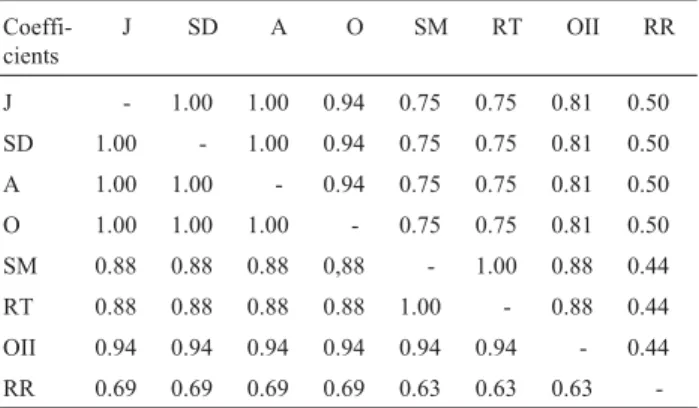
The comparison of the generated dendrograms, using the consensus fork indexCIC, allows a refining of what is observed through visual inspection (Table 4). This index ranges from 0 to 1, where the dendrograms are considered identical when theCICvalue between them is 1.
For the AFLP marker, the obtained dendrograms (UPGMA) by the Jaccard, Sorensen-Dice and Anderberg coefficients were identical (CIC= 1.00) and the same hap-pens between Simple-Matching and the Rogers and Tani-moto coefficients. Ochiai’s coefficient produces dendrograms with a more similar structure to the Jaccard, Sorensen-Dice and Anderberg coefficients (CIC = 0.94). Thus, the Jaccard, Sorensen-Dice, Anderberg and Ochiai co-efficients can be considered similar among each other. The Ochiai II coefficient produces dendrograms which are more similar to those produced by Simple-Matching and the Rog-ers and Tanimoto coefficients (CIC= 0.88). In this way, it can be said that Simple-Matching, the Rogers and Tanimoto and Ochiai II coefficients are more similar among each other than in relation to the others. The Russel and Rao coefficient presents low values of coincidences in cluster structures in relation to the remaining coefficients, reaching very low val-ues with the Simple-Matching, Rogers and Tanimoto and Ochiai II coefficients (CIC= 0.44). This confirms the fact that this coefficient produces a different dendrogram.
For the RAPD marker, the Jaccard, Sorensen-Dice, Anderberg and Ochiai coefficients present identical cluster structures (CIC= 1.00) using UPGMA. The same occurs for the Simple-Matching and Rogers and Tanimoto coeffi-cients, while the Ochiai II coefficient presents the same in-dex value (CIC= 0.94) with the other coefficients, with the exception of the Russel and Rao coefficient, which again presents low coincidence values between cluster structures (CICapproximately 0.68 with the others). Then, there were
practically the same coincidences for the AFLP marker, ex-cept for the fact that Ochiai II is not so close to Simple-Matching and the Rogers and Tanimoto coefficient.
It is verified that the obtained results with the consen-sus fork index among the dendrograms, for both markers, allow a greater detailing of what was observed with visual inspection. Thus, the Jaccard, Sorensen-Dice, Anderberg and Ochiai coefficients present tendencies to have very similar cluster structures, which also happened for Sim-ple-Matching, the Rogers and Tanimoto and Ochiai II coef-ficients. Russel and Rao’s coefficient was always different from the others. In relation to the other cluster methods, the same results as those obtained using UPGMA, were found for WPGMA and single linkage, with the two markers. For the complete linkage method, the only difference found re-fers to the Ochiai II coefficient, which was more similar to the Jaccard, Sorensen-Dice, Anderberg and Ochiai coeffi-cients, also for the two markers. In the case of the neigh-bour-joining method, the same pattern was also verified, with the exception of the Russel and Rao coefficient, which showed similar results to those obtained with the Sim-ple-Matching, Rogers and Tanimoto and Ochiai II coeffi-cients for the two markers, and for the Ochiai II coefficient, which in the RAPD marker produced similar clustering to those found with the Jaccard, Sorensen-Dice, Anderberg and Ochiai coefficients (not shown).
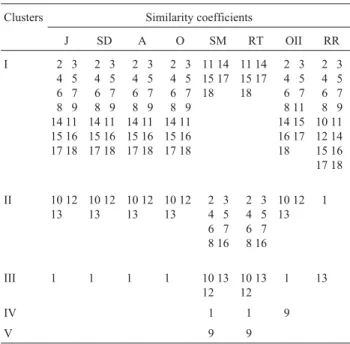
In the Tocher optimization procedure, cited by Rao (1952) (Tables 5 and 6), the number of clusters varied from 4 to 7, for the AFLP marker, and from 3 to 5, for the RAPD marker. The results of this method, using the AFLP marker, agree with those observed by the dendrograms, considering the consensus fork index,i.e., confirming that the coeffi-cients are divided into three groups. The first is formed by the Jaccard, Sorensen-Dice, Anderberg and Ochiai coeffi-cients, in which the number and structure of the formed groups was exactly the same. The second is formed by the Simple-Matching, Rogers and Tanimoto and Ochiai II co-efficients. Again, the Russel and Rao coefficient was dif-ferent from the others. For the RAPD marker, the formed groups were different from those obtained by the AFLP marker, which is explained by the different properties of these markers (Garciaet al., 2004). However, there was once again a classification of the coefficients into three cat-egories, for both markers, one made up of the Jaccard, Sorensen-Dice, Anderberg and Ochiai coefficients, and the other by the Simple-Matching, Rogers and Tanimoto and Ochiai II coefficients and finally one by the Russel and Rao coefficient. The exception was observed for the Ochiai II coefficients with the RAPD marker; however this can be explained by inherent problems of this marker (Garciaet al., 2004).
In the Tocher procedure, the inbred lines are parti-tioned into non-empty and mutually exclusive sub-groups, based on the similarity or dissimilarity matrix (Cruz and Regazzi, 1997). However, it does not necessarily form the
Table 4- Consensus fork index (CIC) among the dendrograms (UPGMA) produced by the complements of the similarity coefficients, among 18 maize lines of the BR-105 and BR-106 populations. Above the diagonal, the AFLP marker; below the diagonal, the RAPD maker (J: Jaccard, SD: Sorensen-Dice; A: Anderberg; O: Ochiai; SM: Simple Matching; RT: Rogers and Tanimoto; OII: Ochiai II; RR: Russel and Rao).
Coeffi-cients
J SD A O SM RT OII RR
J - 1.00 1.00 0.94 0.75 0.75 0.81 0.50
SD 1.00 - 1.00 0.94 0.75 0.75 0.81 0.50
A 1.00 1.00 - 0.94 0.75 0.75 0.81 0.50
O 1.00 1.00 1.00 - 0.75 0.75 0.81 0.50
SM 0.88 0.88 0.88 0,88 - 1.00 0.88 0.44
RT 0.88 0.88 0.88 0.88 1.00 - 0.88 0.44
OII 0.94 0.94 0.94 0.94 0.94 0.94 - 0.44
-same groups as the dendrograms. Nonetheless, there is no information about the similarity of the lines inside each group or about similarity among the groups. This can be considered a disadvantage of the method.
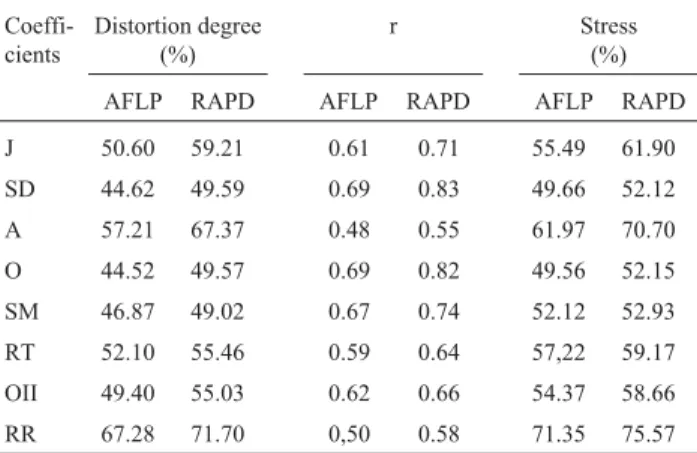
The two-dimensional projection efficiency, analyzed according to the Kruskal (1964) classification (Table 2),
showed that the stress values were unsatisfactory for all co-efficients and for both markers, suggesting, thus, that this two-dimensional projection method is not adequate for this set of data,i.e., that the projections were not efficient to rep-resent the similarity matrices (Table 7). In this way, the co-efficient comparison in this situation must be carefully made. Moreover, for both markers, the distortion degree was high and the correlations were low in all situations, confirming the latter. However, the Russel and Rao coeffi-cient notably showed worse results than the others. These results are different to those obtained by Duarte et al. (1999), in which the stress values varied from 11.4 to 32.0 (excluding the Russell and Rao coefficient). In that situa-tion, it was possible to compare the efficiency of the coeffi-cients.
Even with different marker systems and by the analy-sis with distinct theoretical baanaly-sis, some general trends were observed. The eight coefficients can be separated into three categories: the first one, made up of the Jaccard, Sorensen-Dice, Anderberg and Ochiai coefficients; the second by the Simple-Matching, Rogers and Tanimoto and Ochiai II co-efficients. The third category is only made up of Russel and Rao’s coefficient, which always showed different results from the others, except for the dendogram obtained with the neighbour-joining method, not agreeing with the biological evidence about the origin of the inbred lines. Sokal and Sneath (1963) reported that the Russel and Rao coefficient is a ‘hybrid’ coefficient, due to excluding negative co-occurrences from the numerator but not from the denomi-nator. Duarteet al.(1999) cited that it seems to be of ques-tionable usefulness.
In general, the choice between one of the coefficients inside the first or second category does not cause alterations in the analysis and in their interpretations,i.e., almost the same groups are obtained. Duarteet al.(1999) found practi-cally the same results for these seven coefficients. How-ever, this work was based on a different genetical background (common bean), with clear distinction among the groups.
It is important to note that the coefficients inside each category have common principles. The Jaccard, Sorensen-Dice, Anderberg and Ochiai coefficients do not consider the negative co-occurrences, while the Simple-Matching, Rogers and Tanimoto and Ochiai II coefficients include them in their expressions. As already mentioned, the Russel and Rao coefficient includes negative co-occurrences only in the denominator. This could possibly explain the classifi-cation of the coefficients in these three categories. Thus, it is possible to conclude that the Russel and Rao coefficients should be used only for specific situations, in which the re-searcher is really interested in using it, and has some strong justification for such a procedure. Apart from the formed clusters being different, the similarity matrix diagonal does not present values necessarily equal to 1, which should not
Table 5- Clusters of the 18 maize inbred lines of BR-105 and BR-106
populations by the Tocher optimization procedure, considering the AFLP molecular marker (J: Jaccard, SD: Sorensen-Dice; A: Anderberg; O: Ochiai; SM: Simple Matching; RT: Rogers and Tanimoto; OII: Ochiai II; RR: Russel and Rao).
Clusters Similarity coefficients
J SD A O SM RT OII RR
I 1 2
10 11 12 14 15 17 18 1 2 10 11 12 14 15 17 18 1 2 10 11 12 14 15 17 18 1 2 10 11 12 14 15 17 18 11 12 14 15 18 17 11 12 14 15 18 17 11 12 14 15 18 17 1 2 4 5 10 11 12 14 17 18
II 3 4
5 6 7 8 16 3 4 5 6 7 8 16 3 4 5 6 7 8 16 3 4 5 6 7 8 16 1 2 3 5 6 7 8 16 1 2 3 5 6 7 8 16 1 2 3 4 5 6 7 8 16 6 7
III 9 9 9 9 4 4 9 10 3 8
IV 13 13 13 13 9 10 9 10 13 9
V 13 13 13
VI 15
VII 16
Table 6- Clusters of the 18 maize inbred lines of BR-105 and BR-106
populations by the Tocher optimization procedure, considering the RAPD molecular marker (J: Jaccard, SD: Sorensen-Dice; A: Anderberg; O: Ochiai; SM: Simple Matching; RT: Rogers and Tanimoto; OII: Ochiai II; RR: Russel and Rao).
Clusters Similarity coefficients
J SD A O SM RT OII RR
I 2 3
4 5 6 7 8 9 14 11 15 16 17 18 2 3 4 5 6 7 8 9 14 11 15 16 17 18 2 3 4 5 6 7 8 9 14 11 15 16 17 18 2 3 4 5 6 7 8 9 14 11 15 16 17 18 11 14 15 17 18 11 14 15 17 18 2 3 4 5 6 7 8 11 14 15 16 17 18 2 3 4 5 6 7 8 9 10 11 12 14 15 16 17 18
II 10 12
13 10 12 13 10 12 13 10 12 13 2 3 4 5 6 7 8 16 2 3 4 5 6 7 8 16 10 12 13 1
III 1 1 1 1 10 13
12
10 13 12
1 13
IV 1 1 9
happen, as the similarity of a line with itself must be always equal to one.
Due to the coefficients with similar properties pre-senting very similar results, the choice can be based on the fact of considering or not the negative co-occurrences in the similarity measure. For the RAPD marker applied to com-mon bean cultivars, Duarteet al.(1999) found greater effi-ciency in the two-dimensional projections for the Sorensen-Dice’s coefficient, which was suggested for prac-tical applications. In the present situation, this did not oc-cur, impeding a general recommendation. Nevertheless, based on the biochemical properties of the dominant mark-ers, there is no guarantee that the DNA regions with nega-tive co-occurrences between two inbred lines are indeed identical. Thus, it seems reasonable to consider that the co-efficients that exclude it have more justification for being used. In this way, it should be possible to choose any coeffi-cient among Jaccard, Sorensen-Dice, Anderberg and Ochiai’s to obtain satisfactory results. This is coherent with the fact that the Jaccard coefficient is the one most com-monly applied in literature, possibly due to its easy inter-pretation, as it can be understood as a rate between the number of coincidences and the total number of bands, without considering the negative co-occurrences.
Acknowledgements
C.L.S. Jr. and A.P.S. received fellowships from CNPq. A.S.M. received post-graduate fellowship from CAPES.
References
Anderberg MR (1973) Clustering analysis for applications. Lon-don, Academic Press, 359 pp.
Barbosa AMM, Geraldi IO, Benchimol LL, Garcia AAF, Souza Jr CL and Souza AP (2003) Relationship of intra- and
inter-population tropical maize single cross hybrid performance and genetic distances computed from AFLP and SSR mark-ers. Euphytica 130:87-99.
Benchimol LL, Souza Jr. CL, Garcia AAF, Kono PMS, Mangolin CA, Barbosa AMM, Coelho ASG and Souza AP (2000) Ge-netic diversity in tropical maize inbred lines: heterotic group assignment and hybrid performance determined by RFLP markers. Plant Breeding 119:491-496.
Cruz CD and Viana JMS (1994) A Methodology of genetic diver-gence analysis based on sample unit projection on two-dimensional space. Revista Brasileira de Genética 17:69-73. Cruz CD and Regazzi AJ (1997) Modelos biométricos aplicados
ao melhoramento genético. Universidade Federal de Viçosa, Viçosa, 390 pp.
Cruz CD (2001) Programa Genes: versão Windows; aplicativo computacional em genética e estatística. Universidade Fede-ral de Viçosa, Viçosa, 648 pp.
Dice LR (1945) Measures of the amount of ecologic association between species. Ecology 26:297-302.
Duarte MC, Santos JB and Melo LC (1999) Comparison of simi-larity coefficients based on RAPD markers in the common bean. Genetics and Molecular Biology 22:427-432. Garcia AAF, Benchimol LL, Barbosa AMM, Geraldi IO, Souza
Jr. CL and Souza AP (2004) Comparison of RAPD, RFLP, AFLP and SSR markers for diversity studies in tropical maize inbred lines. Genetics and Molecular Biology (sub-mitted).
Hollander M (1973) Nonparametric statistical methods. New York, Wiley, 503 pp.
Jaccard P (1901) Étude comparative de la distribuition florale dans une portion des Alpes et des Jura. Bull Soc Vandoise Sci Nat 37:547-579.
Jackson AA, Somers KM and Harvey HH (1989) Similarity coef-ficients: measures for co-occurrence and association or sim-ply measures of occurrence? American Naturalist 133:436-453.
Johnson RA and Wichern DW (1988) Applied multivariate statis-tical analysis. New Jersey, Prentice-Hall, 607 pp.
Kruskal JB (1964) Multidimensional scaling by optimizing good-ness of fit to a nom-metric hypothesis. Psychometrika 29:1-27.
Lanza LLB, Souza Jr. CL, Ottoboni LMM, Vieira MLC and Souza AP (1997) Genetic distance of inbred lines and pre-diction of maize single-cross performace using RAPD mark-ers. Theoretical and Genetics Journal 94:1023-1030. Ochiai A (1957) Zoogeographic studies on the soleoid fishes
found in Japan and its neighbouring regions. Bull Jnp Soc Sci Fish 22:526-530.
Pinto RMC, Garcia AAF and Souza Jr. CL (2001) Alocação de linhagens de milho derivadas das populações BR - 105 e BR - 106 em grupos heteróticos. Scientia Agricola 3:541-548. Rao RC (1952) Advanced statistical methods in biometric reserch.
New York, J. Wiley, 390 pp.
Rogers JS and Tanimoto TT (1960) A computer program for classying plants. Science 132:1115-1118.
Rohlf FJ (1982) Consensus indices for comparing classifications. Mathematical Bioscience 59:131-144.
Rohlf FJ (1992) Program Numerical taxonomy and multivariate analysis system. Version 1.70, New York.
Table 7 - Distortion degree, correlation between the original and
estimated distances (r) and stress value, obtained by the projection of the distances in the two-dimensional spaces. AFLP and RAPD molecular markers (J: Jaccard, SD: Sorensen-Dice; A: Anderberg; O: Ochiai; SM: Simple Matching; RT: Rogers and Tanimoto; OII: Ochiai II; RR: Russel and Rao).
Coeffi-cients
Distortion degree (%)
r Stress
(%)
AFLP RAPD AFLP RAPD AFLP RAPD
J 50.60 59.21 0.61 0.71 55.49 61.90
SD 44.62 49.59 0.69 0.83 49.66 52.12
A 57.21 67.37 0.48 0.55 61.97 70.70
O 44.52 49.57 0.69 0.82 49.56 52.15
SM 46.87 49.02 0.67 0.74 52.12 52.93
RT 52.10 55.46 0.59 0.64 57,22 59.17
OII 49.40 55.03 0.62 0.66 54.37 58.66
Russel PF and Rao TR (1940) On habitat and association of spe-cies of anophelinae larvae in south-eastern Madras. J Ma-laria Inst India 3:153-178.
Sas Institute Inc. (1992) Statistical analysis system. Release 6.08, Cary, NC.
Skroch P, Tivang J and Nienhuis J (1992) Analysis of genetic rela-tionships using RAPD marker data. In: Applications of
RAPD technology to plant breeding. Symposia series, Madi-son, CCSA, ASHS, and AGMA, Minneapolis, pp 26-30. Sneath PHA and Sokal RR (1973) Numeric taxonomy: the
princi-ples and practice of numerical classification. W.H. Freeman, San Francisco, 573 pp.
Sokal RR and Michener CD (1958) A statistical method for evalu-ating systematic relationships. Univ Kans Sci Bull 38:1409-1438.
Sokal RR and Sneath PHA (1963) Principles of numeric taxon-omy. W.H. Freeman, San Francisco, 359 pp.
Sorensen T (1948) A method of establishing groups of equal am-plitude in plant sociology based on similarity of species
con-tent and its application to analyses of the vegetation on Danish commons. Vidensk Selsk Biol Skr 5:1-34.
Statistica Stat Soft Inc. ‘99 Edition (1999) - Quick reference. Tulsa, OK, USA.
Victória DC, Garcia AAF, Souza Jr. CL and Souza AP (2001) Desenvolvimento de um programa SAS para cálculo de coeficiente de similaridade de dados de marcadores molecu-lares utilizando bootstrap. (compact disc) Congresso Nacio-nal de Genética 47, Águas de Lindóia.
Vos P, Rogers R, Bleeker M, Reijans M, Van de Lee T, Hornes M, Frijters A, Pot J, Peleman J, Kuipe M and Zabeau M (1995) AFLP: a new tecnique for DNA fingerprinting. Nucleic Acids Research 23:4407-4414.
Weir BS (1996) Genetic data analysis II. Mass, Sinuar Associates. 445 pp.
Willians JGK, Kubelik AR, Livak KJ, Rafalski JA and Tingey SV (1990) DNA polimorfisms amplified by arbitrary primers are useful as genetic markers. Nucleic Acids Research 18:7213-7218.