Aerofoils
Mohammed ABDUL AKBAR*
,1,a, V. MUSTAFA
1,b*Corresponding author
1Department of Civil Engineering, National Institute of Technology Calicut, NIT
Campus (P.O), Calicut, Kerala-673 601, India
[email protected]*, [email protected]
DOI: 10.13111/2066-8201.2015.7.3.1
Received: 05 June 2015 / Accepted: 13 July 2015
Copyright©2015 Published by INCAS. This is an open access article under the CC BY-NC-ND license (http://creativecommons.org/licenses/by-nc-nd/4.0/)
Abstract: Renewable sources of energy are attractive and advantageous in a lot of different ways. Among the renewable energy sources, wind energy is the fastest growing type. Among wind energy converters, Vertical axis wind turbines (VAWTs) have received renewed interest in the past decade due to some of the advantages they possess over their horizontal axis counterparts. VAWTs have evolved into complex 3-D shapes. A key component in predicting the output of VAWTs through analytical studies is obtaining the values of lift and drag coefficients which is a function of shape of the aerofoil, ‘angle of attack’of wind and Reynolds’s number of flow. Sandia National Laboratories have carried out extensive experiments on aerofoils for the Reynolds number in the range of those experienced by VAWTs. The volume of experimental data thus obtained is huge. The current paper discusses three Regression analysis models developed wherein lift and drag coefficients can be found out using simple formula without having to deal with the bulk of the data. Drag coefficients and Lift coefficients were being successfully estimated by regression models with R2 values as high as 0.98.
Key Words: Green Energy, Wind Energy, Regression Model, Vertical Axis Wind Turbine
I. INTRODUCTION
Vertical Axis Wind Turbines (VAWTs) have been receiving renewed interest during the past decade, primarily due to their ability to get easily integrated in to the urban environment.
Companies are emerging globally that manufacture VAWTs for installation into easily bendable areas like roof tops, landmark spots, building facades, etc. There is a dearth of analytical models that can accurately predict the performance of VAWTs.
A good summary of the analytical models developed in the past has been explained in [5]. An important aerodynamic characteristic that is inevitable in all these models is the lift and drag coefficient for the aerofoil. These coefficients depend on the Reynolds number of flow, angle of attack of the wind and shape of the aerofoil.
National Advisory Committee on Aeronautics (NACA) has carried out extensive experiments on these force coefficients and has documented them for 78 aerofoil shapes they were experimenting [2]. However, as the study was aimed at the aircraft industry, the
aResearch Scholar
b
Reynolds number of flow for which the experiments were conducted was higher than that experienced by VAWTs. Identifying the void on data for VAWTs, Sandia national laboratories carried out experiments on 7 symmetrical NACA aerofoil shapes and have documented the results [7].
Although, the study is old, the results of the report have been universally accepted and referenced even nowadays[1, 4, 6].
Fig. 1 NACA symmetrical aerofoil
Out of the seven symmetrical aerofoils considered in the Sandia national laboratories report [7], complete tables have been provided for five of them,namely NACA 0012, NACA 0015, NACA 0018, NACA 0021 and NACA 0025 for the entire range of anglesof attack (0 to 180 degrees) and Reynolds numbers in the range of 10,000 to 1,00,00,000. The shape of NACA symmetrical aerofoils are plotted in fig. 1.
The resulting tables amount up to a total of 2878 values of lift and drag coefficients for different combinations of Reynolds number, angle of attack & shape of aerofoil. This is a large set of data.
In addition, for purposes of developing algorithms for the analysis of a general 3-D shaped VAWT, these data in the form of equations (as a function of Reynolds number, angle of attack & aerofoil. shape) are needed as they simplify the task.
This paper discusses the regression analysis carried out on the lift and drag values using three methods, namely: Trigonometric fit, Quadrilateral fit & Cubic fit.
The coefficient of determination (R2), which is a measure of goodness of the regression fit, is reported for each case which gives an indication of the level of confidence that can be placed on the resulting equations.
Section II of this paper deals with the analysis part, section III deals with the results of the analysis and its interpretation and section IV is the conclusion.
II. REGRESSION ANALYSIS
To understand the nature of lift and drag values reported in Sandia report [7], they were plotted on a graph for interpretation of the trend.
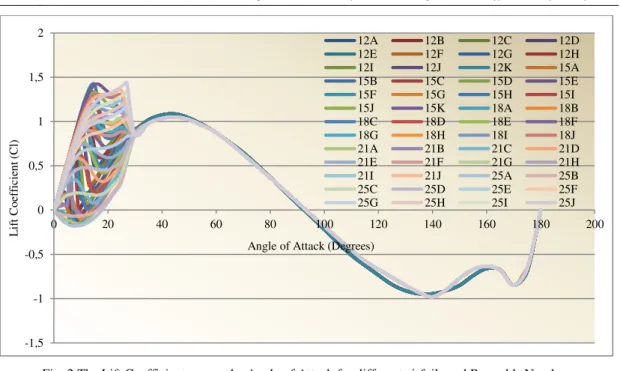
The plot of thelift coefficient versus the angle of attack is shown in fig. 2 and the plot of the drag coefficient versus the angle of attack is shown in fig. 3. A legend summary for the plots is given in Table 1.
-0,13
-0,08
-0,03
0,02
0,07
0,12
0,17
0,0
0,2
0,4
0,6
0,8
1,0
Fig. 2 TheLift Coefficient versus theAngle of Attack for different airfoils and Reynolds Numbers
Fig. 3 The Drag Coefficient versus the Angle of Attack for different airfoils and Reynolds Numbers Table 1: Legend summary for interpretation of graphs
Aerofoil Shape Reynolds Number 12 NACA 0012 A 10000 15 NACA 0015 B 20000 18 NACA 0018 C 40000 21 NACA 0021 D 80000 25 NACA 0025 E 160000
-1,5 -1 -0,5 0 0,5 1 1,5 2
0 20 40 60 80 100 120 140 160 180 200
L if t C o ef fi ci en t (C l)
Angle of Attack (Degrees)
12A 12B 12C 12D
12E 12F 12G 12H
12I 12J 12K 15A
15B 15C 15D 15E
15F 15G 15H 15I
15J 15K 18A 18B
18C 18D 18E 18F
18G 18H 18I 18J
21A 21B 21C 21D
21E 21F 21G 21H
21I 21J 25A 25B
25C 25D 25E 25F
25G 25H 25I 25J
0 0,2 0,4 0,6 0,8 1 1,2 1,4 1,6 1,8 2
0 20 40 60 80 100 120 140 160 180 200
D ra g c o ef fi ci en t (C d )
Angle of Attack (Degrees)
12A 12B 12C
12D 12E 12F
12G 12H 12I
12J 12K 15A
15B 15C 15D
15E 15F 15G
15H 15I 15J
15K 18A 18B
18C 18D 18E
18F 18G 18H
18I 18J 21A
21B 21C 21D
21E 21F 21G
21H 21I 21J
25A 25B 25C
25D 25E 25F
25G 25H 25I
Example: "18F" denotes analysis for the case where the
shape is NACA 0018 and the Reynolds Number is 360000
F 360000 G 700000 H 1000000
I 2000000 J 5000000 K 10000000
From fig. 2 and fig. 3, it can be clearly seen that beyond 30 degrees, there is no effect of Reynolds number and aerofoil shape on lift and drag coefficients.
For the values of lift and drag coefficients for an angle of attack less than 300, there is a function of all the three variables, namely the shape of the aerofoil, the Reynolds Number and the Angle of Attack.
Further from fig. 2 and fig. 3, we can see that there is a distinctive angle of attack above which the lift to drag ratio decreases. This point is known as “Stall” [3] and it finds application in all areas of fluid dynamics.
Based on the above revelations; for the purposes of regression analysis, the lift and drag coefficient data were divided into four zones.
Zone 1 - Coefficients up to the value of Stall
Zone 2 - Coefficients at the value of Stall
Zone 3 - Coefficients beyond the value of Stall and up to 300
Zone 4 - Coefficients equal to and beyond 300
Three methods were used for the regression analysis and the findings of each were compared. A description of these methods will be given in the following sub-section. They are as follows:
Quadratic polynomial fit
Cubic polynomial fit
Trigonometric fit
Quadratic polynomial fit
In this method, Zone 4 which is dependent only upon α, was approximated by a quadratic polynomial and resulting values of R2 and coefficients of polynomial were noted down.
For the remaining three zones (1, 2 & 3), the lift and drag coefficients were fitted with linear regression models with independent variables as Reynolds number, angle of attack & aerofoil shape.
Through trial and error, it was found that taking logarithm of Reynolds number yielded better results than using Reynolds number alone as the variable. This was found to be true for all the regression fits in this study and hence logarithm of Reynolds number was used wherever Reynolds number variable appeared.
Further, it may be noted that the shape of the aerofoil, namely NACA 0012, NACA 0015, NACA 0018, NACA 0021 and NACA 0025 are not continuous values as desired by a regression analysis fit, However, upon using values of 12, 15, 18, 21 and 25 respectively for the aerofoilsmentioned above, it was found out that a good fit was achieved.
Cubic polynomial fit
Trigonometric fit
Upon close examination of the graphs of lift and drag coefficients beyond 300, it was seen that in addition for them being independent of Reynolds number and shape of aerofoil, they approximately resembled the trigonometric curves of sin and cos. The graph of the drag coefficient approximately resembles the sine curve and the graph of the lift coefficient resembles the cosine curve.
Hence, the lift coefficients values for Zone 4 were subjected to linear regression with
cosine of the α values and drag coefficients for Zone 4 with sine of α.
Reasonably good fit was obtained (the details of the fit to be presented in section IV) and thus included in this study.
With the values of regression coefficients obtained by Zone 4 analyses, the values of the lift and drag coefficients for other zones (zone 1, 2 & 3) were estimated.
Understandably, the values in these zones were giving poor estimates (as they are functions of all the three variables).
However, it was found out that the difference in the actual values of the lift and drag coefficients (in these zones) and that estimated by the trigonometric functions in these zones were giving reasonably good fit when resorted to simple linear regression analysis using the three variables (α, Reynolds number & aerofoil shape).
The rest of the analysis was the same as what was done for the quadratic and cubic polynomial fits.
If Loop
An IF loop was built for the data set that would identify the zone to which the combination of Reynolds number, angle of attack and aerofoil shape belongs to (Table 2). The
Calculation of stall angle (αs) precedes this step and is carried out for each set of Reynolds
number & aerofoil shape based on regression analysis coefficients and then rounded off to the nearest whole number (to enable the IF loop comparison).
Table 2: Logical sequence of the IF loop
“AND” Conditions Zone α < αs α< 30
0
Zone 1
α = αs α< 30 0
Zone 2
α > αs α< 30 0
Zone 3
α > αs α = 30
0OR α >
300 Zone 4
III. RESULTS & DISCUSSIONS
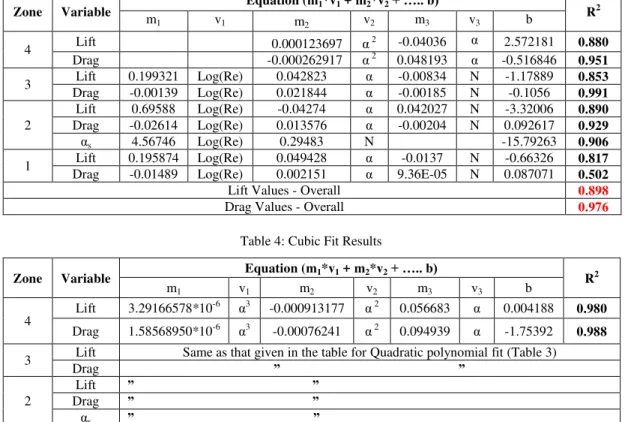
The results of the regression analysis are presented in Table 3, 4 & 5. Table 3 is for the quadratic polynomial fit, Table 4 is for the cubic polynomial fit and Table 5 is for the trigonometric fit.
The symbols used in the Tables are,
α = Angle of attack αs = Angle of stall
Table 3: Quadratic Fit Results
Zone Variable Equation (m1*v1 + m2*v2+ ….. b) R2
m1 v1 m2 v2 m3 v3 b
4 Lift 0.000123697 α
2 -0.04036 α 2.572181 0.880
Drag -0.000262917 α 2 0.048193 α -0.516846
0.951
3 Lift 0.199321 Log(Re) 0.042823 α -0.00834 N -1.17889 0.853 Drag -0.00139 Log(Re) 0.021844 α -0.00185 N -0.1056 0.991 2
Lift 0.69588 Log(Re) -0.04274 α 0.042027 N -3.32006 0.890 Drag -0.02614 Log(Re) 0.013576 α -0.00204 N 0.092617 0.929 αs 4.56746 Log(Re) 0.29483 N -15.79263 0.906
1 Lift 0.195874 Log(Re) 0.049428 α -0.0137 N -0.66326 0.817 Drag -0.01489 Log(Re) 0.002151 α 9.36E-05 N 0.087071 0.502
Lift Values - Overall 0.898
Drag Values - Overall 0.976
Table 4: Cubic Fit Results
Zone Variable Equation (m1*v1 + m2*v2+ ….. b) R2
m1 v1 m2 v2 m3 v3 b
4
Lift 3.29166578*10-6 α3 -0.000913177 α 2 0.056683 α 0.004188
0.980
Drag 1.58568950*10-6 α3 -0.00076241 α 2 0.094939 α -1.75392
0.988
3 Lift Same as that given in the table for Quadratic polynomial fit (Table 3) Drag ” ”
2
Lift ” ” Drag ” ” αs ” ”
1 Lift ” ” Drag ” ”
Lift Values - Overall 0.962
Drag Values - Overall 0.991
Table 5: Trigonometric Fit Results
Zone Variable Equation (m1*v1 + m2*v2+ ….. b) R2
m1 v1 m2 v2 m3 v3 b
4 Lift 1.07718 Cos(α) 0.14734 0.877
Drag 2.001954 Sin(α) -0.2773 0.972
Regression analysis on Force coefficients of Zone 1, 2 & 3 after taking the difference of that estimated by trigonometric functions
3 Lift 0.198799 Log(Re) 0.048797 α -0.00858 N -2.44796 0.871 Drag -0.00172 Log(Re) -0.01118 α -0.002 N 0.15377 0.954 2
Lift 0.698349 Log(Re) -0.03894 α 0.041895 N -4.57436 0.896 Drag -0.0251 Log(Re) -0.02058 α -0.00209 N 0.360303 0.991 αs 4.56746 Log(Re) 0.29483 N -15.79263 0.906
1 Lift 0.195406 Log(Re) 0.052953 α -0.01343 N -1.90187 0.837 Drag -0.01522 Log(Re) -0.03197 α 0.000201 N 0.360509 0.993
Lift Values - Overall 0.897
Drag Values - Overall 0.984
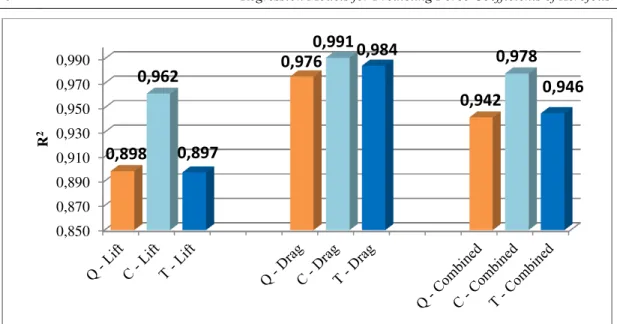
Fig. 4 R2 for lift &drag coefficients (Q – Quadratic, C – Cubic & T – Trigonometric)
As clearly evident from the chart, the cubic polynomial gives a better approximation overall when compared with the other two methods. The quadratic & trigonometric approximations for drag case are almost as good as that estimated by the cubic polynomial.
However, the approximation of the lift coefficient by both methods lags far behind than the approximation obtained by the cubic polynomial method resulting in a reduction in the combined case approximation.
In this study, Zone 4 approximations using quadratic & cubic polynomials were only presented as higher order polynomials; they did not present a significant improvement in goodness of fit.
The R2 values for the fourth, fifth & sixth order polynomial were 0.981, 0.981 & 0.982 respectively which were not significantly higher than that obtained with the cubic polynomial case (0.978).
IV. CONCLUSIONS
The lift & drag coefficients for five symmetrical aerofoils. established experimentally have been fitted with equations using the regression analysis by three methods namely quadrilateral fit, cubic fit &trigonometric fit and their R2 values were found to be 0.942, 0.978 & 0.946 respectively. As in regression analysis any fit which gives an R2 value of 0.95 and above is considered excellent; the cubic fit which is the best of the three and quadrilateral and trigonometric fits which are bordering 0.95 can be considered suitable for the purpose of implementation in algorithms.
REFERENCES
[1] A. Goude and F. Bülow, Robust VAWT control system evaluation by coupled aerodynamic and electrical simulations, Renewable Energy, 59, 193-201, 2013.
[2] E. N. Jacobs, K. E. Ward, and R. M. Pinkerton, The Characteristics of 78 Related Airfoil Sections from Tests in the Variable-Density Wind Tunnel, National Advisory Committee for Aeronautics, Report No. 460 1935.
0,850 0,870 0,890 0,910 0,930 0,950 0,970 0,990
0,898
0,962
0,897
0,976
0,991
0,984
0,942
0,978
0,946
R
[3] E. Hau, Wind Turbine: Fundamentals, Technologies, Application, Economics, ISBN 978-3-540-29284-5, 2nd Edition, Published by SPRINGER (SIE), New Delhi, 2008, ISBN 10: 8181288815/ ISBN 13: 9788181288813, Springer International Edition.
[4] G. Bedon, M. R. Castelli and E. Benini, Optimization of a Darrieus vertical-axis wind turbine using blade element – momentum theory and evolutionary algorithm, Renewable Energy, 59, issue C, 184-192, 2013. [5] M. Islam, D. S.-K. Ting and A. Fartaj, Aerodynamic models for Darrieus-type straight-bladed vertical axis
wind turbines, Renewable and Sustainable Energy Reviews, 12:4, 1087-109, 2008.
[6] R. A. McAdam, G. T. Houlsby and M. L. G. Oldfield, Experimental measurements of the hydrodynamic performance and structural loading of the Transverse Horizontal Axis Water Turbine: Part 1. Renewable
Energy, 59, 105-114, 2013, ISSN 0960-1481, 10.1016/j.renene.2013.03.016.
(http://www.sciencedirect.com/science/article/pii/S0960148113001729).