Chromosomal organization and phylogenetic relationships in
Hypochaeris
species (Asteraceae) from Brazil
Claudete de Fátima Ruas
1, André L.L. Vanzela
1, Melissa O. Santos
1, Jeferson N. Fregonezi
1,
Paulo Maurício Ruas
1, Nelson I. Matzenbacher
3and Margarida L.R. de Aguiar-Perecin
2 1Universidade Estadual de Londrina, Departamento de Biologia Geral, Londrina, PR, Brazil.
2Escola Superior de Agricultura Luiz de Queiroz, Departamento de Genética, Piracicaba, SP, Brazil.
3
Universidade Federal do Rio Grande do Sul, Departamento de Genética, Porto Alegre, RS, Brazil.
Abstract
The association of cytogenetic and molecular techniques has contributed to the analysis of chromosome organization and phylogeny in plants. The fluorochrome GC-specific CMA3, fluorescent in situ hybridization (FISH) and RAPD (Random Amplified Polymorphic DNA) markers were used to investigate chromosome structure and genetic relationships in Hypochaeris (Asteraceae). Seven species native to South America, and two species introduced from Europe (H. glabra and Hypochaeris sp) were studied. FISH with rDNA probes identified one or two loci of 18S-5.8S-25S rDNA in the South AmericanHypochaeris species and one locus in the European species. Only one 5S rDNA locus was seen in all species studied. Blocks of GC-rich heterochromatin (CMA-positive bands) associated to 18S-5.8S-25SrDNA loci were detected in all species investigated. Co-location of 5S rDNA and CMA bands was also observed, except for three South American species andHypochaeris sp. In two South American species, additional CMA bands not related to rDNA were observed on the long arm of chromosome 2, near to the centromere.Hypochaeris glabra exhibited additional CMA-positive signals distributed at pericentromeric regions, on the short arms of all chromosomes. A total of 122 RAPD markers were used to determine the genetic relationships among species. The level of polymorphism was very high, revealing two genetic groups comprising the South American and the European species, thus supporting a previous hypothesis of monophyly of the South American Hypochaeris species. The coefficients of genetic similarity between European and South American species were 0.35, on average. Polymorphism was also high within the two groups. The genetic associations observed with RAPD markers were consistent with chromosome characteristics. Species carrying similar distribution of 45S rDNA loci and CMA-positive signals were included in the same group revealed by RAPDs. Cytogenetic and molecular data support the view that not only chromosome rearrangements, but also changes in DNA sequence took place during the diversification of the South AmericanHypochaeris species.
Key words:chromosome banding, FISH,Hypochaeris, phylogenetic relationship, RAPD. Received: October 3, 2003; Accepted: August 16, 2004.
Introduction
The genusHypochaeris(Asteraceae) is represented
by around 60 species occurring in two major areas of distri-bution, comprising the Mediterranean region and South America. While the Mediterranean group includes about 13 species, the South American species are more numerous with around 50 species (Stuessy, 2001). Species relation-ships within the genus have been investigated in several studies. Stebbins (1971) suggested, on the basis of distinct chromosome characterists, that the Mediterranean was the primary center of origin and that South America represents the center of diversification of the genus. Cytogenetic
stud-ies have shown a basic chromosome number of x = 3, 4, 5 and 6 associated with symmetric karyotypes that character-izes the European Hypochaeris species (Stebbins, 1971; Cerbahet al., 1995, 1998a; Ruaset al., 1995). On the other hand, the South American species have a basic chromo-some number of x = 4 and highly asymmetric and bimodal karyotypes (Stebbins, 1971; Barghiet al., 1989; Ruaset al.,
1995). According to Stebbins (1971), asymmetric karyo-types would have originated through changes occurred in less complex chromosome sets, thus, the South American
Hypochaerisspecies would have derived from European
species (Siljak-Yakovlev, 1994; Cerbah et al., 1995, 1998a; Ruaset al., 1995).
Differences on chromosome size and satellite distri-bution have been observed among Hypochaeris species www.sbg.org.br
Send correspondence to Claudete de Fátima Ruas. Universidade Estadual de Londrina, Departamento de Biologia Geral, 86051-990 Londrina, PR, Brazil. E-mail: ruas@sercomtel.com.br.
(Ruas et al., 1995; Cerbah et al., 1995, Cerbah et al.,
1998a). Analyses of DNA content revealed a C-value vary-ing from 1.68 to 8.10 pg and, with few exceptions, there was no significant correlation between AT or GC content, suggesting that variability in genome sizes is a conse-quence of differences in the content of interspersed repeti-tive DNA sequences (Cerbahet al., 1995, 1999).
Recently, fluorescent in situ hybridization (FISH) has been the method of choice for assigning DNA sequences to chromosomes. The technique is specially appropriated to understand the chromosomal organization and to determine the physical distribution of specific DNA sequences on the chromosomes (Heslop-Harrison, 2000). Differences in number and distribution of 45S and 5S rDNA loci among related species have proven to be suitable to study genome evolution and species relationships in plants such as
Calycadenia (Baldwin, 1993), Hordeum (Leitch and
Heslop-Harrison, 1993), Aegilops (Castilho and
Heslop-Harrison, 1995),Vigna(Galassoet al., 1998) and Clivia(Ranet al., 2001). Application of FISH to determine
the distribution of 45S and 5S rDNA loci onHypochaeris
chromosomes, combined with fluorochrome banding, sug-gested that chromosome rearrangments such centric shifts and centric fusions, transposition, and inactivation of rDNA have occurred during the evolution of European and South American species of Hypochaeris (Cerbah et al.,
1998a). These rearrangements were also concluded to be implicated in the reduction of rDNA loci in the genus.
Major advances on molecular techniques have per-mitted a better understanding of genome structure in An-giosperms. Recently, molecular systematic analysis has been used for phylogenetic studies within the genus
Hypochaeris(Cerbahet al., 1999; Samuelet al., 1999).
Se-quence analyses of nuclear ITS regions and chloroplast trnL-F intron, trnL/trnF spacer and matK sequences, car-ried out to assess phylogenetic relationships among Euro-pean and South American species ofHypochaeris, revealed
that, except forH. Robertia, the clades formed by the ITS
and the combined trees agree with sections previously stablished for the genus on the basis of morphological and cytological studies (Cerbah et al., 1999; Samuel et al.,
1999, 2003). These observations provided evidence for monophyly of the South American species, which would have evolved from a single introduction of European pro-genitors rather than fromH. robertia, as previously
sug-gested (Barghiet al., 1989).
Among the different classes of molecular markers ap-plied to assess genetic variation and taxonomic relatedness between plant groups, random amplified polymorphic DNA (RAPD) (Wesh and McClelland, 1990; Williamset al., 1990) has proved to be particularly appropriated. The
technique is based on DNA amplification using 10-mer oligonucleotides in a PCR (Polymerase Chain Reaction). It produces a large number of easily generated markers with-out the need of previous knowledge of the genome. The
success of RAPD markers for taxonomic and evolutionary studies has been observed in several plant species such as
Stylosanthes(Kazanet al., 1993), Malus (Dunemannet al.,
1994),Actinidia(Ciprianiet al., 1996),Pisum(Hoeyet al.,
1996),Vigna(Santalaet al., 1998) andAnanas(Ruaset al.,
2001).
Considering the need for more studies on the Brazil-ian group of South American Hypochaeris species, the
present work associated chromosome analysis, using FISH with 45S and 5S rDNA probes and fluorochrome banding, with RAPD makers to evaluate the interspecific relation-ships between seven Brazilian and two introduced Euro-pean species of Hypochaeris. The phylogenetic schema
was compared with the mechanisms proposed for chromo-some evolution in the genus. Moreover, the karyotype ofH. grisebashiiis described here for the first time.
Materials and Methods
The specimens studied include seven species native to the Brazilian flora of the South AmericanHypochaeris
and one species (H. glabra) introduced from Europe. An
additional species (Hypochaerissp) was also studied. Plant
material used for the analysis ofHypochaerissp was
ob-tained from cypselae collected from plants of a population ofH. radicatafor which no karyotype analysis was
avail-able. Information about the origin of the species is summa-rized in Table 1. Voucher-specimens are preserved in the Herbarium of the Botanic Department of the Universidade Federal do Rio Grande do Sul (ICN), Porto Alegre, Rio Grande do Sul, Brazil.
Chromosome preparations
Root-tip meristems obtained from potted plants were pre-treated with 0.1% colchicine at room temperature for 1 h
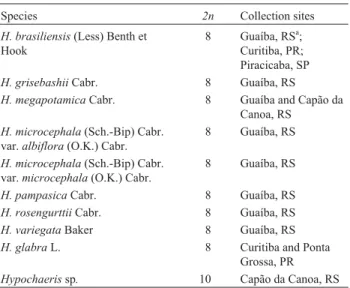
Table 1- Chromosome numbers and collection sites of Hypochaeris
species investigated.
Species 2n Collection sites
H. brasiliensis(Less) Benth et Hook
8 Guaíba, RSa; Curitiba, PR; Piracicaba, SP
H. grisebashiiCabr. 8 Guaíba, RS H. megapotamicaCabr. 8 Guaíba and Capão da
Canoa, RS
H. microcephala(Sch.-Bip) Cabr. var.albiflora(O.K.) Cabr.
8 Guaíba, RS
H. microcephala(Sch.-Bip) Cabr.
var.microcephala(O.K.) Cabr.
8 Guaíba, RS
H. pampasicaCabr. 8 Guaíba, RS
H. rosengurttiiCabr. 8 Guaíba, RS
H. variegataBaker 8 Guaíba, RS
H. glabraL. 8 Curitiba and Ponta Grossa, PR
Hypochaerissp. 10 Capão da Canoa, RS aThe abbreviations following collection sites correspond to Brazilian
and 30 min and then fixed in ethanol-acetic acid 3:1 for at least 12 h. Chromosome identification was carried out for
Hypocherissp and for H. grisebashii, using the Feulgen
stain-ing method, as previously described by Ruaset al. (1995).
Chromosome preparations for FISH and chromomy-cin A3banding were obtained as described by Schwarzacher
et al. (1980). Briefly, pre-treated root-tips were washed
twice in citrate buffer (0.01 M citric acid-sodium citrate, pH 4.6) and macerated in enzyme solution (2% cellulase (w/v) and 20% pectinase (v/v) at 37 °C for 2 h. After enzymatic treatment, the roots were washed in citrate buffer and the cells were dissociated in a drop of 45 % acetic acid.
In situhybridization
The ribosomal probes pTa71 and pTa794, isolated fromT. aestivum(Gerlach and Bedbrook, 1979; Gerlach and Dyer, 1980) were used to locate the position of the 45S and 5S rDNA sites on the chromosomes. The probes were labeled with biotin-14-dATP by nick translation (Bio Nick, Gibco). FISH was carried out following the methods of Heslop-Harrissonet al. (1991) and Cuadrado and Jouve (1994) with minor modifications. The slides were incu-bated in 100µg/mL DNase-free RNase in 2x SSC (0.03 M
sodium citrate and 0.3 M sodium chloride) for 1 h at 37 °C, washed for 5 min in each 2x SSC plus 4% paraformal-dehyde and 2x SSC, dehydrated through an ethanol series, and air- dried. The labeled rDNA probes (100-200 ng/slide) were mixed with 50% formamide, 10% (w/v) polyethyl-enoglycol, 0.3% (w/v) sodium dodecyl sulfate, 300 mg/mL calf thymus DNA, and 2x SSC. The hybridization mixture was denatured at 70 °C for 10 min and immediately chilled on ice. Then the slides were loaded with 30µL of probe
mixture, denatured at 90 °C for 10 min, transferred to 50 °C for 10 min and to 38 °C for 10 min. Hybridization was per-formed overnight at 37 °C in a moist chamber. Post-hybridization washes were done as described by Cuadrado and Jouve (1994). The hybridization sites were detected with avidin-FITC conjugate (5µL/mg/mL) in 5% bovine
serum albumin (BSA) at 37 °C for 1 h. Chromosomes prep-arations were counterstained with 1 µL (2.5 µL/mL)
propidium iodide for 30 min, mounted in 20µL of antifade
solution (Vectashield H1000, Vector Laboratories). Prepa-rations were examined with a Nikon Labophot microscope and photographed on Kodak 400 Proimage film.
Chromomycin A3banding
Chromosome preparations aged for three days were incubated in 45% acetic acid at 60 °C for 10 min, washed in double-distilled water and treated with 5% Ba(OH)2 for
5 min at room temperature. Preparations were then incu-bated in 2x SSC at 60 °C for 1 h and 20 min, washed in dou-ble-distilled water, and air-dried. Three-day-old slides were incubated in McIlvaine buffer (0.1 M citric acid plus 0.2 M Na2 HPO47 H2O, pH 7.0) for 10 min and stained with
CMA3 (0.5mg/mL in McIlvaine buffer plus 2.5 mM
MgCl2) for 1 h and 30 min in a dark chamber. The
prepara-tions were then mounted in 1:1 (v/v) glycerol:McIlvaine buffer and the slides aged for another three days. Metaphases were examined with a Nikon microscope using a CMA3selective filter (425-445 nm) and photographed on
Kodak Tmax 100 film.
DNA extraction and RAPD amplification
Genomic DNA was isolated from young leaves of at least five individual plants of each species using the CTAB (cetyltrimethyl-ammonium bromide) procedure (Doyle and Doyle, 1989) with modifications, as previously de-scribed (Ruaset al., 2001).
Amplification reactions were carried out in volumes of 15µL containing 1X Taq polymerase buffer (10 mM
Tris-HCl pH 8.3; 50 mM KCL); 1.5 mM MgCl2; 0.1 mM
each of dATP, dTTP, dCTP, and dGTP (Pharmacia), 4 mM of 10-mer arbitrary primers (Operon Technologies); 1 U of Taq DNA polymerase (Pharmacia); and 20 ng of template DNA, using a PTC-200 (MJ Research) thermal cycler with the same cycling parameters as reported by Ruas et al.
(2001). Amplification products were resolved in 1.2% met-aphor agarose (FMC) in 1x TAE buffer (40 mM Tris-acetate; 1 mM EDTA, pH 8.0) for 3 h at 120 V. Gels were stained with ethidium bromide, visualized under UV light, photographed with a video camera and stored in a micro-computer for later analysis.
Data analysis
DNA markers were scored for the presence (1) or ab-sence (0) of homologous DNA bands. The genetic similari-ties were estimated using the Dice coefficient of the NTSYS package (Numerical Taxonomy and Multivariate Analysis for personal computer), version 2.1 (Rohlf, 2000). A dendrogram was constructed using the UPGMA (un-weighted pair-group method using arithmetic averages). The values of the bootstrap method, employed to evaluate the reliability of tree topology, were calculated with 1000 replicates using the BOOD software, version 3.0 (Coelho, 2001). The cophenetic coefficient between the genetic sim-ilarity matrix and the dendrogram was computed using an appropriate routine of the NTSYS-pc software. The signifi-cance of the cophenetic correlation was determined by us-ing the Mantel correspondence test (Mantel, 1967).
Results and Discussion
Karyotype analysis ofH. grisebashiiand
Hypochaerissp.
Chromosome analysis of H. grisebashii was
per-formed for the first time. The karyotype formula is 2n = 8 = 4m+4st, with the same bimodal and asymmetric pattern that characterizes the South AmericanHypochaerisspecies
2.11 to 5.93µm, with the secondary constriction located on
chromosome pair 3 near to the centromere. The total hap-loid length (15.0 ± 1.52µm) was considerably smaller than
in other South American species reported by Ruaset al. (1995). This difference suggests that structural alterations involving decrease of DNA content are still playing a role in the chromosome evolution of South American
Hypochaerisspecies.
Chromosome measurements ofHypochaeris sp
re-vealed a symmetrical karyotype with 2n = 10 = 8m+2sm-sat, following the pattern of European species. The specimens evaluated displayed morphological charac-ters ofH. radicata. For instance, all cypselae were rostrated
and the trichomes at the involucral bracts exhibited specific morphology and distribution only found in H. radicata.
However, most investigations reported 2n = 8 chromo-somes forH. radicata (Ruas et al., 1995; Cerbahet al.;
1998a). The only exception was reported by Hall and Parker (1995) who described, in an experimental popula-tion of H. radicata with 2n = 8, individuals presenting
centric fission in one chromosome and then, heterozygous and homozygous individuals with 2n = 9 and 2n = 10 chro-mosomes, respectively. The findings of the present study
show that the plants analyzed could represent a chromo-some race ofH. radicataand further studies are needed to
substantiate this possibility.
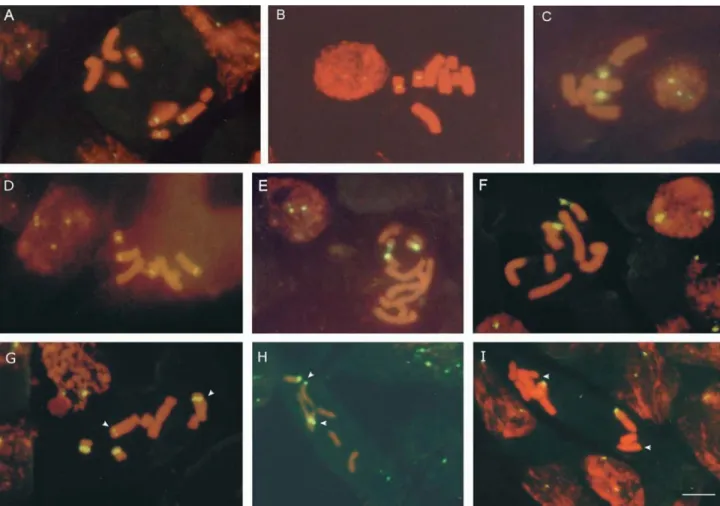
Localization of 45S and 5S ribosomal genes
The results of FISH with rDNA 45S and 5S probes are shown in Figures 1 and 2, respectively, and summarized in Figure 5 and Table 2. All South American species showed one 45S rDNA locus, identified around the second-ary constriction of chromosome pair 3. This locus was pericentromeric in all species, except forH. rosengurttii
(Figure1F), which had the hybridization signal in a terminal position and satellite of chromosome 3, revealing that paracentric inversions are implicated in changes in the po-sition of 45S rDNA loci of South AmericanHypochaeris.
Analysis of metaphases and interphase nuclei revealed variation in the size of hybridization signals among species, suggesting differences in the number of gene copies at this locus. The signals were stronger, covering most of the chro-mosome arm (Figure 1 C, E, G), in H. megapotamica, H. pampasica and H. variegata than in H. brasiliensis, H. grisebashiiandH. microcephala(Figure 1 A, B, D). Other
hybridization signals were observed in a distal position on
the long arm of chromosome 2 inH. brasiliensisand in the
two varieties ofH. microcephala(Figure 1 A, D). Analysis
of H. brasiliensisusing silver impregnation (Ruas et al.,
1995) detected transcriptional activities in both chromo-some pairs 2 and 3.Hypochaeris variegataalso displayed
an additional 45S rDNA locus in the same position of chro-mosome 2 (Figure 1 G). However, analysis of several indi-viduals of this species showed that chromosome pair 2 is heteromorphic for the NOR locus, showing a conspicuous difference in the intensity of the FISH signals, which could be related to a reduced number of rDNA copies. The maxi-mum number of nucleoli per nucleus was three in H. variegata(data not shown), suggesting that the NOR locus
is transcriptionally inactive in one chromosome of pair 2. However, this suggestion needs further investigation. Vari-ation in the expression of 45S rDNA loci was also reported inH. chilensis(Cerbahet al., 1998a). InH. variegata, the
polymorphism observed in the size of the rDNA site could have originated by unequal crossing-over or by amplifica-tion and transposiamplifica-tion of single rDNA copies, as suggested for other plant species (Schubert and Wobus, 1985; Garrido
et al., 1994).
Cerbah et al. (1998a) suggested that the main 45S
rDNA site for the South American species is located on chromosome 3. We consistently observed one 45S rDNA locus located on the short arm of chromosome 3 of all South American species investigated. Nevertheless, an additional 45S rDNA site appeared regularly on the long arm of chro-mosome 2 of H. brasiliensis, H. microcephala, and H. variegata. These data provide additional evidence to the
observations of Cerbahet al. (1998a) that the 45S rDNA
site located on chromosome 2 was conserved in some spe-cies and inactivated or eliminated during the karyotype evolution ofHypochaeris.
Figure 2- Hybridization signals on mitotic metaphases probed with 5S rDNA genes inHypochaerisspecies: (A)H. grisebashii, (B)H. microcephala, (C)
The two populations of the Mediterranean speciesH. glabrashowed the same chromosome number (2n = 8)
re-ported by Ruasel al. (1995), in contrast with 2n = 10
re-ported for European populations of this species. FISH analysis revealed a single terminal 45S rDNA locus on the small arm of chromosome 2 of H. glabra Figure 1 H). In
Hypochaerissp, the 45S rDNA locus was located at the end
of the small arm of chromosome 3, besides an additional signal of weak intensity detected in a terminal position on the short arm of chromosome 4, in which a satellite was ab-sent (Figure 1 I).
Variability in rDNA regions have been explained by translocation, as for instance in humans, in which translocations would have involve the NOR chromosomes 13, 14, 15, 21, and 22 (for review, see Hall and Parker, 1995). In some plant genomes, variability in the location of rDNA loci has been interpreted as a consequence of trans-position of rDNA sequences, as suggested forAllium cepa
(Schubert and Wobus, 1985). The same mechanism was proposed forH. radicataby Hall and Parker (1995). The
authors suggested that the origin and stabilization of a fis-sion rearrangement in individuals ofH. radicatawith 2n =
8 involved transposition of rDNA from the NOR region on chromosome 3 into the centromeric region of a fission de-rivative from chromosome 1. In the present study, we could suppose that some rDNA sequences could have transposed from chromosome 3 to chromosome 4 ofHypochaerissp.
Considering the chromosome number (2n = 10) of the ana-lyzed plants, we could also hypothesize that the karyotype ofHypochaerissp was derived by chromosome
rearrange-ments from a plant with 2n = 8 (possiblyH. radicata).
Previous investigations inHypochaerisshowed one,
two, or a maximum of three 45S rDNA sites per haploid ge-nome (Cerbahet al., 1995; Cerbahet al., 1998a). The
inten-sity of hybridization signals was associated with the number of rDNA gene copies. InH. robertia, the presence
of tiny signals was related with a low number of copies in each of the three 45S rDNA loci and with the small genome of this species (Cerbahet al., 1995; 1998a). In the present
study, the hybridization signals observed in the two 45S rDNA loci ofH. brasiliensisandH. microcephala(Figure 1
A, D) were brighter than that of the single locus of H. grisebashii(Figure 1 B). Indeed, chromosome
measure-ments ofH. grisebashiirevealed a rather smaller haploid
genome in this species, suggesting a possible loss of 45S rDNA sequences that may be related to a lower DNA con-tent.
We have confirmed the presence of a single cluster of 5S rDNA genes supporting the results reported by Cerbah
et al. (1998a). In all South American species, the 5S rDNA clusters were in an intercalary position on the small arm of chromosome 2, as seen in Figures 2 (A-D) and 5. The regu-lar distribution and the uniformity of the hybridization sig-nals observed in the 5S rDNA loci revealed that these clusters are more stable than 45S rDNA clusters in the ge-nome of South AmericanHypochaeris.
The European speciesH. glabra andHypocherissp
showed different distribution of 5S rDNA sites.
Hypochaeris glabrarevealed one 5S rDNA site, identified
near to the centromere on the long arm of chromosome 3.
Hypochaeris sp showed two closely adjacent 5S rDNA
sites identified near the terminal region on short arm of chromosome 2 (Figure 2 E-F). These chromosome loca-tions of the 5S rDNA locus also differed from that reported byCerbah et al. (1998a) forH. glabra andH. radicata,
where the 5S rDNA genes were located at an intercalary po-sition, on the short arm of chromosome 4 and on the long arm of chromosome 2, respectively. These results support the hypothesis that structural rearrangements, such as centric shift may have occurred in populations of European species established in South America.
Chromomycin A3Banding
The chromomycin A3 banding patterns were compar-atively analyzed as summarized in Table 2. In all species, CMA-positive bands were found associated with regions identified as 45S rDNA sites by FISH (Figure 3 A-I and Figure 5). The association between CMA-positive bands
Table 2- Distribution of CMA3positive bands and 45S and 5S rDNA loci per haploid genome ofHypochaerisspecies.
Species Number and distribution of CMA3bands associated to 45S rDNA
Number and distribution of CMA3 bands associated to 5S rDNA
Number and distribution of additional CMA3bands
H. brasiliensis 2 (SC of LA of pair 2 and SA of pair 3) 1 (SA of pair 2)
-H. grisebashii 1 (SC/SA of pair 3) 1 (PC/LA of pair 2) H.megapotamica 1 (SA of pair 3) 1 (SA of pair 2)
-H. microcephala 2 (SC/LA of pair 2 and SC/SA of pair 3) 1 (SA of pair 2)
-H pampasica 1 (SA of pair 3) 1 (SA of pair 2) 1 (PC/LA of pair 2)
H. rosengurttii 1 (SA of pair 3) -
-H. variegata 2 (SA of pair 3) -
-H. glabra 1 (sat of pair 2) 1 (LA of pair 3) 4 (PC/SA of pairs 1-4) Hypochaerissp 1 (sat of pair 3) 1 (SA of pair 2)*
and 45S rDNA loci was previously observed by Cerbahet al. (1995; 1998a) in European and South American Hypochaerisspecies. This distribution pattern of GC- rich
heterochromatin has also been described in many other re-lated or unrere-lated plant groups (Galassoet al., 1995, 1998;
Fukui and Nakayama, 1996).
Co-location of 5S rDNA and CMA+ bands was clearly observed inH. brasiliensis,H. megapotamica, both
varieties ofH. microcephala,H. pampasicaandH. glabra
(Figures 3 A, C, D, E, H and Figure 5), but this correspon-dence was not detected in the other species investigated, in-cludingHypochaerissp. Cerbahet al. (1998a) reported the
co-location of 5S rDNA loci and CMA bands in South American and European species, exceptH. radicata. These
findings need further investigation concerning the organi-zation of 5S rDNA repeat units inHypochaeris, to
under-stand this CMA response.
Additional CMA-positive bands, not related to rDNA, were observed on the long arm of chromosome 2, near to the centromere, inH. grisebashiiandH. pampasica
(Figure 3 B, E). InH. glabra, additional bands exhibiting
equilocal distribution were seen near to the centromere on
the short arm of all chromosomes. (Figure 3 H). This pat-tern of CMA bands is totally different from that described by Cerbahet al. (1998a), for a European population ofH. glabrawhere only one intercalary band was observed on
the short arm of pair 4, besides the satellite-associated band. Cerbahet al. (1995) also detected a thin CMA3band
on the short arm of chromosome 1 in H. microcephala,
which was absent in the populations analyzed in this study. Determination of DNA content and DNA base com-position showed little differences in GC percentage in
Hypochaerisspecies (Cerbahet al., 1995), supporting the
relatively homogeneous pattern of CMA3blocks observed
in the present study, especially in the South American spe-cies.
Genetic relationships based on RAPD markers
RAPD markers have been considered as suitable characters for genetic analysis since they allow to examine accumulated genetic differences that are important at vari-ous taxonomic levels. Molecular markers such as RAPDs are neutral characters with no known phenotypic effects (Aagaard et al., 1998) and therefore, they are excellent
Figure 3- Mitotic metaphases stained with chromomycin A3showing the distribution of GC-rich heterochromatin inHypochaerisspecies: (A)H.
tools for studying genetic variability of natural populations. Additionally, because RAPDs are randomly distributed over the entire genome, extensive amount of polymorphism can be detected.
RAPD markers were applied to identify intra- and interspecific variation and to evaluate the phylogenetic re-lationships among nine species of Hypochaeris.
Ninety-eight RAPD primers were initially tested, to select those that were suitable in generating reproducible and polymorphic bands. Twenty-five primers were then se-lected and used for DNA amplification in allHypochaeris
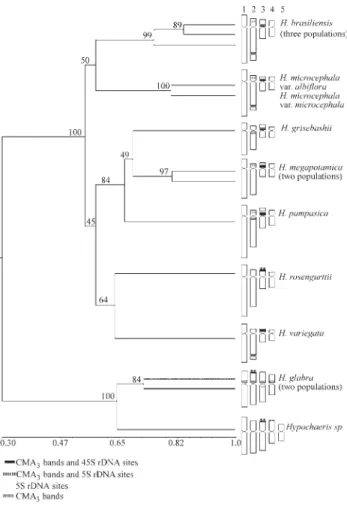
species, rendering a total of 122 markers, 120 (98%) of which were polymorphic. Figure 4 illustrates the electro-phoresis profile obtained with primer OPS-10. The data matrix of genetic similarities and the dendrogram with the respective bootstrap values are illustrated in Table 3 and Figure 5, respectively. The value of cophenetic correlation (r = 0.98) between the similarity matrix and the dendrogram indicates to which extent the clustering of genotypes accu-rately represents the estimates of genetic similarities among species. Cluster analysis associated the species un-der study into two major groups, comprising the South American and the European species, with a mean genetic similarity of only 34.7% (Table 3) and a 100% bootstrap support. These results are in agreement with the hypothesis of a monophyletic origin for the South American
Hypochaerisspecies (Samuelet al. 1999; 2003).
The groups represented by the South American spe-cies showed a consistent association between molecular markers and karyotype features (Figure 5), showing sub-stantial levels of polymorphism. The genetic similarity val-ues ranged from 55% between H. microcephala var albifloraandH. pampasicato 79% betweenH. grisebashii
andH. megapotamica. Based on the RAPDs, the South
American species were divided into three subgroups (Fig-ure 5). The first subgroup associatedH. brasiliensisandH. microcephala, which also display similar chromosome
characteristics, with an average of 68% genetic similarity. For instance, they both exhibit CMA bands and the 45S rDNA loci at the same position on chromosomes 2 and 3. The second group associates H. grisebashii, H. megapotamicaandH. pampasicawith a 76% genetic
simi-larity, on average. These species show the same distribu-tion of the 45S rDNA genes, identified in the pericentromeric region on the small arm of chromosome 3 besides an additional CMA band observed on chromosome 2 ofH. megapotamicaandH. pampasica. The third
sub-group associatedH. rosengurttiiandH. variegata with a Figure 4- Electrophoretic pattern of primer OPS-04 inHypochaeris spe-cies: 1-3 =H. brasiliensis(populations of Guaíba, RS; Curitiba, PR and Piracicaba, SP), 4 =H. grisebashii, 5-6 =H. megapotamica(populations of Guaíba and Capão da Canoa, RS), 7 =H. microcephalavaralbiflora, 8 = H. microcephalavar microcephala, 9 =H. pampasica, 10 =H. rosengurttii, 11 =H. variegata, 12-13 =H. glabra(populations of Curitiba and Ponta Grossa, PR) 14 =Hypochaerissp.C = Control, M = ladder (123 bp, Gibco).
Table 3 -Similarity matrix generated from Dice coefficient based on 122 RAPD markers obtained forHypochaerisspecies.
Species 1 2 3 4 5 6 7 8 9 10 11 12 13 14
1.H. brasiliensis(RS) 1.00 2.H. brasiliensis(PR) 0.85 1.00
3.H. brasiliensis(SP) 0.90 0.82 1.00 4.H. grisebashii(RS) 0.68 0.62 0.71 1.00 5.H. megapotamica(RS) 0.67 0.61 0.69 0.79 1.00 6.H. megapotamica(RS) 0.68 0.62 0.67 0.78 0.88 1.00 7.H. microcephala var. albiflora(RS) 0.71 0.64 0.69 0.59 0.61 0.67 1.00
8.H. microcephala var. microcephala(RS) 0.71 0.64 0.69 0.62 0.66 0.70 0.88 1.00 9.H. pampasica(RS) 0.63 0.60 0.60 0.77 0.76 0.76 0.55 0.62 1.00 10.H. rosengurttii(RS) 0.65 0.58 0.68 0.72 0.72 0.69 0.67 0.65 0.67 1.00
similarity of 74%. However, inH. rosengurttii, the single
locus of the 45S rDNA clusters was located at the second-ary constriction and adjacent satellites of chromosome 3, whileH. variegatahad the 45S rDNA genes on
chromo-some pairs 2 and 3, like H. brasiliensis and H. microcephala.
The European speciesH. glabraandHypochaerissp (possible a cytotype ofH. radicata), which were isolated from the South American group, showed an average ge-netic similarity of 74.5%. Whereas these species are known to display symmetrical karyotypes, we detected a distinct distribution of CMA3bands and 5S rDNA genes (Figures 2
E-F; 3 H-I; and 5).
RAPD markers also identified considerable levels of intraspecific variation. Analysis of three populations ofH. brasiliensisshowed a genetic similarity that ranged from
82% to 90% (Table 3). Similar levels of variation were doc-umented between the two populations ofH. megapotamica
and between the two populations of H. glabra, which
showed a genetic similarity of 88% and 81%, respectively. The two varieties of H. microcephala had a genetic similar-ity of 88%. This pattern of intraspecific variation is
com-mon for pioneer species, such as those of the genus
Hypochaeris(Stuessy, 2001).
The importance of molecular phylogenetic studies to understand changes in plant genome organization and chro-mosome evolution has been emphasized in many works. Taxonomy and phylogenetic relationships of the genus
Hypochaerishave been discussed based on a sequencing
data set of ITS regions (Cerbahet al., 1998b; Samuelet al.,
1999; 2003) and plastidial intergenic TrnL and mat-K se-quences (Samuelet al., 1999; 2003). These authors
sug-gested that South AmericanHypochaerisspecies constitute
a monophyletic group that was probably derived from a sin-gle progenitor introduced from Europe. They also consid-ered thatH. maculatarather thanH. robertia, as previously
suggested by Barghiet al.(1989), is closer to the South
American species than any other European species. Cerbah
et al. (1995) showed thatH. maculatahas a high DNA
con-tent (7.48 pg) when compared with the DNA concon-tent of the South American species (4.15 to 4.65 pg), suggesting that, in addition to chromosome rearrangements, which coordi-nated the changes in position and number of NOR genes, as suggested by Cerbahet al. (1998a), loss of DNA
accompa-nied the origin and establishment of the South American karyotypes. Likewise, the pattern of genetic variation de-tected with RAPD markers is also consistent with changes in DNA repetitive elements, which are known to evolve more rapidly than single sequences (Wuet al., 1999).
The evolutionary dynamics of the 45S rDNA sites points to some trends among South American species. It has been noted that while some species have two rDNA sites, the main locus is probably the one located on the small arm of chromosome 3, as suggested by Cerbahet al.
(1998a). Paracentric inversion may have moved this site from terminal chromosome regions, as inH. rosengurttii, to
a perhaps more stable pericentromeric position, as ob-served in all other species. Furthermore, differences de-tected in the hybridization signals suggest the occurrence of reduction in the number of 45S rDNA copies at this site, implying that deletion of DNA sequences is also implicated in the diversification of genomes in the South American species.
The results obtained in the present work concerning karyotype features, chromosome location of 45S rDNA loci and CMA-positive bands showed that the species di-versification in Hypochaerisinvolved chromosome
rear-rangements, as previously reported (Ruas et al., 1995;
Cerbahet al., 1995; 1998a). The nature of the RAPD
mark-ers also suggests that changes in DNA content may have re-sulted from amplification or deletion of repetitive DNA sequences. Genome diversification has involved consider-able alteration of repetitive DNA sequence arrays in several groups of plants (Heslop-Harrison, 2000) and therefore, the variability of RAPD markers may represent a result of vari-ation in different classes of repetitive DNA sequences amongHypochaerisspecies.
Figure 5- Dendrogram showing the association between RAPD markers
The high genetic variability detected using RAPD and the correlation between cytogenetic and molecular markers give additional support to the idea that a major evolutionary pathway operated toward genome organiza-tion and karyotype differentiaorganiza-tion, leading the separaorganiza-tion of European and South American species ofHypochaeris.
Acknowledgements
This research was supported by Fundação de Amparo a Pesquisa do Estado de São Paulo-FAPESP (Proc. 98/01170-5), Fundação Araucária, PR (Proc. 111/2001) and CNPq.
References
Aagaard JE, Krutovskii KV and Strauss SH (1998) RAPDs and allozymes exhibit similar levels of diversity and differentia-tion among populadifferentia-tions and races of Douglas-fir. Heredity 81:69-78.
Baldwin BG (1993) Molecular phylogenetics of Calycadenia
(Compositae) based on ITS sequences of nuclear ribosomal DNA: Chromosomal and morphological evolution reexam-ined. Amer J Bot 80:222-238.
Barghi N, Mugnier C and Siljak-Yakovlev S (1989) Karyological studies in someHypochaerisssp. (Compositae) from Sicily.
Plant Syst Evol 168:49-57.
Castilho A and Heslop-Harrison JS (1995) Physical mapping of 5S and 18S-25S rDNA and repetitive DNA sequences in
Aegilops umbellulata. Genome 38:91-96.
Cerbah M, Coulaud J, Godelle B and Siljak-Yakovlev S (1995) Genome size fluorochrome banding, and karyotype evolu-tion in someHypochaerisspecies. Genome 38:689-695. Cerbah M, Coulaud J and Siljak-Yakovlev S (1998a) rDNA
orga-nization and evolutionary relationship in the genus
Hypochaeris(Asteraceae). The J Heredity 89:312-318.
Cerbah M, Souza-Chies T, Jubier MF, Lejeune B and Siljak-Yakovlev S (1998b) Molecular phylogeny of the ge-nusHypochaeris(Asteraceae). Mol Biol Evol 15:345-354.
Cerbah M, Coulaud J, Brown SC and Siljak-Yakovlev S (1999) Evolutionary DNA variation in the genus Hypochaeris
(Asteraceae). Heredity 82:261-266.
Cipriani G, Di Bella R and Testolin R (1996). Screening RAPD primers for molecular taxonomy and cultivar fingerprinting in the genusActinidia. Euphytica 90:169-174.
Coelho ASG (2001) BOOD - Avaliação de dendrogramas ba-seado em estimativas de distâncias/similaridades genéticas através do procedimento de bootstrap. v. 3.0. Departamento de Biologia Geral, Instituto de Ciências Biológicas, Univer-sidade Federal de Goiás. Goiânia, GO, Brasil.
Cuadrado A and Jouve N (1994) Mapping and organization of highly-repeated DNA sequences by means of simultaneous and sequential FISH and C-banding in 6x-Triticale.Chrom Res 2:231-338.
Doyle JJ and Doyle JL (1987) A rapid DNA isolation procedure for small quantities of fresh leaf tissue. Phytoch Bull 19:11-15.
Dunemann F, Kahnau R and Schmidt H (1994) Genetic relation-ships inMalusevaluated by DNA fingerprint of cultivars
and wild species. P Breeding 113:150-159.
Fukui K and Nakayama S (1996) Chromosome banding methods. In: Fukui K and Nakayama S (eds) Plant Chromosomes: Laboratory Methods. Boca Raton, New York, pp 123-153. Galasso IT, Schmidt T, Pignone D and Heslop-Harrison JS
(1995). The molecular phylogenetics ofVigna unguiculata
(L.) Walp: The physical organization and characterization of 18S-5.8S-25S rDNA genes, 5S genes, telomere-like quences, and a family of centromeric repetitive DNA se-quences. Theor Appl Gen 91:928-935.
Galasso IT, Saponetti LS and Pignoni D (1998) Cytotaxonomic Studies inVigna. IV. Variation of the number of active and silent rDNA sites in Vigna unguiculata populations. Caryologia 2:95-104.
Garrido MA, Jamilena M, Lozano R, Ruiz Rejon C, Ruiz Rejon M and Parker JS (1994) rDNA site polymorphism and NOR in-activation in natural populations ofAllium schoenoprasum.
Genetica 94:67-71.
Gerlach WL and Bedbrook JR (1979) Cloning and characteriza-tion of ribosomal RNA genes from wheat and barley. Nucl Acid Res 7:1869-1885.
Gerlach WL and Dyer TA (1980) Sequence organization of the re-peating units in the nucleus of wheat which contain 5S rRNA genes. Nucl Acid Res 8:4851-4855.
Hall KL and Parker JS (1995) Stable chromosome fission associ-ated with rDNA mobility. Chrom Res 3:417-422.
Heslop-Harrison JS (2000) Comparative genome organization in plants: From sequences and markers to chromatin and chro-mosomes. The Plant Cell 12:617-635.
Heslop-Harrison JS, Schwarzacher T, Anamthawat-Jónsson K, Leitch AR, Shi M and Leitch IJ (1991)In situhybridization
with automated chromosome denaturation. Technique 3:109-115.
Hoey BK, Crowe KR, Jones VM and Polans NO (1996) A phylo-genetic analysis ofPisumbased on morphological charac-ters, and allozyme and RAPD markers. Theor Appl Gen 92:92-100.
Kazan K, Manners JM and Cameron DF (1993) Genetic variation in agronomically important species ofStylosanthes
deter-mined using random amplified polymorphic DNA markers. Theor Appl Gen 85:882-888.
Leitch IJ and Heslop-Harrison JS (1993) Physical mapping of four sites of 5S rDNA sequences and one site of the alpha-amylase-2 gene in barley (Hordeum vulgare). Genome 36:517-523.
Mantel N (1967) The detection of disease clustering and a gener-alized regression approach. Cancer Res 27:209-220. Ran Y, Hammett RWK, and Murray BG (2001) Phylogenetic
analysis and karyotype evolution in the genus Clivia
(Amaryllidaceae). Annals Bot 87:823-830.
Rohlf FJ (2000) NTSYS-pc Numerical Taxonomy and Multivariate Analysis System version 2.1 Owner manual. Ruas CF, Ruas PM, Matzenbacher NI, Ross G, Bernini C and
Vanzela ALL (1995) Cytogenetic studies of some
Hypochaerisspecies (Compositae) from Brazil. Amer J Bot 82:369-375.
Ruas CF, Ruas PM and Cabral JR (2001) Assessment of genetic relatedness of the genera Ananas and Pseudananas con-firmed by RAPD markers. Euphytica 119:245-252. Samuel R, Stuessy T, Weiss H, Cerbah M and Siljak-Yakovlev S
Amer-ica. In: Manitz H and Hellwig FH (eds) 14th Symposium Biodiversität und Evolutions Biologie.
Samuel R, Stuessy T, Tremetsberger K, Baeza CM and Siljak-Yakovlev S (2003) Phylogenetic relationships among spe-cies ofHypochaeris(Asteraceae, Cichorieae) based on ITS,
Plastid TrnL intron, TrnL-F spacer, and matK sequences. Am J Bot 90:496-507.
Santala M, Power JB and Davey MR (1998) Genetic diversity in mung bean germplasm revealed by RAPD. P Breeding 117:473-478.
Schubert I and Wobus U (1985)In situhybridization confirms
jumping nucleolus organizing regions of Allium.
Chromosoma 92:143-148.
Schwarzacher T, Ambros P and Schweizer D (1980) Aplication of Giemsa banding to orchid karyotype analysis. Plant Syst Evol 134:293-297.
Siljak-Yakovlev S, Bartiolo A, Roitman G, Barghi N and Mugnier C (1994) Étude caryologique de trois espèces d’
Hypochaeris originaires d’ Argentine: H. chillensis, H. microcephalaetH. megapotamicavar.albiflora.Can J Bot 72:1496-1502.
Stebbins GL (1971) Chromosomal Evolution in Higher Plants. Edward Arnold, London, 216 pp.
Stuessy TF (2001) La filogenia y biogeografia deHypochaeris
(Asteraceae) en América del Sur. In: Seminars on Plant Ecology and Evolution, Universidad de Sevilla.
Welsh J and McClelland M (1990) Fingerprinting genomes using PCR with arbitrary primers. Nucleic Acids 18:7213-7218. Williams JGK, Kubelik AR, Livak KJ and Rafalski JA (1990)
DNA polymorphisms amplified by arbitrary primers are useful as genetic markers. Nucl Acids Res 18:6531-6535. Wu J, Krutovskii KV and Strauss SH (1999) Nuclear DNA
diver-sity, population differentiation, and phylogenetic relation-ships in the California closed-cone pines based on RAPD and allozyme markers. Genome 42:893-908.