Mining plant genome browsers as a means for efficient connection
of physical, genetic and cytogenetic mapping: An example using soybean
Luis C. Belarmino
1, Ana R. da S. Oliveira
1,2, Ana C. Brasileiro-Vidal
1,2, Kyria C. de A. Bortoleti
1,3,
João Pacífico Bezerra-Neto
1, Ricardo V. Abdelnoor
4and Ana M. Benko-Iseppon
11
Laboratório de Genética e Biotecnologia Vegetal, Departamento de Genética,
Universidade Federal de Pernambuco, Recife, PE, Brazil.
2
Programa de Pós Graduação em Melhoramento Genético de Plantas,
Universidade Federal Rural de Pernambuco, Recife, PE, Brazil.
3Campus Ciências Agrárias, Universidade Federal do Vale do São Francisco, Petrolina, PE, Brazil.
4Embrapa Soja, Londrina, PR, Brazil.
Abstract
Physical maps are important tools to uncover general chromosome structure as well as to compare different plant lin-eages and species, helping to elucidate genome structure, evolution and possibilities regarding synteny and colinearity. The increasing production of sequence data has opened an opportunity to link information from mapping studies to the underlying sequences. Genome browsers are invaluable platforms that provide access to these se-quences, including tools for genome analysis, allowing the integration of multivariate information, and thus aiding to explain the emergence of complex genomes. The present work presents a tutorial regarding the use of genome browsers to develop targeted physical mapping, providing also a general overview and examples about the possibili-ties regarding the use of FluorescentIn Situ Hybridization (FISH) using bacterial artificial chromosomes (BAC), sim-ple sequence repeats (SSR) and rDNA probes, highlighting the potential of such studies for map integration and comparative genetics. As a case study, the available genome of soybean was accessed to show how the physical andin silico distribution of such sequences may be compared at different levels. Such evaluations may also be com-plemented by the identification of sequences beyond the detection level of cytological methods, here using members of the aquaporin gene family as an example. The proposed approach highlights the complementation power of the combination of molecular cytogenetics and computational approaches for the anchoring of coding or repetitive se-quences in plant genomes using available genome browsers, helping in the determination of sequence location, ar-rangement and number of repeats, and also filling gaps found in computational pseudochromosome assemblies.
Key words:gene families, FISH, BAC, SSR, aquaporin, bioinformatics.
Introduction
Scientific advances in the field of genomics have been promising for crop improvement in quality, produc-tivity and resistance against pathogens, meeting the de-mands for food, fiber and biofuels. Such an interest has led to the production of large quantities of biological data from diverse sources. The continuous increase in the amount of available data on genomes and gene expression studies re-quires efficient storage, organization and data analysis. So the next logical step is to develop various graphical user in-terfaces or genome browsers, which provide logical access to data flows that otherwise would be unintelligible (Senet
al., 2010). According to the Entrez Genome Project, in
2009 more than 150 projects related to the Viridiplantae genomes were initiated, including several species of agro-nomic, industrial and biotechnological interest, emphasiz-ing the importance of bioinformatics platforms for the pro-motion of comparative genomics of model plants so as to enable us to understand the biological properties of each species, as well as accelerating gene discovery and func-tional analysis.
In this scenario, several genome browsers were de-veloped, especially dedicated to generate information on cultivated and model plants. Gramene, for example, is a free online tool for genome comparison, providing a total of 15 genomes, including those ofOryza sativa(cv. japonica
and cv. indica), Arabidopsis thaliana, A. lyrata,
Brachypodium distachyon,Populus trichocarpa,Sorghum bicolor and Vitis vinifera (Youens-Clark et al., 2010).
Send correspondence to Ana M. Benko-Iseppon. Laboratório de Genética e Biotecnologia Vegetal, Departamento de Genética, Uni-versidade Federal de Pernambuco, Av. Prof. Morais Rego 1235, 50.670-420 Recife, PE, Brazil. E-mail: [email protected].
PlantGDB provides access to sequences, as well as to a va-riety of tools for analysis and comparison of genomes, pro-viding chromosome-based genome browsers (xGDB) for 14 plant species with completely or partially sequenced genomes (Duvicket al., 2008). Additional sources of infor-mation are Phytozome, which currently provides genome browsers for 22 plant species, including the legumes soy-bean (Glycine max) andMedicago truncatula, and LIS (Le-gume Information System) that comprises data on 18 le-gume species.
To facilitate gene and genome annotation, and to un-derstand the organization, structure and evolution of genes and genomes, we carried out a set of procedures so as to op-timize the use of the information deposited in plant genome browsers for cytogenetic and physical mapping of selected genes or genome regions. We also present a practical exam-ple of how to anchor Bacterial Artificial Chromosomes (BACs) and repetitive sequences in the soybean genome, integratingin silicoandin situapproaches, as well as an ex-ample of how a careful study of gene families (e.g. aqu-aporins) may aid in characterizing and explaining the emer-gence of complexity in plant genomes.
Applications and Uses of Plant Genome
Browsers (PGBs)
The information on complete genome sequences al-lows us to derive important sets of genomic features, in-cluding the identification of protein-coding and non-coding genes, regulatory elements, gene families and repetitive se-quences, such as the Simple Sequence Repeats (SSR). Among other applications, this set of features has become the raw material for the integration of multivariate informa-tion such as “omics” data. Alignments are often used to ex-plore/describe gene structure and the distribution of gene
families in complete genomes (Soares-Cavalcanti et al.,
2012), as well as the conservation of syntenic structures among chromosomes of different species, allowing for the evolutionary history reconstruction of genes and genomes through comparative structural and functional genomic ap-proaches (McCleanet al., 2010).
Notably, plant genomes contain large amounts of re-petitive elements (RE), which refer to a broad and heteroge-neous group of genetic elements that are often degenerate and inserted in each other. Mobile elements, simple se-quence repeats (e.g. micro-, mini- and satellite) and gene families with high numbers of repeating units (e.g.rDNA and histones) are the main RE groups (Spannaglet al., 2007). These RE groups are present in mostly of the unanchored se-quence scaffolds after plant genome assembly, as for in-stance in the case of the SoyBase platform (Schmutzet al., 2010). The FISH (FluorescentIn SituHybridization) proce-dure could be a good strategy to identify these blocks which are frequently localized in heterochromatic regions (Cuadra-do and Jouve, 2007). This strategy emphasizes the power of
complementation which may result from the combination of molecular cytogenetics and computational approaches to the anchoring of repetitive sequences in plant genomes with available genome browsers, in order to determine its loca-tion, arrangement and number of repeats, filling gaps found in computational pseudochromosome assemblies.
FISH-based cytogenetic maps developed using BAC clones as probes are often associated with genetic and contig maps (Chenget al., 2001; Findleyet al., 2010), and may be useful during whole genome sequencing projects, helping to evaluate the size of the putative remaining gaps. Given the low correlation observed between physical dis-tances (measured in micrometers) and genetic disdis-tances (based on the recombination frequency), the integration of cytogenetic and genetic maps has allowed the identification of possible distortions in physical distances found in link-age maps (Kaoet al., 2006). Recently, a cytogenetic map of the common bean was built by FISH with 43 available an-choring points (BACs) between the genetic and the cyto-genetic maps. Their comparison confirmed the suppression of recombination in extended pericentromeric chromosome regions, indicating that suppression of recombination cor-relates with the presence of prominent pericentromeric heterochromatic blocks, and is responsible for the distor-tions of the inferred distances (Pedrosa-Harandet al., 2009; Fonsêcaet al., 2010).
Bioinformatics platforms and associated databases are essential for the emergence of effective approaches that make the best use of genomic resources, including its re-spective integration. Genetic maps, often constructed by in-dependent research groups for several plant species, allow to define the relative position of markers linked to heritable traits. When compared to physical maps, genetic maps pro-vide a means to link these heritable traits to the underlying genomic sequence variation (Limet al., 2007). It also al-lows the investigation of homologies among different ge-nomes in the same species (allopolyploidy) or different species, observing colinearity (e.g.conservation of gene or-der) or synteny (e.g.conservation of linkage) among them
(Hougaardet al., 2008), both at macro and micro levels
(Keveiet al., 2005). The former focuses on the genome as a
whole, examining large regions (e.g. linkage groups) by
comparison of genes or chromosome segments based on genetic, physical or cytogenetic maps of different species (Mandáková and Lysak, 2008; McCleanet al., 2010), while the latter focuses directly on smaller, but continuous, com-pletely sequenced genomic regions (Davidet al., 2009).
become available for ever more species, and when com-bined with wet lab experiments, they will aid in integrating biological data from diverse sources. With worldwide ef-forts directed towards the structural and functional charac-terization of its genome, soybean is at the forefront of legume genomics, with a robust infrastructure in informa-tion technology that is critical to understand the biology of this and other legumes. The final application of these re-sources and information reflects the efforts to elucidate the genetic background of given agronomic traits, with impor-tant implications for plant breeding.
A Practical Example Using Soybean
Previous studies demonstrated that the soybean ge-nome (probably of polyploid origin) has undergone multi-ple whole genome duplications, genome diploidization, as
well as chromosomal rearrangements (Shoemakeret al.,
2006), thus making it one of the most complex plant geno-mes currently investigated. Hence, multiple copies (or blocks) of DNA sequences were identified in more than two chromosomes. On average, 61.4% of the homologous genes are present in blocks involving only two chromo-somes, 5.63% are spread over three chromochromo-somes, and 21.53% in four (Schmutzet al., 2010).
Soybean (2n= 40 chromosomes) was the first legume to be completely sequenced, serving as a reference for more than 20,000 legume species and helping to understand the mechanism of biological fixation of atmospheric nitrogen by symbiosis. The soybean genome was sequenced using the shotgun strategy, covering 950 Mb of sequence. Most of the genome sequences were assembled into 20 pseudo-chromosomes (Glyma 1.01), grouping 397 sequence scaf-folds in ordered positions within the 20 soybean linkage groups. An additional amount of 17.7 Mb were recognized in 1,148 sequence scaffolds that were left unassembled, be-ing constituted mainly of repetitive DNA and less than 450 predicted genes (Schmutzet al., 2010). The scaffold posi-tions were identified by means of extensive genetic maps, including 4,991 single nucleotide polymorphisms (SNPs) and 874 simple sequence repeats (SSRs) (Songet al., 2004, Choiet al., 2007; Hytenet al., 2010a,b).
Using a combination of full-length cDNA, EST,
homology and ab initio methods, 46,430 protein-coding
loci were identified in the soybean genome with a high con-fidence level, and another 20,000 loci were predicted with a low confidence level. From the first group of genes, 12,253 gene families (34,073 genes) could be identified with one or more sequences in other angiosperms, as well as 283 le-gume-specific gene families and 741 soybean-specific gene families, reflecting an ancient but continuous process of du-plication and genetic divergence (Schmutzet al., 2010).
Anchoring gene families in physical maps
On a microscale, the genomic distribution pattern of gene family members has served to assist in the inference of
the processes that generated the observed genome
complexity (Diet al., 2010). As an example we used the
aquaporin gene family, because aquaporins are a ubiqui-tous protein family and have important physiological roles.
Aquaporins constitute a set of small transmembrane proteins that facilitate the process of transporting water and small solutes. The first plant aquaporin was identified in soybean root nodules. Later, their presence was verified in many species of Viridiplantae, recognizing four main aqua-porin types that reflect their size and subcellular localiza-tion (Chaumontet al., 2001, 2005; Kaldenhoff and Fischer,
2006; Kruseet al., 2006; Maeshima and Ishikawa, 2008).
Aquaporins are abundant, diverse and widely distributed in
plant genomes.Arabidopsispresents 35 aquaporin coding
genes spread throughout the five chromosomes of the ge-nome that is believed to be one of the simplest among plants (Chaumontet al., 2005; Ishikawaet al., 2005; Zhaoet al., 2008). Although the first aquaporin was described in soy-bean, there are no studies on the abundance, diversity and distribution of aquaporins in this legume.
For the study of aquaporins in the soybean genome,
we chose fourArabidopsis protein sequences as probes,
representing each of the four subfamilies of aquaporins:
Plasma Membrane Intrinsic Protein (PIP1.4; acc.
NP_567178.1), Tonoplast Intrinsic Protein (PIR1-1, acc. P25818.1), Nodulin26-like Intrinsic Protein (NIP4-2, acc. NP_198598.1) and Small and Basic Intrinsic Protein (SIP2-1, acc.NP_191254.1). Using these as query sequen-ces, a tBLASTn search was conducted in the EST sequence database of GENOSOJA. At this stage, we adopted a cut-off e-value of e-05 for acceptance of putative aquaporin homologs in soybean.
Subsequently, sequential analyses were performed to determine the identity of these putative homologs expres-sed in soybean, through recognition of similarities with known proteins using the BLASTx algorithm, conceptual translation using the ORF finder program, and evaluation of conserved domains using the rpsBLAST algorithm. Af-ter identifying the expressed homologs, the next step con-sisted of anchoring these transcripts in the soybean genome browser available at the SoyBase web server. For this pur-pose, such transcripts were entered as queries in a BLASTn search. The conceptually translated protein sequences were also used as queries in a tBLASTn search in order to dis-cover possible new aquaporin loci not represented in the available soybean EST pool. Finally, a megaBLAST search was carried out using the nucleotide sequences of all loci in order to determine the most closely related genes, thus re-flecting the relationship among the chromosomal regions harboring aquaporin genes (Figure 1).
noise introduced during the assembling process of the avai-lable ESTs. The proteins obtained by conceptual translation of the loci, when compared with the genome through the tBLASTn tool, reported 36 new loci, totalizing 100 aqua-porin genes in the soybean genome. This number is approx-imately three times higher than that denoted for Arabidopsisand rice (Johansonet al., 2001, Sakuraiet al., 2005), and is the largest number of aquaporins observed in a plant species to date.
The increase in the number of aquaporin coding genes has been attributed to segmental and whole genome dupli-cations (Liuet al., 2009). These processes can also be in-voked to explain the number and distribution of aquaporins in the soybean genome. For example, pseudochromosomes
10 and 20 (Gm10 andGm20) share four colinearly
pre-served aquaporin genes at the distal regions of the long chromosome arm, which are inverted only in relation to the extremity (Figure 1). This observation is consistent with the
syntenic relationship betweenGm10 andGm20 (Schmutz
et al., 2010), and among these and chromosome 7 (Pv7) of Phaseolus vulgaris(McCleanet al., 2010). Another strik-ing example is the commonality of a tandem duplication found integrally or with the loss of one of the genes from
the tandem composition. The first case was observed
be-tweenGm5 andGm8, as well as betweenGm7 andGm8
(Figure 1), again in agreement with previous observations (McCleanet al., 2010) considering an overall evaluation regarding diverse gene families. The latter can be seen in-volving the distal regions of the long chromosome arm of Gm3 andGm19, which are colinearly conserved, except for the absence of one of theSIPgenes inGm3 (Figure 1). A general prevalence of aquaporin genes in distal positions is also evident. These are just some of the events denoted in Figure 1. In general, the number and distribution of aqua-porins corroborate previous suggestions of the octoploid nature of soybean (Shultzet al., 2006). The panel depicted by the analysis suggests that this gene family is a good can-didate to determine the time elapsed after polyploidization of soybean from the putative diploid ancestor(s), especially when sister genomes are added to the comparison (Schranz and Mitchell-Olds, 2006).
Comparative mapping between genetic, physical and cytogenetic maps
With the development of the SoyBase platform, comparative analysis of genetic and physical maps
through contigs (distances measured in base pairs) with cytogenetic maps has made map integration even more in-formative, allowing not only a deeper analysis of both re-petitive and single copy DNA sequences, but also the rapid and efficient identification of synteny between dif-ferent taxonomic groups. Below are alternative ways of using the SoyBase for the analysis and selection of both repetitive and single-copy DNA sequences for cyto-genetic mapping in soybean.
In silico selection of BACs for FISH
BAC inserts are capable of carrying up to 500 kb of genomic DNA, with typical sizes ranging from 80 to 200 kb, containing highly repetitive DNA sequences to
sin-gle copy DNA (Petersonet al., 2000). Accordingly, BACs
containing markers linked to disease resistance genes, for example, can be directly selected from the genome brows-ers for subsequent acquisition and use as FISH probes, al-lowingin situlocalization of the markers and also poten-tially contributing to the recognition of possible distortions between maps. Another point is the identification of chro-mosomes in a cell and the association with their respective linkage groups and/or pseudochromosomes, as recently elucidated for soybean (Findleyet al., 2010).
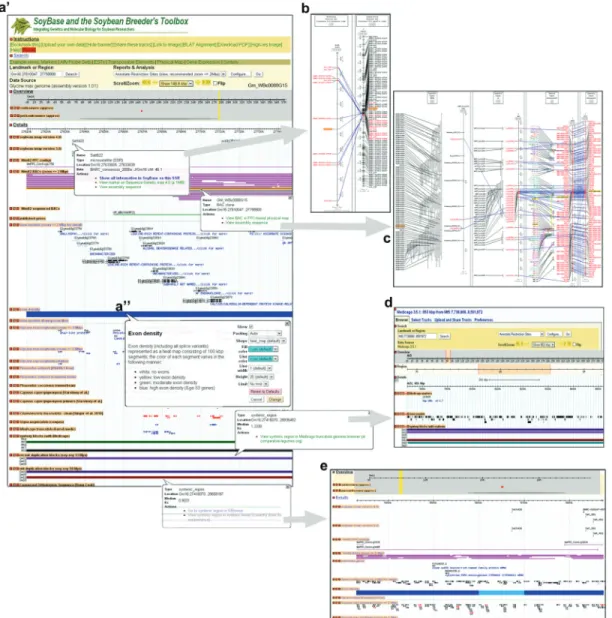
As an example, we present the analysis and selection
of BAC Gm_WBc0102N16 (102N16) and BAC
Gm_WBc0088G15 (88G15) regarding Gm16 (linkage
group J) on the SoyBase web server (Figure 2). Both BACs presented interesting characteristics like QTL (Quantitative Trait Loci) associated with drought tolerance or plant
height/yield or height of plant (102N16) and increasing yield (88G15) (BARC SSR markers at SoyBase) (Table 1, Figure 2b). Another important point is the selection of BACs with high exon density, because BACs from regions with lower exon densities are more likely to carry repetitive DNA sequences, which can promotein situhybridization at different sites,preventing its exact location in the karyo-type. BACs with high exon density, lacking repetitive re-gions, can be selected through a heat map (Figure 2a’) that consists of 100 kbp segments differentiated by a color in-tensity gradient representing exon density (including all splice variants). The BACs were also selected by the amount of Glyma1 gene models (Figure 2a’ and Table 2), as well as presenting aligned sequences from other legumes (Figure 2a’’), the presence of a given molecular marker (Figure 2c) or in synteny withMedicago truncatula(Figure 2d). Additionally, some regions of genome duplication in soybean could be observed (Figure 2e).
Evaluation of SSR oligonucleotides in the soybean genome
As a case study, we report the distribution of an SSR sequence (AAC)5in soybean, as assessed byin silico
analy-sis of repetitive sequences in SoyBase as compared with the FISH results. SSR microsatellites consist of small repeat units (1-6 bp) distributed in tandem throughout the geno-mes, they are found within structural genes or other repeti-tive sequences, as well as associated with heterochromatic regions (Heslop-Harrison, 2000; Cuadrado and Jouve 2010). Rapid SSR evolution has led to a genome-specific, species-specific and even chromosome-specific distribu-tion pattern (Begumet al., 2009). The frequency and distri-bution of different SSR oligonucleotide motifs have been the subject of intense investigation, especially in some par-tially or completely sequenced genomes, as inP. vulgaris (Schlueteret al., 2008) andG. max(Hytenet al., 2010a), aiming to understand the genomic organization of different species.
However, large SSR blocks are difficult to detect by in silicoanalysis, as they are observed as numerous short overlapping repeat units. FISH can more easily identify these blocks asin situmarking sites, often located in hetero-chromatic regions (Cuadrado and Jouve, 2007).
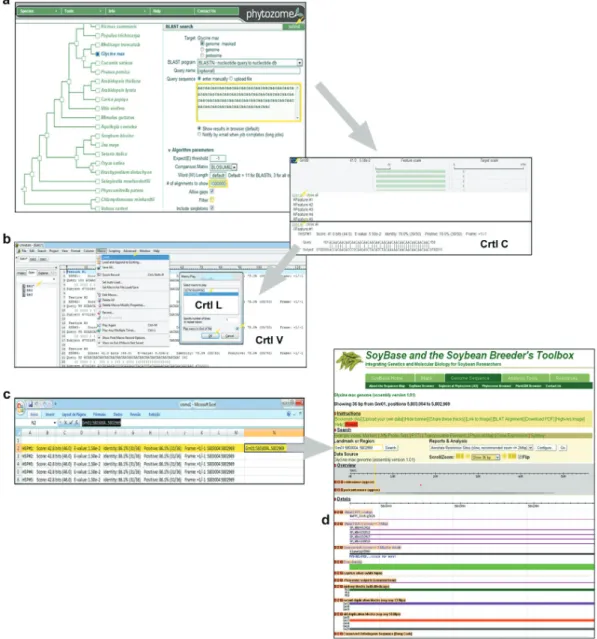
With this in mind we performed anin silicoscreening
of (AAC)5in the soybean unmasked genome using the
fol-lowing parameters in soybean genome browser at Phyto-zome: comparison matrix blossum62, e-value of 0.1 or less and low complexity filter off (Figure 3a). The oligo-nucleotide (AAC)5was used as the probe, with 77% pairing
identity as a cut-off parameter (similar to FISH stringency). Due to the repetitive nature of the probe, the BLASTn alignment created an artifact of sliding windows in continu-ous regions (Figure 3a), thus the alignment page was pro-cessed by a macro scripted in UltraEdit (Figure 3b), resulting in a formatted Microsoft Excel table that enabled Table
1 -Bacterial Artificial Chromosomes (BACs) containing the selected individual information on the exact position in the genome, repeat size in bp, exo n density and the molecular markers linked to QTLs, species that are aligned with soybean [Tentative Consensus (TC) sequence, transcript, gene, transcript assembly and EST], synteny and duplication s in the soybean genome. BAC* Localization Size (bp) Exon density Markers (SSR) mapped/ QTL associated Aligned Medicago truncatula synteny Duplication Gm_WBc:0088G15 Gm16: 27610047..27758800 -149 High Satt622/ Yield increasing Phaseolus vulgaris, Medicago truncatula, Vigna unguiculata, Cajanus cajan and Chamaecrista fasciculata Mt 5, Mt 8
Recent: Gm02:4150000..7170000 Old: Gm01:49330000..50180000 Gm11:5310000..5820000
Gm_WBc:0102N16 Gm16: 1231125..1382294 -151 High Satt405/ Drought toler-ance or plant height/ Yield or height of plant P. vulgaris, M. truncatula, V . unguiculata , C. cajan , C. fasciculata , Pisum sativum , Lotus japonicus , Lupinus albus and Glycine soja Mt 5, Mt 8
Recent: Gm07:2720000..6210000 Old: Gm03:46870000..47590000 Gm19:49620000..50390000
the size and limits of the matching region to be calculated in bp (base pairs) by subtracting the initial from the final alignment position for each region (Figure 3c). This infor-mation pointed to sequence alignment distribution over 15
soybean pseudochromosomes, with no matches forGm2,
Gm3,Gm12,Gm14 andGm18. The aligned regions were
then examined in the SoyBase genome browser for associ-ated genes, intragenomic duplications and synteny with other species (see Table 3).
A schematic representation of thein silicomapping on soybean pseudochromosomes has been constructed us-ing as size parameter the soybean pseudochromosome lengths available on the SoyBase web server, which range from 37.4 to 62.31 Mb. Considering a ratio of 1 Mb to 1 mm, the oligonucleotide repetitions were individually po-sitioned along the pseudochromosomes (Figure 4).
Thein silicomapping of the (AAC)5microsatellite in
soybean showed the presence of 32 sites, with sizes varying from 26 to 81 bp, located in regions of high to moderate gene density, sometimes associated with genes, and only one site for a region without genes. Four out of the 32 sites represented two overlapping repeat units each (Figure 4).
FISH protocol using BACs (102N16 and 88G15) and synthetic oligonucleotide SSR (AAC)5as probes
BAC probes
BAC clones were selected as previously described and ordered from theG. maxgenomic library at the Univer-sity of Arizona (USA) (www.genome.arizona.edu/orders). In this study, we used two soybean BACs belonging to
link-age group J (BAC 102N16 and 88G15 -Gm16).
BAC DNA was isolated using the Qiagen Plasmid Mini kit protocol (Qiagen), with some adaptations. The probes were labeled by nick translation with Cy3-11-dUTP (Amersham) following manufacturer’s instructions.
(AAC)5synthetic oligonucleotide and 45S rDNA probes
The synthetic oligonucleotide (AAC)5was indirectly
labeled with digoxigenin-11-dUTP by the end labeling method (DIG Oligonucleotide 3’-End Lab. Kit, 2nd gener-ation, Roche) according to the manufacturer’s instructions. R2, a plasmid with a 6.5 kb fragment of the 18S-5.8S-25S rDNA repeat unit fromA. thalianaL. (Wanzenböcket al., 1997), was isolated as described above and labeled by nick translation with biotin-16-dUTP and used as a probe in Gm13 identification.
FISH
For both probe types, cytological preparations were produced as described by Carvalho and Saraiva (1993), with some adaptations. For the FISH procedure, slides were pretreated as described by Pedrosaet al.(2003). Chromo-somes were denatured in 70% formamide in 2x SSC at 70 °C for 7 min and then dehydrated for 5 min in each con-centration of an ice-cold ethanol series (70% and 100%). Table 2- Gene models located in the BACs GM_WBc0088G15 and
GM_WBc0102N16 through navigation in the soybean genome browser (http://soybase.org/gbrowse/cgi-bin/gbrowse/gmax1.01/) in January 2011.
Gene models BAC Protein of interest and/or means of action
GM_WBc0088G15
Glyma16g23750 Heat shock protein binding
Glyma16g23760 No information
Glyma16g23770 No information
Glyma16g23780 No information
Glyma16g23790 Leucine Rich repeat containing protein (nucleic acid binding)
Glyma16g23800 Leucine Rich repeat containing protein (protein binding)
Glyma16g23810 No information
Glyma16g23820 Alcohol Dehydrogenase related (oxidoreductase
activity)
Glyma16g23830 Uncharacterized (Putative methyltransferase)
Glyma16g23840 Myb-like DNA-binding domain
Glyma16g23850 AP endonuclease (zinc ion binding)
Glyma16g23870 Calcium/Calmodulin dependent protein kinase
related (EF hand)
Glyma16g23880 FE(II)/ Ascorbate oxidase (oxidoreductase ac-tivity)
Glyma16g23890 No information [gb def: MKIAA0431 protein
(Fragment)]
Glyma16g23900 No information
GM_WBc0102N16
FJ014811.1 Clone cw129 leucine-rich repeat transmembrane
protein kinase mRNA
FJ014812.1 Clone cw130 leucine-rich repeat receptor-like
kinase mRNA
Glyma16g01660 Exocyst complex component Sec10 (vesicle
docking)
Glyma16g01670 No information
Glyma16g01680 (ubiquitin-like-protein ligase activity)
Glyma16g01690 No information
Glyma16g01700 Zinc finger, C3HC4 type (RING finger)
Glyma16g01710 Ring finger protein 11(NEDD4 WW
DO-MAIN-BINDING PROTEIN 2)
Glyma16g01730 No information
Glyma16g01740 No information
Glyma16g01750 Protein-tyrosine kinase activity
Glyma16g01760 Calcineurin-like phosphoesterase
Glyma16g01770 DVL family
Glyma16g01780 RNA binding protein (nucleic acid binding)
Glyma16g01790 Serine threonine protein kinase, plant type (pro-tein-tyrosine kinase activity)
Glyma16g01800 NADH Dehydrogenase
Glyma16g01810 26S Protease Regulatory Subunit (ATP binding)
Glyma16g01820 Uncharacterized conserved protein (DUF2343)
Glyma16g01830 Integral to membrane
Probe denaturation, post-hybridization washes and
detec-tion were performed according to Heslop-Harrison et al.
(1991), except for the stringent wash, which was performed with 0.1x SSC at 42 °C. Probes labeled with digoxigenin-11-dUTP were detected using sheep anti-digoxigenin-FITC (Roche) and amplified with anti-sheep-anti-digoxigenin-FITC (Sigma), in 1% (w/v) BSA. Biotin probes were detected us-ing mouse anti-biotin (Dako) and amplified with rabbit anti-mouse TRITC conjugate (Dako) in 1% (w/v) BSA. All preparations were counter-stained and mounted with
2mg/mL DAPI in Vectashield (Vector).
Cells were analyzed on a Leica DMLB microscope and images of the best cells were captured on a Leica DFC 340FX camera, using Leica CW 4000 software. All images were optimized for contrast and brightness, and for the
su-perimposed images, DAPI staining image was converted to grayscale, while the BACs 88G15 and 102N16 were artifi-cially colored in yellow and orange, respectively. Images were superimposed, using the lighten tool. All these pro-cesses were done using Adobe Photoshop CS4 (Adobe Sys-tems Incorporated) (Figure 5).
Comparison of cytogenetic maps with in silico analysis
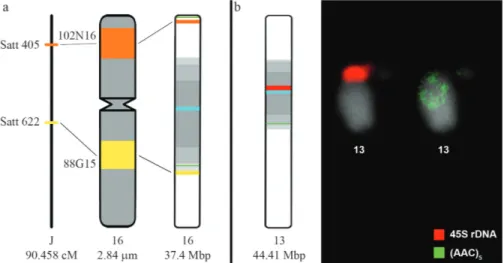
Thein silicoselected BACs 88G15 and 102N16 were in situmapped as a single signal inGm16. BAC 102N16 was located at the subterminal region of the short chromo-some arm, while BAC 88G15 aligned at the intercalary re-gion of the long chromosome arm (Figure 5a). The
chromo-some size was measured (2.84mm), as well as the exact
location and site size using the Micromeasure program, en-Figure 3-In silicoof (AAC)5SSR oligonucleotide. (a) Anchoring by using the BLASTn algorithm at http://www.phytozome.com/search.php; (b) screen
abling us to determine the physical distance between these markers (1.5 m m or 53% of the total chromosome length), which was represented by a chromosome-specific ideo -gram (Figure 6a). The positions of the cytogenetic markers were ex -plored in a comparative analysis with the contig physical map, constructed by in silico analysis, and integrated with the available soybean genetic map, revealing some diver -gence. Comparing in situ and in silico results, the observed discrepancies may be related either to the heterochromatin condensation behavior in mitotic metaphase chromosomes, or the impossibility to computationally determine the posi -tion of the remaining non-anchored 17.7 Mb scaffolds in the soybean physical map (Schmutz et al. , 2010). More -over, comparing the in situ analysis to the linkage map, it appears that Satt622 and Satt405 located in BACs 88G15 and 102N16, respectively, are at a genetic distance corre -sponding to 33 cM between markers (or 36.5% of the J link -genetic and FISH maps of soybean 343 Figure 4 -Representation of the (AAC) 5 SSR oligonucleotide in silico dis -tribution, centromeric and pericentromeric regions of each Glycine max pseudochromosome, as well the in silico localization of BACs 88G15 and 102N16 (both on Gm 16) and 5S and 45S rDNA ( Gm 19 and Gm 13, respec -tively). Information sourced at http://soybase.org/gbrowse/cgi-bin/ gbrowse/gmax1.01/.
Code Localization Size (bp) Exon density Gene Function Synteny Duplication
(AAC)5- 1 Gm01:5803004..5802969 35 Moderate Glyma01g05980 Transcription factor Phaseolus vulgaris Gm02
(AAC)5- 2 Gm01:1783436..1783399 37 High Glyma01g02270 - - Gm09
(AAC)5- 3 Gm04:44935690..44935640 50 High Glyma04g38560 No apical meristem (NAM) protein P. vulgaris Gm06
(AAC)5- 4 Gm04:46981082..46981048 34 High Glyma04g41120 Secretory pathway protein - Gm06
(AAC)5- 5 Gm05:29695067..29695108 41 Moderate Glyma05g23860 Pentatricopeptide repeat -Containing protein Medicago truncatula;
Vigna unguiculata
Gm17
(AAC)5- 6 Gm05:1164061..1163995 66 High - - - Gm17
(AAC)5- 7 Gm06:3929642..3929593 49 High - - - Gm04
(AAC)5- 8 Gm06:12312453..12312414 39 High Glyma06g15640 WD domain, G-beta repeat - Gm04
(AAC)5- 9 Gm06:3929642..3929608 34 High - - - Gm04
(AAC)5- 10 Gm06:13222198..13222239 41 High DQ822886.1 Glyma06g16820 MYB transcription factor MYB56 (MYB56)
mRNA
- Gm04
(AAC)5- 11 Gm07:4085718..4085773 55 High - - P. vulgaris Gm16
(AAC)5- 12 Gm07:6265279..6265248 31 High - - -
age group) of the soybean genetic map, and indicating a distortion between the cytogenetic and genetic distances. Such distortions have recently been observed in compara-tive map analyses forP. vulgaris (Pedrosa-Harandet al., 2009; Fonsecaet al., 2010) andOryza sativa(Chenget al., 2001), and are attributed to the suppression of recombina-tion events in pericentromeric regions.
Regarding the SSR oligonucleotide (AAC)5, a
com-parativein silicoandin situanalysis of its location showed that of the 31 sites observedin silico, 20 were found outside the pericentromeric region (Figure 4). Moreover, the FISH analysis revealed different (AAC)5hybridization sites
scat-tered throughout most chromosomes, especially in the pro-ximal regions of two chromosome arms (Figure 5b). Such information raised the hypothesis that FISH has also shown sites associated with heterochromatic regions, not revealed by thein silicoanalysis because of their absence in the as-sembled pseudochromosomes, due to the fact that the SoyBase platform excluded a fraction of the constituent
scaffolds that remained non-anchored (Schmutz et al.,
2010). The absence of such repetitive regions may be justi-fied by technical difficulties in their clustering/assembling using bioinformatic tools. Besides, many genome projects face the difficulties of sequencing microsatellite rich re-Figure 6- Comparative analysis of the genetic (cM*), cytogenetic (mm) andin silico(Mbp*) maps ofGlycine max. (a) Ideogram showing thein situ
map-ping of BACs 88G15 (yellow) and 102N16 (orange) on chromosome 16, compared to thein silicomapping of pseudochromosomeGm16 and its corre-sponding linkage group J. The same chromosomeGm16 was used as standard for chromosome size and positioning of the linkage group. Lines indicate the distortion between cytogenetic and genetic distances as well as cytogenetic andin silicodistances. (b) Complementary analysis of the (AAC)5
oligonucleotide distribution sites (green) and 45S rDNA site (red) byin silicoandin situanalysis on the pseudochromosome and chromosomeGm13, re-spectively. *Information sourced at http://soybase.org/gbrowse/cgi-bin/gbrowse/gmax1.01/ in January 2011.
gions, due to DNA polymerase slippage during PCR, caus-ing variation and sometimes the “compression point” effect (Liepeltet al., 2005).
Thus, the identified discrepancies support the idea thatin silicoandin situanalyses are complementary to each other, facilitating a better understanding of the physical structure and genomic organization, mainly regarding re-petitive DNA rich regions. Anin silicoandin situ compara-tive analysis for chromosome 13 carrying the 45S rDNA further supports our findings (Figure 6b).
Synteny with other crops
From a macrosyntenic point of view, a broad conser-vation of genome macrostructure is observed among le-gumes, especially within the galegoid clade, also highlighting inferred chromosomal rearrangements that may justify the variation in chromosome number between these species (Choiet al., 2004). Recently, synteny map-ping between common bean and soybean (phaseoloid le-gumes) revealed 55 syntenic blocks of shared loci, with a mean size of 32 cM and seven loci on average. By compar-ing the location of these blocks, it is very clear that nearly all segments of the common bean genome mapped to two segments of the soybean genome (McCleanet al., 2010).
More recently, the integration of genetic and cyto-genetic maps with sequencing data has provided a greater number of marks and information about genome organiza-tion and evoluorganiza-tion, facilitating a better understanding of chromosome homeologies and macrosynteny conservation among species. Using SoyBase, it was possible to identify alignments and synteny among soybean pseudochromo-somes, as well as among soybean and other legume chro-mosomes. For instance, the BACs used in the present work (88G15 and 102N16) have homologies with other legumes.
BAC 88G15 aligned to sequences of Cajanus cajan,
Chamaecrista fasciculata, P. vulgaris, Medicago truncatula and Vigna unguiculata, whereas 102N16 aligned to all the aforementioned species, as well as to Glycine soja,Lotus japonicus,Pisum sativumandLupinus albus(Table 1). Regarding synteny, 88G15 and 102N16 were syntenic toM. truncatulachromosomesMt5 andMt8,
while 102N16 was syntenic to Mt8. Table 1 shows the
synteny (duplications) of those BACs to other soybean chromosomes. Recently, an association between soybean cytogenetic and physical maps was successfully conducted
(Findley et al., 2010), enabling not only a comparative
study between soybean andG. soja,but also the
simulta-neous identification of 20 chromosome pairs in soybean mitotic preparations, as well as the establishment of the re-lationship with their pseudochromosomes.
To date, no investigation on the conservation of chro-mosome position and colinearity has been made available for legume species regarding aquaporin coding genes. A re-cent physical mapping of wheat aquaporin genes confirmed many orthologous relationships between wheat and rice
and/or barley aquaporin genes, many of which were con-served in the syntenic genome areas (Forrest and Bhave, 2010). Our data is the first to explore this gene family within the soybean genome, raising evidence of past in-tense duplication events in soybean, followed by genome reorganization that retained most of the new aquaporin cod-ing genes. Given that most soybean chromosome regions
correspond to two or more chromosome segments fromP.
vulgaris, it is likely that some of the aquaporin coding genes are conserved in the syntenic regions of both organ-isms.
Acknowledgments
The authors wish to thank the Brazilian agencies Conselho Nacional de Desenvolvimento Científico e Tec-nológico (CNPq, Brazil, Genosoja grant 552735/2007-8) and Coordenação de Pessoal de Nível Superior (CAPES, Brazil) for their financial support, and the University of Ar-izona (USA) for kindly providing the soybean BACs.
References
Begum R, Alam SS, Menzel G and Schmidt T (2009) Compara-tive molecular cytogenetics of major repetiCompara-tive sequence
families of threeDendrobiumspecies (Orchidaceae) from
Bangladesh. Ann Bot 104:863-872.
Carvalho CR and Saraiva LS (1993) An air drying technique for maize chromosomes without enzymatic maceration. Bio-techn Histochem 68:142-145.
Chaumont F, Barrieu F, Wojcik E, Chrispeels MJ and Jung R (2001) Aquaporins constitute a large and highly divergent protein family in maize. Plant Physiol 125:1206-1215. Chaumont F, Mosheilon M and Daniels MJ (2005) Regulation of
plant aquaporin activity. Biol Cell 97:749-764.
Cheng Z, Presting GG, Buell CR, Wing RA and Jiang J (2001) High-resolution pachytene chromosome mapping of bacte-rial artificial chromosomes anchored by genetic markers re-veals the centromere location and the distribution of genetic recombination along chromosome 10 of rice. Genetics 157:1749-1757.
Choi H-K, Mun J-H, Kim D-J, Zhu H, Baek J-M, Mudge J, Roe B,
Ellis N, Doyle J, Kiss GB,et al.(2004) Estimating genome
conservation between crop and model legume species. Proc Natl Acad Sci USA 101:15289-15294.
Choi IY, Hyten DL, Matukumalli LK, Song Q, Chaky JM,
Qui-gley CV, Chase K, Lark KG, Reiter RS, Yoon MS,et al.
(2007) A soybean transcript map: Gene distribution, haplo-type and single nucleotide polymorphism analysis. Genetics 176:685-696.
Cuadrado A and Jouve N (2007) The nonrandom distribution of long clusters of all possible classes of trinucleotide repeats in barley chromosomes. Chromosome Res 15:711-720. Cuadrado A and Jouve N (2010) Chromosomal detection of
sim-ple sequence repeats (SSRs) using nondenaturing FISH (ND-FISH). Chromosoma 119:495-503.
Di C, Xu W, Su Z and Yuan JS (2010) Comparative genome anal-ysis of PHB gene family reveals deep evolutionary origins and diverse gene function. BMC Bioinformatics 11(Suppl. 6):S22.
Duvick J, Fu A, Muppirala U, Sabharwal M, Wilkerson MD, Lawrence CJ, Lushbough C and Brendel V (2008) PlantGDB: A resource for comparative plant genomics. Nu-cleic Acids Res 36:D959-65.
Findley SD, Cannon S, Varala K, Du J, Ma J, Hudson ME,
Birchler JA and Stacey G (2010) A fluorescencein situ
hy-bridization system for karyotyping soybean. Genetics 185:727-744.
Fonsêca A, Ferreira J, Santos TRB, Mosiolek M, Bellucci E,
Kami J, Gepts P, Geffroy V, Schweizer D, Santos KGB,et
al. (2010) Cytogenetic map of common bean (Phaseolus
vulgarisL.). Chromosome Res 18:487-502.
Forrest KL and Bhave M (2010) Physical mapping of wheat aquaporin genes. Theor Appl Genet 120:863-873.
Heslop-Harrison JS (2000) Comparative genome organization in plants: From sequence and markers to chromatin and chro-mosomes. Plant Cell 12:617-635.
Heslop-Harrison JS, Schwarzarcher T, Anamthawat-Jónsson K,
Leitch AR and Shi M (1991)In situhybridization with
auto-mated chromosome denaturation. Technique 3:109-115. Hougaard BK, Madsen LH, Sandal N, Moretzsohn M de C,
Fredslund J, Schauser L, Nielsen AM, Rohde T, Sato S,
Tabata S,et al.(2008) Legume anchor markers link syntenic
regions between Phaseolus vulgaris, Lotus japonicus,
Medicago truncatulaandArachis. Genetics 179:2299-2312. Hyten DL, Cannon SB, Song Q, Weeks N, Fickus EW, Shoe-maker RC, Specht JE, Farmer AD, May GD and Cregan PB (2010a) High-throughput SNP discovery through deep rese-quencing of a reduced representation library to anchor and orient scaffolds in the soybean whole genome sequence. BMC Genomics 11:e38.
Hyten DL, Choi I-Y, Song Q, Specht JE, Carter TE, Shoemaker RC, Hwang E-Y, Matukumalli LK and Cregan P (2010b) A high density integrated genetic linkage map of soybean and the development of a 1,536 Universal Soy Linkage Panel for QTL mapping. Crop Sci 50:960-968.
Ishikawa F, Suga S, Uemura T, Sato MH and Meshima M (2005) Novel type aquaporin SIPs are mainly localized to the ER
membrane and show cell-specific expression inArabidopsis
thaliana. FEBS Lett 579:5814-5820.
Johanson U, Karlsson M, Johansson I, Gustavsson S, Sjovall S, Fraysse L, Weig AR and Kjellbom PJ (2001) The complete
set of genes encoding major intrinsic proteins inArabidopsis
provides a framework for a new nomenclature for major in-trinsic proteins in plants. Plant Physiol 126:1358-1369. Kaldenhoff R and Fischer M (2006) Functional aquaporin
diver-sity in plants. Biochim Biophys Acta 1758:1134-1141. Kao F, Cheng Y-Y, Chow T-Y, Chen H-H, Liu S-M, Cheng C-H
and Chung M-C (2006) An integrated map ofOryza sativa
L. chromosome 5. Theor Appl Genet 112:891-902. Kevei Z, Seres A, Kereszt A, Kaló P, Kiss P, Tóth G, Endre G and
Kiss GB (2005) Significant microsynteny with new
evolu-tionary highlights is detected betweenArabidopsisand
le-gume model plants despite the lack of macrosynteny. Mol Genet Genomics 274:644-657.
Kruse E, Uehlein N and Kaldenhoff R (2006) The aquaporins. Ge-nome Biol 7:e206.
Liepelt S, Kuhlenkamp V, Anzidei M, Vendramin GG and Ziege-nhagen B (2005) Pitfalls in determining size homoplasy of microsatellite loci. Mol Ecol Notes 1:332-335.
Lim GAC, Jewell EG, Li X, Erwin TA, Love C, Batley J, Span-genberg G and Edwards D (2007) A comparative map
vie-wer integrating genetic maps forBrassicaandArabidopsis.
BMC Plant Biol 7:e40.
Liu Q, Wang H, Zhang Z, Wu J, Feng Y and Zhu Z (2009) Diver-gence in function and expression of the NOD26-like intrin-sic proteins in plants. BMC Genomics 10:e142.
Mandáková T and Lysak MA (2008) Chromosomal phylogeny and karyotype evolution in x = 7 crucifer species (Brassicaceae). Plant Cell 20:2559-2570.
Maeshima M and Ishikawa F (2008) ER membrane aquaporins in plants. Eur J Physiol 456:709-716.
McClean PE, Mamidi S, McConnell M, Chikara S and Lee R (2010) Synteny mapping between common bean and soy-bean reveals extensive blocks of shared loci. BMC Geno-mics 11:e184.
Pedrosa A, Vallejos CE, Bachmair and Schweizer D (2003)
Inte-gration of common bean (Phaseolus vulgarisL.) linkage and
chromosomal maps. Theor Appl Genet 106:205-212. Pedrosa-Harand A, Kami J, Gepts P, Geffroy V and Schweizer D
(2009) Cytogenetic mapping of common bean chromoso-mes reveals a less compartmentalized small-genome plant species. Chromosome Res 17:405-417.
Peterson DG, Tomkins JP, Frisch DA, Wing RA and Paterson AH (2000) Construction of plant artificial chromosome (BAC) libraries: An illustrated guide. J Agric Genet 5:1-3. Sakurai J, Ishikawa F, Yamaguchi T, Uemura M and Maeshima M
(2005) Identification of 33 rice aquaporin genes and analysis of their expression and function. Plant Cell Physiol 46:1568-1577.
Schlueter JA, Goicoechea JL, Collura K, Gill N, Lin J-Y, Yu Y,
Kudma D, Zuccolo A, Vallejos CE, Muñoz M,et al.(2008)
BAC-end sequence analysis and draft physical map of the
common bean (Phaseolus vulgarisL.) genome. Trop Plant
Biol 1:40-48.
Schmutz J, Cannon SB, Schlueter J, Ma J, Mitros T, Nelson W,
Hyten DL, Song Q, Thelen JJ, Cheng J,et al.(2010)
Ge-nome sequence of the paleopolyploid soybean. Nature 463:178-183.
Schranz ME and Mitchell-Olds T (2006) Independent ancient polyploidy events in the sister families Brassicaceae and Cleomaceae. Plant Cell 18:1152-1165.
Sen TZ, Harper LC, Schaeffer ML, Andorf CM, Seigfried TE, Campbell DA and Lawrence CJ (2010) Choosing a genome browser for a model organism database: Surveying the Mai-ze community. Database 2010:baq007.
Shoemaker RC, Schlueter J and Doyle JJ (2006) Paleopolyploidy and gene duplication in soybean and other legumes. Curr Opin Plant Biol 9:104-109.
Shultz JL, Kurunam D, Shopinski K, Iqbal MJ, Kazi S, Zobrist K,
Bashir R, Yaegashi S, Lavu N, Afzal JA,et al.(2006) The
soybean genome database (soyGD): A browser for display of duplicated, polyploidy, regions and sequence tagged sites
on the integrated physical and genetic maps ofGlycine max.
Nucleic Acids Res 34:758-765.
Glycine max, Lotus japonicus and Medicago truncatula. Genet Mol Biol 35(suppl 1):247-259.
Song QJ, Marek LF, Shoemaker RC, Lark KG, Concibido VC, Delannay X, Specht JE and Cregan PB (2004) A new inte-grated genetic linkage map of the soybean. Theor Appl Genet 109:122-128.
Spannagl M, Noubibou O, Haase D, Yang L, Gundlach H, Hin-demitt T, Klee K, Haberer G, Schoof H and Mayer KFX (2007) MIPSPlantsDB – Plant database resource for integra-tive and comparaintegra-tive plant genome research. Nucleic Acids Res 35:D834-40.
Wanzenböck EM, Schöfer C, Schweizer D and Bachmair A (1997) Ribosomal transcription units integrated via T-DNA transformation associate with the nucleolus and do not
re-quire upstream repeat sequences for activity inArabidopsis
thaliana. Plant J 11:1007-1016.
Youens-Clark K, Buckler E, Casstevens T, Chen C, Declerck G, Derwent P, Dharmawardhana P, Jaiswal P, Kersey P,
Kar-thikeyan AS,et al.(2010) Gramene database in 2010:
Up-dates and extensions. Nucleic Acids Res 39:D1085-94.
Zhao CX, Shao HB and Chu LY (2008) Water flow through plant living cells. Colloids Surfaces B 62:163-172.
Internet Resources
ENTREZ Genome Project,
http://www.ncbi.nlm.nih.gov/sites/entrez?db = genomeprj (Mar, 2011).
GRAMENE, http://www.gramene.org/ (Mar, 2011). LIS, Legume Information System,
http://www.comparative-legumes.org/.
PlantGDB, http://www.plantgdb.org/ (Mar, 2011). Phytozome, http://www.phytozome.net/ (Mar, 2011). SoyBase and the soybean breeder’s toolbox,
http://www.soybase.org (Mar, 2011).
Soybean genetic map, http://soybeanbreederstoolbox.org/cmap/ cgi-bin/cmap/viewer (Mar, 2011).